Structural and kinetic investigation of the hydride composite Ca(BH4)2 + MgH2 system doped with NbF5 for solid-state hydrogen storage†
Received
19th June 2015
, Accepted 21st September 2015
First published on 21st September 2015
Abstract
Designing safe, compact and high capacity hydrogen storage systems is the key step towards introducing a pollutant free hydrogen technology into a broad field of applications. Due to the chemical bonds of hydrogen–metal atoms, metal hydrides provide high energy density in safe hydrogen storage media. Reactive hydride composites (RHCs) are a promising class of high capacity solid state hydrogen storage systems. Ca(BH4)2 + MgH2 with a hydrogen content of 8.4 wt% is one of the most promising members of the RHCs. However, its relatively high desorption temperature of ∼350 °C is a major drawback to meeting the requirements for practical application. In this work, by using NbF5 as an additive, the dehydrogenation temperature of this RHC was significantly decreased. To elucidate the role of NbF5 in enhancing the desorption properties of the Ca(BH4)2 + MgH2 (Ca-RHC), a comprehensive investigation was carried out via manometric measurements, mass spectrometry, Differential Scanning Calorimetry (DSC), in situ Synchrotron Radiation-Powder X-ray Diffraction (SR-PXD), X-ray Absorption Spectroscopy (XAS), Anomalous Small-Angle X-ray Scattering (ASAXS), Scanning and Transmission Electron Microscopy (SEM, TEM) and Nuclear Magnetic Resonance (NMR) techniques.
1 Introduction
Hydrogen is regarded as a promising clean energy carrier for the near future. It has the highest energy density per unit mass (∼142 MJ kg−1) compared to gasoline (44 MJ kg−1), and moreover, its combustion product is only water. However, due to the gaseous nature of hydrogen under atmospheric conditions it has a low energy density per unit volume (∼0.01 MJ L−1) compared to gasoline (∼34 MJ L−1), for example. Solid state hydrogen storage in metal hydrides offers an attractive alternative to hydrogen pressurization, liquefaction or adsorption by materials through physisorption (physical hydrogen storage methods). Metal hydrides have up to 60% higher volumetric hydrogen storage density than that achieved by physical methods.1–3 Because of their high gravimetric capacity, light complex metal hydrides appear to be especially suited for solid state hydrogen storage in mobile applications. In 1997,4 reported successful reversible hydrogen storage in a catalysed complex metal hydride (NaAlH4). Since then, several complex metal hydrides and their composites have been investigated as potential hydrogen storage materials.5–12 Among them Ca(BH4)2 is one of the most promising candidates for mobile applications,13 owing to a low theoretical decomposition reaction enthalpy of 32 kJ mol−1 H2, high gravimetric and volumetric hydrogen capacities of 11.5 wt% H2 and 130 kg m−3,3,14–17 respectively. However, several possible desorption products (CaB12H12, CaB2H6, CaB2Hx and amorphous boron) were recently reported for Ca(BH4)2.18,19–22 These products are kinetically and/or thermodynamically stable; hence the rehydrogenation process under mild conditions is limited. Furthermore, the decomposition temperature of Ca(BH4)2 is also very close to its melting point (370 °C)23 and if melting occurs it can affect microstructure and surface area of the material, causing irreversible reactions. A concept to favourably alter the reaction enthalpy of metal hydrides is known as Reactive hydride composites (RHCs).24,25 This approach is applied in the present work to influence both the reaction pathway and the reaction enthalpy of Ca(BH4)2 by addition of MgH2. The decomposition reaction path of Ca(BH4)2 + MgH2 and therefore the final decomposition products strongly depend on the applied experimental conditions, the presence of dopants, and preparation procedure.26–29 In particular, magnesium plays a key role for the formation of CaB6 and therefore for the reversibility of the Ca-RHC system, as it was previously described by Kim et al.16 Recently, the role of Mg as a nucleation agent for CaB6 was reported by Bonatto Minella et al.27 Although the reversibility of the Ca-RHC is improved compared to Ca(BH4)2, the dehydrogenation temperature of ∼350 °C is still too high for automotive applications. In this work, we demonstrate that the dehydrogenation temperature of the composite system is reduced to about 250 °C by adding 0.1NbF5 mol into the Ca-RHC. To clarify the role of the NbF5 additive on the dehydrogenation properties of the composite system extended studies were carried out and the most significant results are presented in this work. Coupled manometric – calorimetric measurements were performed to evaluate the desorption enthalpy of the NbF5 doped system (to be compared with the undoped one) and to calculate the overall desorption activation energy (Ea) in the pure Ca-RHC and in the doped Ca-RHC + 0.1NbF5 composite system. In situ Synchrotron Radiation Powder-X-Ray Diffraction (SR-PXD) measurements of Ca-RHC and Ca-RHC + 0.1NbF5 were performed to determine the initial crystalline phases and to follow the phase evolution upon the dehydrogenation process. X-ray Absorption Spectroscopy (XAS) measurements were employed to determine the local environment of Nb-atoms and their chemical state in the hydride matrix. Moreover, Anomalous Small-Angle X-Ray Scattering (ASAXS) measurements at the K-absorption edge of niobium were utilized to determine the Nb-containing nanostructures in the matrix. Scanning Electron Microscopy (SEM) investigations coupled with Energy Dispersive X-ray Spectroscopy (EDS) analyses and High Resolution Transmission Electron Microscopy (HR-TEM) investigations were undertaken to further study the local nanostructure and phase composition of the Ca-RHC and Ca-RHC + 0.1NbF5 samples. 11B solid state NMR measurements were carried out to identify the non-crystalline products that can be present during and after the milling and dehydrogenation process of Ca-RHC and Ca-RHC + 0.1NbF5. The results of this work contribute to a deeper understanding of the catalytic effects of transition metal (TM)-based additives on the kinetic properties of the RHCs.
2 Experimental
All milling procedures and preparation of the samples for the various measurements in this work were carried out inside a glove box under a continuously purified argon atmosphere (H2O and O2 < 10 ppm).
2.1 Sample preparation
The raw materials were purchased from: Sigma-Aldrich [Ca(BH4)2 (purity > 98.8%), MgH2 (purity > 95%), and NbF5 (purity > 99.9%)], and from Alfa Aesar [NbB2 with the highest purity available (99.99%)]. Mixed Ca(BH4)2−MgH2 (Ca-RHC) samples were prepared with and without the addition of 0.1 mol NbF5. Magnesium hydride was first pre-milled for 5 h before mixing and milling with Ca(BH4)2 or Ca(BH4)2 + 0.1NbF5 (Ca-RHC + 0.1NbF5). The mixtures Ca(BH4)2 + MgH2/Ca(BH4)2 + MgH2 + 0.1NbF5 were subsequently ball milled at high energy for 5 hours in a stainless steel vial with stainless steel balls and a ball to powder ratio of 10![[thin space (1/6-em)]](https://www.rsc.org/images/entities/char_2009.gif) :
:![[thin space (1/6-em)]](https://www.rsc.org/images/entities/char_2009.gif) 1. All milling procedures were performed in a SPEX 8000 mill.
1. All milling procedures were performed in a SPEX 8000 mill.
2.2 DSC-manometric and mass spectrometry measurements
Coupled manometric–calorimetric measurements were performed on both the doped and the undoped samples by connecting a PCTPro-2000 instrument (Setaram &Hy-Energy, France) with a Sensys high-pressure DSC (Setaram, France). Desorption measurements were performed by heating the samples (about 30 mg) from room temperature up to 500 °C at 3 °C min−1 under vacuum. For determination of the Ea measurements were performed on the undoped and the doped samples under the same pressure conditions by heating at 1, 3, 7 and 10 °C min−1. Mass spectrometry (MS) measurements were performed by using the HPR-20 Q/C apparatus (Hiden-Analytical Ltd, UK).
2.3
In situ SR-PXD measurements
In situ SR-PXD measurements were carried out at the powder diffraction beamline D3 at the DORIS III synchrotron storage ring (at DESY, in Hamburg, Germany). The samples were loaded into single crystal sapphire tubes in a glove box. The sapphire tubes were subsequently mounted in a gas pressure cell and exposed to a monochromatic synchrotron beam. All details of the gas pressure cell and experimental set up are given in the work of Bösenberg et al.30 The diffracted intensities were collected by a MarCCD-165 area detector. The wavelength of incident photons was chosen to be 0.5 Å. Sample-to-detector distance was set to roughly 125 mm. The sample was heated by a ceramic oven placed under the capillary while the sample temperature was measured by a thermocouple positioned close to the specimen in the capillary and controlled with a PID regulator. The temperature and pressure parameters were the same as for the volumetric measurements. The acquired 2D-patterns were further processed and integrated to a 1D curve using the program Fit2D31 and the program FindIt (ICSD-database)32 was used for phase identification.
2.4 XAS measurements
X-ray absorption spectroscopy (XAS) measurements were performed on the C-beamline at DORIS III. The ideal amount of powder to be used for measurements was calculated by the program “XAFSMASS”.33 The samples were then mixed with dry cellulose (∼50 mg) in a mortar and pressed (5 bar) into pellets of 10 mm diameter. The pellets were placed in an aluminium sample holder and sealed with Kapton tape (55 μm in thickness) to avoid oxidation of the samples. Nb metallic, NbF5 and NbB2 were measured also as reference materials in the XANES range. The measurements were recorded in transmission mode at the K-edge of Nb (18.99 keV). The ionisation chambers were filled with Argon. Data acquisition was initiated at 200 eV prior to the K-absorption edge. The step width was chosen to be 2 eV (acquisition time of 60 s) up to 200 eV above the K-absorption edge, in order to have a high resolution of the X-ray absorption near edge structure (XANES). After the XANES-range the step width was increased to 5 eV (acquisition time of 180 s) up to 500 eV above the edge. Thereafter the step width was once again increased 7 eV (acquisition time of 300 s). Data acquisition was terminated at 1300 eV above the K-absorption edge, in order to have the maximum available information about the extended absorption fine structure (EXAFS) part of the XAS-spectra. For each sample three XAS-spectra – were acquired. After discarding the temporary errors and aligning of respective XAS-spectra, an average spectrum of the data was built to improve the overall data quality. XAS data processing and analysis were performed by using the “IFEFFIT” software package.34
2.5 SEM and TEM measurements
The material morphology and material local composition were characterized by SEM, using an EvoMA10 (Zeiss, Germany) microscope equipped with a LaB6 filament. The composition of the samples was determined by EDS, using an INCA Energy 350 X Max detector from Oxford Instruments, equipped with a Be window. A cobalt standard was used for the calibration of the quantitative elementary analysis. To avoid oxidation during the material handling, a special custom-made sample holder was used. The sample was loaded into the sample holder in a glove box and afterwards vacuum was created inside the holder to transport the sample to the SEM. To further elucidate the nanoscopic structures and composition of the material, TEM was performed on a JEOL 3000F FEG TEM at an operating voltage of 300 kV. Samples were suspended in toluene then ultrasonicated before dropping onto 200 mesh holey carbon coated copper grids. Samples were briefly exposed to air (up to a minute) before being inserted into the TEM column.
2.6 NMR measurements
11B solid state NMR measurements were carried out on a 500 MHz (11B frequency: 160.46 MHz) Bruker Avance III HD NMR spectrometer equipped with a Bruker 4 mm BB/1H-19F probe. Rotation speeds between 8 kHz and 12 kHz were used and due to the high 11B background of the probe all measurements were made employing the zgbs sequence. The repetition times were chosen in such a way that the sample was fully relaxed. Chemical shift values are given relative to BF3Et2O using a 0.1 M H3BO3 solution as a secondary standard at 19.6 ppm.
2.7 ASAXS measurements
For anomalous small-angle X-ray scattering measurements both as-milled and dehydrogenated Ca-RHC + 0.1NbF5 samples were prepared. The Nb-ASAXS measurements were carried out on the beamline B1 at DORIS III. All measurements were done near the Nb K-edge (18.99 keV) to characterize the Nb containing phases upon dehydrogenation. The samples were mounted in an aluminum sample holder with a circular hole of 5 mm in diameter and 0.25 mm thickness. The samples were sealed with Kapton tape to avoid any change in oxidation state of the material. All SAXS patterns were acquired at four distinct energies below the K-edge of Nb and two sample-to-detector distances (Dmin = 885 mm and Dmax = 3585 mm) to cover the maximum available q range. Here, q is the magnitude of the scattering vector: q = (4π/λ)sin![[thin space (1/6-em)]](https://www.rsc.org/images/entities/char_2009.gif) θ, where λ is the X-ray wavelength and 2θ is the scattering angle. The SAXS patterns were collected with a Pilatus 300k detector. The beamline was equipped with a double crystal Si(311)-monochromator with the wavelength resolution of Δλ/λ < 10−4. All selected energies with their corresponding anomalous dispersion factors are listed in Table 1.
θ, where λ is the X-ray wavelength and 2θ is the scattering angle. The SAXS patterns were collected with a Pilatus 300k detector. The beamline was equipped with a double crystal Si(311)-monochromator with the wavelength resolution of Δλ/λ < 10−4. All selected energies with their corresponding anomalous dispersion factors are listed in Table 1.
Table 1 Selected energies for the ASAXS-measurements at the K-edge of Nb and the corresponding anomalous dispersion factors35
|
E
i
|
Energy [eV] |
f′ |
f′′ |
|
E
1
|
18522 |
−3.095 |
0.557 |
|
E
2
|
18822 |
−4.074 |
0.541 |
|
E
3
|
18924 |
−5.027 |
0.535 |
|
E
4
|
18926 |
−5.940 |
0.533 |
2.8 BET measurements
BET surface area measurements were performed with a micromeritics ASAP 2020 Surface Area and Powder Analyser using N2 as adsorbent gas at a sample temperature of liquid nitrogen. Prior to the measurements all samples have been outgassed for 24 h under vacuum at a temperature of 100 °C to remove impurities adsorbed to the surface. Both the doped and undoped samples were measured after milling procedure as well as after first dehydrogenation. The highest possible sample amount (1.5 grams) together with a filler rod was used to ensure a minimal dead volume inside the sample holder for higher measurement accuracy.
3 Results
3.1 Mass-spectroscopy, manometric- and calorimetric measurements
After the ball milling procedure, the milling vial was connected to a MS to measure the atmosphere inside the vial. Results of the MS are presented in semi-log scale in Fig. 1. The signals observed from the pure Ca-RHC are displayed by solid lines and those from Ca-RHC + 0.1NbF5 are presented by dashed lines, in all panels. In contrast to the as-milled pure Ca-RHC sample, the doped sample reveals an atmosphere consisting of hydrofluoric acid (HF), diborane (B2H6) and hydrogen (H2). In both samples, neither humidity nor oxygen is observed. Coupled manometric–calorimetric measurements performed on the undoped and doped samples are displayed in Fig. 2. The manometric curve of pure Ca-RHC shows hydrogen release starting from ∼350 °C, with an increase in desorption rate at about 360 °C, which is correlated to a H2 release of more than 6 wt% in about 20 °C range. Along with this process, the calorimetric curve shows an endothermic peak with an onset temperature of 357 °C. The desorption enthalpy for pure Ca-RHC was calculated by taking into account the amount of hydrogen released under the peak is 42 kJ mol−1 H2. The small endothermic peak at 160 °C (onset T = 155 °C) is not associated to any mass decrease and can be attributed to the phase transition from α and γ-Ca(BH4)2 to β-Ca(BH4)2, as reported in literature.36 Regarding the as-milled NbF5 doped sample (see Fig. 2b), this endothermic peak at 160 °C is absent, indicating that the α and γ-Ca(BH4)2 polymorphs have disappeared or at most is present in a negligible amounts in the as-milled Ca-RHC + 0.1NbF5 sample. The hydrogen release starts at approximately 250 °C, as it is evident in the manometric curve and in the calorimetric profile (the onset temperature of the endothermic peak is 301 °C). This means that there is a significant decrease of 100 °C in the desorption onset temperature. The desorption enthalpy, of the doped system was determined to be 37 kJ mol−1 H2. The apparent activation energy Ea of the overall desorption process for the undoped and the doped systems were evaluated by the Kissinger method37 after performing the calorimetric measurements at four different heating rates (1, 3, 7 and 10 °C min−1, respectively; see Fig. 3). For the undoped systems a value of 217 kJ mol−1 H2 was obtained, and for the NbF5 doped system a value of 198 kJ mol−1 H2 was determined.
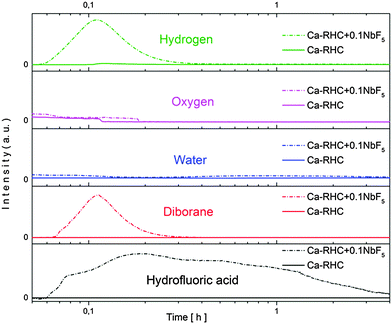 |
| | Fig. 1 Mass-spectroscopy of the gases released during the milling procedure of pure Ca-RHC and Ca-RHC + 0.1NbF5. | |
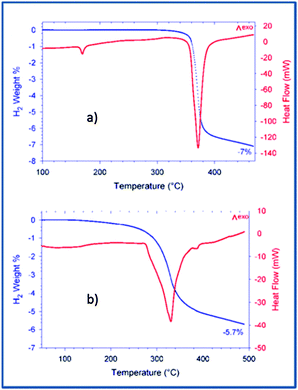 |
| | Fig. 2 Coupled DSC-manometric curves of Ca-RHC and Ca-RHC + 0.1NbF5 with 3 K min−1 under vacuum condition. | |
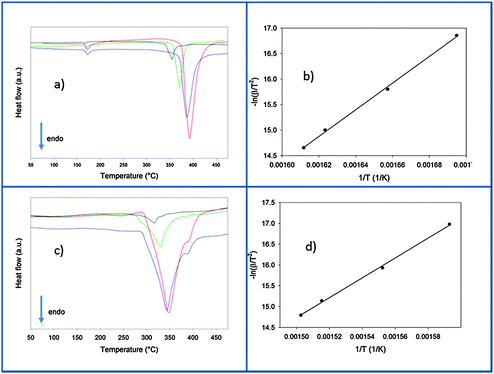 |
| | Fig. 3 Calorimetric profiles and related Kissinger plot of the undoped (a and b) and the doped (c and d) samples heated from room temperature up to 500 °C at 1 (black line), 3 (green line), 7 (blue line) and 10 (red line) °C min−1 in vacuum. | |
3.2 Results of in situ SR-PXD measurements
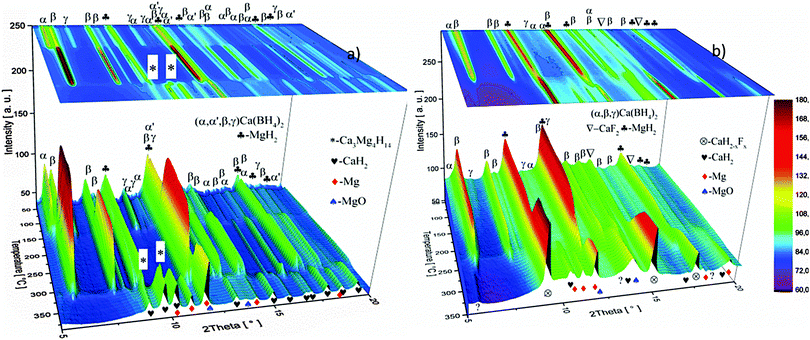
The dehydrogenation reaction paths of the as-milled pure Ca-RHC and Ca-RHC + 0.1NbF5 were investigated using in situ SR-PXD. In Fig. 4 the in situ SR-PXRD pattern of Ca-RHC and Ca-RHC + 0.1NbF5 are shown. The diffractograms peaks corresponding to the starting material, intermediate state and final desorption products are denoted by symbols.
 |
| | Fig. 4
In situ SR-PXD measurement of Ca-RHC (a) and Ca-RHC + 0.1NbF5 (b) under static vacuum. The samples were heated up from RT up to 400 °C with a heating rate of 3 K min−1. | |
The 1D diffraction patterns are plotted as a function of temperature and diffraction angle (T, 2θ) 3D and 2D plots in 4a. In the case of pure Ca-RHC, the starting material is composed of α, β and γ polymorphs of Ca(BH4)2 and MgH2. With increasing temperature all phases remain stable up to 140 °C. Thereafter the phase transformation from α and γ to β-Ca(BH4)2 occurs, while the intensities of MgH2 remain unchanged. Subsequently an intermediate Ca4Mg3H14 phase temporarily appears. The Ca4Mg3H14 phase is formed by the chemical reaction of CaH2 and MgH2 phases,38 with CaH2 being a decomposition product of Ca(BH4)2. Then, Ca4Mg3H14 decomposes at about 365 °C, leading to the formation of CaH2 and Mg phases. After the decomposition of Ca(BH4)2, no boron containing phases are detected in the XRD pattern, neither among the intermediate phases nor in the final products. This indicates the amorphous and/or nano-crystalline nature of boron compound(s) among the decomposition products of the Ca-RHC sample. Indeed the broad hump in the 2θ region between 7° and 17° hints at an amorphous phase present in the desorbed Ca-RHC sample. Possible amorphous/nanocrystalline products, CaB6, amorphous boron or amorphous sub-stoichiometric CaB12H12−x compounds may be formed, as well, as it was observed recently for Li2B12H12 in the LiBH4 system39Fig. 4b shows the in situ SR-PXD of the dehydrogenation paths of Ca-RHC + 0.1NbF5. The starting material consists of MgH2, CaF2, β-Ca(BH4)2 and a low amount of the α and γ-polymorphs of Ca(BH4)2. In this case, the decomposition of β-Ca(BH4)2 starts around 250 °C, in accordance with the coupled manometric–calorimetric measurements (Fig. 2b). Furthermore, in contrast to pure Ca-RHC, neither the intermediate phase (Ca4Mg3H14) nor CaH2 peaks are observed after dehydrogenation of Ca(BH4)2 and MgH2. Instead, after the decomposition of Ca(BH4)2, the peak intensities of a CaF2-like structure arises which can be assigned to the formation of a solid solution phase CaF2−xHx as has been is reported in the literature.40–42 Magnesium, MgO and a minor unknown phase are observed as final products of the desorbed Ca-RHC + 0.1NbF5. The formation of MgO could not be avoided in both measurements. This could be due to either impurities present in the starting materials, which has been an issue for other studies on Ca(BH4)223 and/or a small undetected leakage in the sample holder system. A broad hump (in the region ∼7° to 17°) is also observed in the XRD-pattern of dehydrogenated Ca-RHC + 0.1NbF5 is also observed which is more pronounced than that of pure dehydrogenated Ca-RHC. In a similar way as for the pure Ca-RHC, this hump might be due the presence of a portion of the sample in amorphous and/or nano-crystalline state. This suggests the presence of a higher amount of nanocrystalline/amorphous material in the dehydrogenated doped sample in comparison to desorbed pure Ca-RHC. Neither NbF5 nor any other known Nb-containing phases are observed via SR-PXD in the starting material or desorbed sample. Also, the state of boron is unknown. Thus, to reveal the state of Nb and other amorphous/nanocrystallite Ca–B–H containing phases in the composite system, solid state NMR measurements were performed.
3.3 Results of NMR measurements
Solid-state 11B-MAS NMR was applied to investigate the possible presence of amorphous/nanocrystalline boron containing phases on both the ball-milled samples and after the first dehydrogenation process. The results of the measurements are shown in the Fig. 5. In the top and middle panels the spectra of desorbed Ca-RHC + 0.1NbF5/Ca-RHC and as-milled Ca-RHC + 0.1NbF5/Ca-RHC are presented, respectively. In the inset figure of the middle panel, a magnification of a weak signal of the 11B NMR-spectrum of the as-milled Ca-RHC + 0.1NbF5 is shown, which is not present in the NMR-pattern of the as-milled pure Ca-RHC. The NMR-spectra of reference compounds are presented in the bottom panel. Side bands are marked by asterisks and peaks are pronounced by a vertical line. No significant differences are visible between the 11B NMR spectra of the as-milled pure Ca-RHC and Ca-RHC + 0.1NbF5. At −30 ppm and at −32 ppm the signals of, respectively, α-Ca(BH4)2 and β-Ca(BH4)2 polymorphs36 are observed.28 In addition, a closer look at the spectrum of Ca-RHC + 0.1NbF5 shows a small signal at ∼+16 ppm which is not present in the spectrum of pure Ca-RHC and it can be attributed to the signal of CaB6.20 No trace of any Ca(BF4)2 or Ca(BF4xHx)2 species can be observed which is in agreement with the results obtained by Grove et al.43
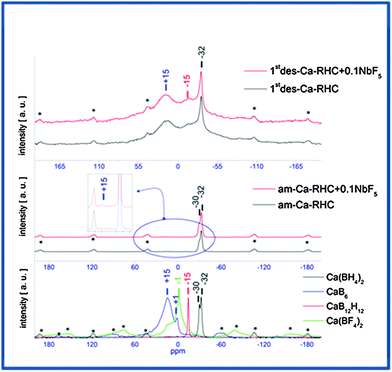 |
| | Fig. 5 NMR-pattern of once desorbed Ca-RHC/Ca-RHC + 0.1NbF5 (top) and as-milled Ca-RHC/Ca-RHC + 0.1NbF5 (middle) samples with the pattern of references (bottom). | |
The spectra of the dehydrogenated samples (pure and doped Ca-RHC) show peaks at matching positions, suggesting the same boron containing decomposition products. The signals at +16 ppm, −15.5 ppm and −32 ppm, respectively, correspond to CaB6, CaB12H12 and to residual β-Ca(BH4)2 phases.20 However, the chemical state of the niobium-containing phases in the hydride matrix could not be detected using the 11B NMR method. This might be due to the presence of nanoscopic Nb-containing structures in the samples. Because they produce very broad NMR-signals, their distinguishable detection is not straightforward. Therefore, these issues are addressed in the following Section by the XAS technique which is a powerful method for probing the chemical state and the local environment of a nanoparticulate system.
3.4 Results of XAS measurements and Rietveld refinement
To determine the oxidation state of niobium in the Ca-RHC + 0.1NbF5 after both ball milling and dehydrogenation, XANES measurements on these samples were carried out. Several Nb-based compounds (metallic Nb, NbF5 and NbB2) were measured as well, for comparison with the near edge structures of niobium in the samples. Derivatives of the XANES spectra were built in order to emphasis the similarities or differences of the near edge structures. The results of this aforementioned procedure are displayed in Fig. 6.
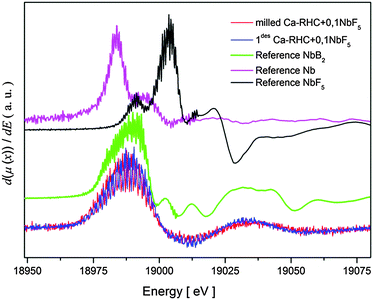 |
| | Fig. 6 Derivative of XANES structures of the samples and the main references. | |
Both Ca-RHC + 0.1NbF5 samples show similar XANES structures indicating that all Nb atoms have the same chemical state after the milling procedure as well as after the first dehydrogenation step. A comparison between the XANES of the Ca-RHC + 0.1NbF5 samples and the Nb-based reference compounds shows a good agreement between the XANES of the NbB2-reference curve and those of the Ca-RHC + 0.1NbF5 samples. Therefore, the oxidation state of niobium after milling in the Ca-RHC matrix can be estimated to be +2 which is stable upon hydrogen cycling. The local environment of the niobium atoms was revealed by using the Extended X-ray Absorption Fine Structure (EXAFS) region of the measured XAS-spectra. The extracted EXAFS region of the samples and references were Fourier transformed to display the radial distribution of the atoms around the resonant Nb atoms (see Fig. 7). By comparing the radial distribution functions (RDFs) of the samples shown in Fig. 7 with that of the NbF5 reference, the absence of fluorine atoms in the first shell of the samples is obvious. Higher order shells also show significant differences in RDFs to the NbF5 reference, which indicates the removal of fluorine atoms from the environment of Nb atoms. A further comparison of the RDFs of the samples with that of the NbB2 reference exhibits high similarity up to the second shell. The amplitude of the milled sample shows the lowest RDF magnitude and grows after the dehydrogenation process. This is an indication of a higher degree of ordering/growing of Nb containing structures with hydrogen cycling. Due to the absence of higher order amplitudes in the RDFs of the samples and the lack of any diffraction peaks of NbB2 in the in situ SR-PXD measurements or a well-defined signal in the 11B NMR spectra of Ca-RHC + 0.1NbF5 samples (see Fig. 4 and 5), the formation of nanocrystalline NbB2 can be assumed.
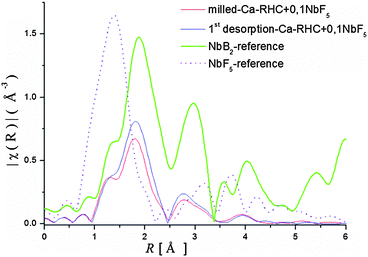 |
| | Fig. 7 Radial distribution functions (FT-of EXAFS-spectra) of the samples and references. | |
This indicates the presence of well dispersed and unsegregated NbB2 in the Ca-RHC matrix. To verify the presence of the NbB2 species in Ca-RHC + 0.1NbF5 samples the EXAFS data of the dehydrogenated Ca-RHC + 0.1NbF5 sample was fitted by assuming a hexagonal NbB2 crystal structure model with the space group P6/mmm, and results are displayed in Fig. 8. The fit parameters are summarized in Table 2. The fitting procedures were carried out simultaneously from 1 to 3 k-weighted range in R-space. These results are in excellent accordance with the results observed by other authors,44–47 who also reported the formation of transmission metal (TM)-diborides during ball milling of complex borohydrides with TM-fluorides, chlorides and isopropoxides in other RHC systems. Taking into account the additional information gained by NMR and XAS further insight and a more reliable attribution of Bragg reflections can now be obtained by refinement of the diffraction profiles using the Rietveld method.48 MAUD software49 was used for the Rietveld refinement of the SR-PXD patterns. The SR-PXD patterns of as-milled Ca-RHC and Ca-RHC + 0.1NbF5 at room temperature (RT) is displayed in Fig. 9(a) and (c), respectively. The ratio between the polymorphs of calcium borohydride in the doped systems is altered in comparison to the pure system. The relative change in mass fraction of the α, β and γ-Ca(BH4)2 polymorph is 0.10, 0.86, and 0.04, respectively, for the NbF5-doped system in comparison to the respective values 0.18, 0.72, 0.10 of the pure Ca-RHC system. The microstructure of the compounds in Ca-RHC + 0.1NbF5 is also strongly refined in comparison to undoped Ca-RHC. It was found that the overall crystallite sizes in doped Ca-RHC were roughly 50% smaller and the microstrain values were approximately doubled compared to the undoped sample, as a consequence of the combined use of additive and ball milling action. In the high temperature (HT) state, metallic magnesium, amorphous calcium hexaboride and crystalline calcium hydride phases were produced in Ca-RHC. However, in the corresponding doped system in addition to CaB6 a calcium-fluoride-hydride solid solution was formed instead of the equivalent metal hydride phase (Fig. 9(b) and (d)).
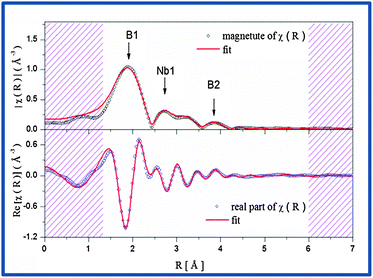 |
| | Fig. 8 The magnitude (top) and the real part (bottom) of the EXAFS-spectrum of the desorbed Ca-RHC + 0.1NbF5 sample in R-space with their corresponding fits. | |
Table 2 Fitting parameters for the desorbed-Ca-RHC + 0.1NbF5 sample in R-space (1.3–6) Å and (2.0–8.0) Å−1 in the k-space with a S02 = 0.78, ΔE = 7.97 eV and a R-factor = 0.018
| Modell |
Shell |
N
|
ΔR [Å] |
σ [Å] |
| NbB2 hexagonal-P6/mmm |
Nb–B1 |
12 |
0.0348 |
0.0149 |
| Nb–Nb1 |
8 |
0.0246 |
0.0141 |
| Nb–B1–B1 |
24 |
0.0696 |
0.1234 |
| Nb–B2 |
12 |
0.1267 |
0.0298 |
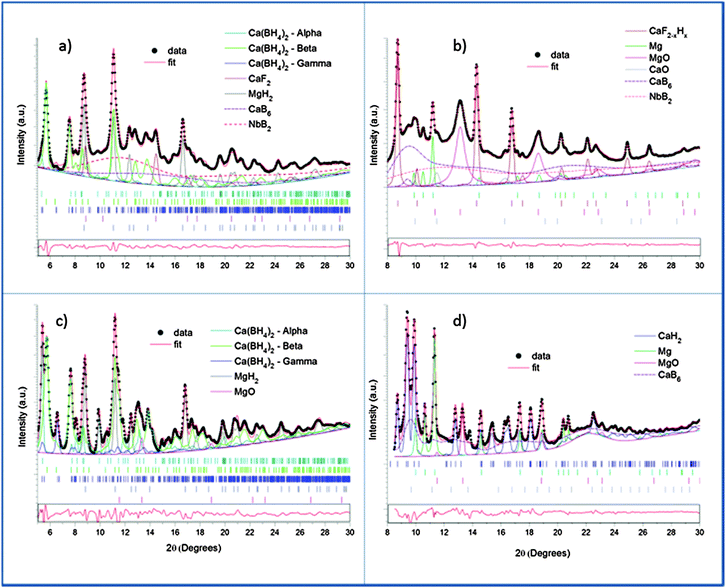 |
| | Fig. 9 SR-PXD pattern (black dots) collected at room temperature and high temperature respectively for doped – (a) and (b), and undoped – (c) and (d) – Ca-RHC, and the corresponding simulated profiles. The contribution of each phase with the corresponding Bragg reflections (marked ticks) and the residuals function (red line in the box) are also reported. Only structural models from ICSD database were used. | |
Diffractograms, taken at RT and dehydrogenated material at HT, of doped and undoped Ca-RHC were refined and their quantitative results were compared. The comparison between the refinements of the diffraction patterns collected at RT (Fig. 9(a) and (c)) revealed different composition and crystallinity of the Nb-doped systems. It is worth mentioning that the diffraction patterns were fitted with a high degree of confidence (Rw < 3%) only if the nanocrystalline/amorphous phases were included in the refinement model. Examples of similar approaches can be found in the literature.50 As a result of the refinement, CaF2−xHx is supposed to contain less of hydride anions than the maximum value (x = 1.07 rather than xmax = 1.24).40
The results suggest that CaF2 can play an active role in the dehydrogenation reaction by exchange of the fluoride and hydride ions in the hydrogen concentration range of 0 < x ≤ 1.24. Sizes of nanocrystalline NbB2, calculated by the Rietveld refinement, were determined to be in the range of 7–10 nm. However, the presence of at least two different nanocrystalline components (CaB6, CaB12H12) in a system with such rich phase composition raised problems in the accuracy of the numerical result due to correlations between the two phases. Hence, the size distribution of NbB2 phase was further evaluated by ASAXS measurements which are presented in the following subsection.
3.5 Results of ASAXS measurements
Nb-ASAXS experiments close to the K-absorption edge of niobium (18.99 keV), were carried out to determine the size distribution of the Nb-containing phase in the surrounding hydride matrix. The ASAXS measurements were performed for the as-milled and dehydrogenated Ca-RHC + 0.1NbF5 samples. The results of the dehydrogenated doped sample are presented in Fig. 10. The SAXS scattering curve shows two scattering features at a low q value centred at about 0.25 nm−1 and a broad hump extended over the q-interval of 1.5–7 nm−1. The inset plots show in more detail the strong scattering region (0.1 nm−1 < q < 0.6 nm−1), and the less pronounced scattering region at the higher q values. These resonant scattering regions can be attributed to two distinct niobium nano particle distributions. Hence, two sets (j = 1, 2) of polydisperse spherical Nb containing particles were simultaneously fitted to the ASAXS data measured at four different X-ray energies (Ei; i = 1, 2, 3, 4; see Table 1) by the following theoretical intensities:51,52| |  | (1) |
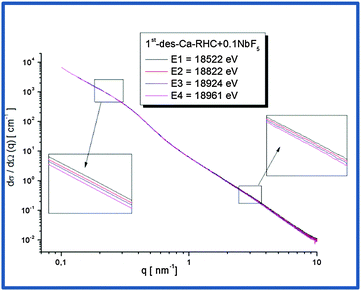 |
| | Fig. 10 ASAXS curves of Ca-RHC + 0.1NbF5 sample after the first desorption. | |
The energy-dependent contrast of the jth scattering contribution is represented by Δρj2. To account for the polydispersity of the Nb-containing particles in the hydride matrix, a normalized log-normal size distribution of the nano-particles was included:
| | 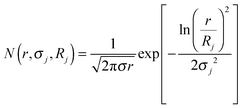 | (2) |
With
σj being the standard deviation of the distribution and
Rj the mean radius parameter of the
jth constituent and
r denote the radius of the spherical particles.
V(
r) and
F(
r,
![[thin space (1/6-em)]](https://www.rsc.org/images/entities/char_2009.gif) q
q) represent, respectively, the volume and the form factor of spherical particles. The latter expression is given by:
| |  | (3) |
where,
q is the scattering vector described in Section 2.7. A non-constant background
B(
q,
![[thin space (1/6-em)]](https://www.rsc.org/images/entities/char_2009.gif) Ei
Ei) =
q−α(Ei) +
C(
Ei) was included to account for the scattering of large particles (out of experimental accessible
q-range) and the energy dependent fluorescence and resonant-Raman scattering. For the fitting procedure, the program SASfit
53 was used. The calculated volume-weighted size distribution from the fit for the dehydrogenated Ca-RHC + 0.1NbF
5 sample is presented in
Fig. 11.
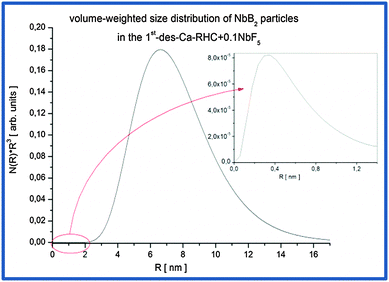 |
| | Fig. 11 Volume-weighted size distribution of NbB2 particles in the Ca-RHC + 0.1NbF5 sample after the first desorption. | |
The mean particle sizes, related to the broad hump located at high q values, are around ∼0.8 nm on average and maximum sizes are about 1.5 nm (inset Fig. 11). However, their volume fraction is negligible small in comparison to the Nb-containing particles due to the pronounced hump at lower q values. Therefore, the most frequent NbB2 particle sizes present in dehydrogenated Ca-RHC + 0.1NbF5 sample are about 14 nm. This result is in good agreement with observation carried out on additive size distributions in complex hydrides and hydride composite systems.44,46,54 SEM and HR-TEM investigations were undertaken to further investigate the local nanostructure of the Ca-RHC and Ca-RHC + 0.1NbF5 samples.
3.6 Results of SEM and TEM measurements
SEM investigations on the as-prepared Ca-RHC and Ca-RHC + 0.1NbF5 samples showed the presence of agglomerates with sharp borders and sizes between 5 and 50 μm. On these agglomerates some small grains were visible, with rounded shape and sizes smaller than 1 μm. The same morphology is preserved in the desorbed samples (not shown here). By EDS analysis, a map of the distribution of the different elements in the doped as-milled sample and the same sample after desorption was obtained. For both samples the Ca-containing phases appeared to be distributed homogeneously, as is evident in Fig. S1 (ESI†), which shows the elemental mapping of the doped sample after the first desorption. The Mg-containing phases exist in regions that have aggregated in larger agglomerates lying on the Ca-phases. The F and Nb containing phases are highly distributed in the hydride matrix (see the overlapping maps for Nb and F). A further insight into the nanoscopic scale was undertaken by using TEM to reveal the local structure of the hydride matrix and the Nb-based additive in the hydride matrix. TEM investigations showed that after desorption, both, Ca-RHC and Ca-RHC + 0.1NbF5, samples consisted of large aggregates (typically >10 μm) that had a composite morphology of nanoscopic domains (∼5–10 nm) as shown in Fig. S2 (ESI†). The nano-composite morphology was observed in all regions of, both, the Ca-RHC and Ca-RHC + 0.1NbF5 samples, but interestingly some regions appeared less crystalline than others (see Fig. S2B and C, ESI†). The highly crystalline regions in Ca-RHC could be indexed by high resolution TEM (HR-TEM) to the reaction products as seen by SR-PXD, NMR and EXAFS (Fig. 4, 5, 8 and 9) and are displayed in Fig. 12. Points (1) and (2) indicate the amorphous region in the Ca-RHC, surrounded by nanocrystalline lattice planes. The amorphous region can be assumed to contain the recently mentioned CaB12H12 and/or residual β-Ca(BH4)2 reaction products (Section 3.3). Although, the presence of β-Ca(BH4)2 could be tentatively assigned to some crystalline regions of the desorbed Ca-RHC sample, however, the phase did not appear to be stable under the electron beam. The decomposition of metal hydride phase under the electron beam was also observed by Deprez et al. All single phase identifications are made difficult due to a significant overlap of d-spacing values between phases, within resolution. Some of the reliable measured lattice planes can be assigned to the following phases: (A) 2.49 Å (011) hkl reflection of Mg; (B) and (C) 2.8 Å (011) hkl reflection of CaB6 (D) 1.98 Å (011) hkl reflection of CaB6 (E) and (F) 2.49 Å, Mg. The directional contact of the CaB6 phases on the Mg nanocrystallites found here indicates that Mg might provide nucleation sites for the CaB6 phase, therefore inducing further growth of this phase as the reaction proceeds. This behavior was also observed in other studies,27 and is an indication that Mg indeed provides a catalytic driving force for the formation of nanocrystalline CaB6. TEM-images of the dehydrogenated Ca-RHC + 0.1NbF5 are presented in Fig. 13. Due to the low concentration of the additive in the Ca-RHC + 0.1NbF5 sample it was not possible to find many Nb-rich regions. Fig. 13B presents a dark-field image of a crystalline Nb-rich region where the lattice planes could be reliably measured. By fast-Fourier transformation (FFT) of the aforementioned region, the crystal structure could be assigned to NbB2. The environment surrounding NbB2 was investigated to determine which phases were in close contact with this additive. In numerous cases, the NbB2 was only surrounded by the non-crystalline, amorphous material presumably of Ca–B–H ternary composition (see Fig. 13D). Hence, HR-TEM micrograph analysis failed to reveal the crystalline interfaces of the NbB2 with the surrounding matrix in the present work. The most frequent NbB2 particle sizes were determined to be ∼10 nm. These results are in fair agreement with the results obtained by XAS and ASAXS methods.
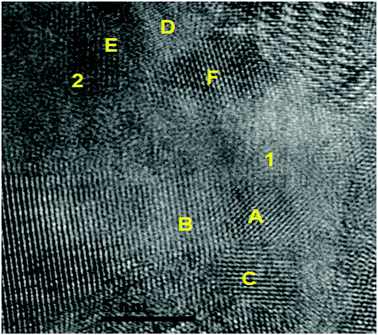 |
| | Fig. 12 TEM micrograph indicating localised amorphous regions (1) and (2). Attributed phases for the lattice spacing present include: (A) (011) Mg; (B) and (C) (011) CaB6; (D) 1.98 Å (011) hkl reflection CaB6 (E) and (F) 2.49 Å, Mg. | |
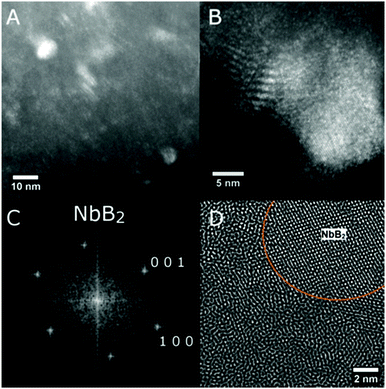 |
| | Fig. 13 TEM micrographs of Ca-RHC + 0.1NbF5 after the first desorption displaying (A) a dark-field where bright regions indicate Nb-rich areas, (B) a dark-field of a large Nb-rich region where lattice planes are evident, (C) the FFT of a Nb-rich region identifying single crystal NbB2, and (D) a filtered image demonstrating the amorphous structure surrounding NbB2. | |
3.7 Results of BET surface area measurements
The specific surface areas (SSA) of as-milled Ca-RHC, Ca-RHC + 0.1NbF5 and of the corresponding dehydrogenated samples were determined by means of BET measurements and the results are assembled in Table 3.
Table 3 Results of BET surface area measurements for pure Ca-RHC and Ca-RHC + 0.1NbF5 sample
| Sample |
State |
BET surface area [m2 g−1] |
D [μm] |
| Ca-RHC |
As milled |
3.33 ± 0.04 |
1.40 ± 0.08 |
| Ca-RHC |
1st des. |
15.8 ± 0.1 |
0.20 ± 0.01 |
| Ca-RHC + 0.1NbF5 |
As milled |
4.62 ± 0.03 |
0.72 ± 0.04 |
| Ca-RHC + 0.1NbF5 |
1st des. |
27.6 ± 0.2 |
0.090 ± 0.005 |
The ratio between the SSA of as-milled Ca-RHC + 0.1NbF5 and as-milled pure Ca-RHC amounts to approximately 1.39. This indicates an effect of the additive in terms of refining the microstructure and enlarging particle surface area of the hydride matrix during the milling procedure. As the absolute surface area of a heterogeneous surface is typically underestimated by the BET model as shown by Cortés and Araya,55 the relative change of the SSA is the centre of interest here.
After dehydrogenation the SSA of the doped system is almost doubled (1.74) in comparison to pure system. Comparing the SSA between desorbed and as-milled states of pure Ca-RHC gives a SSA growth factor of 4.7. The corresponding value for the doped system is about 6. This shows a creation of new SSA during the dehydrogenation process in both systems. However, in the case of the doped system 21% larger relative growth factor of SSA is determined in comparison to the pure Ca-RHC system. This reveals that in addition to the creation of new SSA due to dehydrogenation process there is clearly an effect of NbB2 additive on the creation of additional SSA during the dehydrogenation process of the surrounding hydride matrix. The surface area “seen” by molecular hydrogen could be even larger as resolution is limited by the size of the nitrogen molecule. Assuming a model of spherical particles, in terms of a first approximation, the SSA of the samples can be related to an average particle size using the following equation:56,57
where
D is the particle diameter,
S is the BET surface area and
ρ is the average material density of the composite. The results for average particle sizes are collected in the last column of
Table 3. The average particle sizes of pure as-milled and desorbed Ca-RHC are roughly twice bigger than the average particle sizes of corresponding samples in the doped system.
4 Discussion
The significant impact of the NbF5 additive on decreasing the desorption temperature of the Ca-RHC was evident from the DSC and manometric measurements (Fig. 2a and b). The additive reacts during the milling with the Ca-RHC producing hydrofluoric acid, diborane and hydrogen, which was observed via mass spectrometry (see Fig. 1). From the DSC curves, the Ea for the dehydrogenation process for the undoped and doped Ca-RHC system was determined (Fig. 3). The Ea values for Ca-RHC: (217 kJ mol−1 H2) and Ca-RHC + 0.1NbF5 (198 kJ mol−1 H2) indicate that the additive reduce activation barrier of the Ca-RHC system during the dehydrogenation process noticeably. Another significant influence of NbF5 on the Ca-RHC system is its effect on the dehydrogenation reaction path of the system. In situ SR-PXD analysis (Fig. 4) clearly shows different desorption reaction paths and end products for the pure Ca-RHC and Ca-RHC + 0.1NbF5. According to the in situ SR-PXD measurements and all the previous analysis of the results, the following dehydrogenation reaction path for the pure Ca-RHC can be proposed:| |  | (5) |
| |  | (5a) |
| |  | (5b) |
| |  | (5c) |
The crystalline phase CaB2Hx reported by Riktor et al.58 is not observed under the applied conditions here. In pure Ca-RHC the intermediate Ca4Mg3H14 phase is observed (Fig. 4), although the formation of Ca4Mg3H14 is not a necessary reaction step as it was pointed out by Bonatto Minella et al.27 By mixing Ca(BH4)2 and MgH2, the intermediate phase (Ca4Mg3H14) was not observed by these authors, upon dehydrogenation, in contrast to the high energy ball milled Ca(BH4)2 + MgH2 sample. Therefore, they concluded that the production of Ca4Mg3H14 is correlated with the microstructure of the as-prepared material. In the present work, both samples (Ca-RHC and Ca-RHC + 0.1NbF5) were high energy ball milled under the same conditions (as described in Section 2.1). Unlike to pure Ca-RHC, no Bragg peaks of Ca4Mg3H14 phase are observed during the dehydrogenation reaction of Ca-RHC + 0.1NbF5 (in the in situ SR-PXD measurements, see Fig. 4). The formation of the intermediate phase via: 4CaH2 + 3MgH2 → Ca4Mg3H14 was already predicted by first principle calculations to be more likely due to its negative Helmholtz free energy (ΔF = −7.9 kJ at 350 °C).16 Since the solid solution CaF2−xHx is formed, during the decomposition reaction of Ca(BH4)2 in the Ca-RHC + 0.1NbF5 sample, the Helmholtz free energy of a reaction involving 4CaH2−xFx + 3MgH2 might be more favourable than 4CaH2 + 3MgH2. This would explain the independent dehydrogenation reaction of MgH2 in the Ca-RHC + 0.1NbF5 system and the reaction of 4CaH2 + 3MgH2 in the pure Ca-RHC. In the pure Ca-RHC, CaH2 reacts with MgH2 to form Ca4Mg3H14. Subsequently, upon the dehydrogenation of the ternary hydride a simultaneous formation of metallic Mg and CaH2 can be observed. However, in the presence of CaF2−xHx, the formation of Ca4Mg3H14 does not take place. Hence, the diffraction peaks of Mg appear after those of CaF2−xHx upon the slightly delayed decomposition of MgH2. Regarding the XAFS-results, NbF5 reacts with Ca(BH4)2 during high energy ball milling to form CaF2 and NbB2 (Fig. 6–8). No trace of MgF2 is observed in the milled Ca-RHC + 0.1NbF5 sample via SR-PXD which is in agreement with the results obtained by59 Assuming a complete reaction between 0.1NbF5 and Ca(BH4)2 during the milling procedure, the following initial educts, reaction pathways and reaction products for Ca-RHC + 0.1NbF5 can be proposed:| |  | (6) |
| |  | (6a) |
The dehydrogenation of the sample doped with 0.1NbF5 starts, in accordance with the manometric measurements, at much lower temperatures in comparison to the pure Ca-RHC sample. After the desorption process of Ca-RHC and Ca-RHC + 0.1NbF5, no SR-XPD signals of Ca(BH4)2 can be detected, suggesting the complete decomposition of this phase (Fig. 4 and 9). By means of NMR (Fig. 5), nevertheless, a trace of residual β-Ca(BH4)2 polymorph is detectable in both samples (see Fig. 5). It was concluded that the remnant β-Ca(BH4)2 is present for the same reasons in both samples. During the desorption process the residual β-Ca(BH4)2 might be covered with the decomposition products of the composite system. This effect could hinder the decomposition of this residual borohydride phase. The main difference concerning reaction (4a) and (5a) is the formation of the CaF2−xHx solid solution between CaF2 and CaH2 in the doped sample, as was also observed by Pistidda et al. and Suarez-Alcantara et al.60,61 The value of x is determined to be 1.07, using the Rietveld method. These results also explains the change of desorption enthalpy values 42 ± 2 kJ mol−1 H2 and 37 ± 1 kJ mol−1 H2 for the Ca-RHC system and Ca-RHC + 0.1NbF5, respectively (DSC-measurements-Section 3.1). Additionally, no phase transformation of α and γ-Ca(BH4)2 to the β-Ca(BH4)2 polymorph was found in the DSC pattern of the Ca-RHC + 0.1NbF5 sample. Rietveld refinement of the room temperature SR-XPD pattern of pure and doped Ca-RHC revealed only a relative reduction of the mass fraction of the α, β and γ-Ca(BH4)2 polymorphs from 18%, 72%, 10% in the as-milled pure Ca-RHC changed to 10%, 86%, 4% in the NbF5 doped Ca-RHC system, respectively (see Fig. 9). This contradiction between DSC and SR-XPD can be inferred to the detection limit of DSC-apparatus itself. The absence of the α and γ-Ca(BH4)2 polymorph in the XRD pattern after high energy ball milling with TMF-additives was reported by other authors,20,41 as well. However, they attributed the absence of the α-Ca(BH4)2 polymorph to the high energy involved during the milling process able to drive phase transition. As mentioned previously, in this study Ca-RHC and Ca-RHC + 0.1NbF5 samples were ball milled under the same conditions, respectively. Hence, it is concluded that the NbF5 additive might initiate the α and γ to β-Ca(BH4)2 phase transition during the milling process of the Ca-RHC + 0.1NbF5 sample. According to62 the maximum temperature achieved during ball-milling is dependent on the materials being milled. In the SPEX 8000 under the same milling conditions, an Al–Mg mixture would reach a maximum temperature of 120 °C,63 whereas a mixture of Fe with an addition of 1.2 wt% C could reach 300 °C.64 In the present study, the milling procedure causes a chemical reaction between NbF5 and Ca(BH4)2 in the Ca-RHC + 0.1NbF5 sample as was shown by EXAFS analyses (Fig. 8). The heat released by the reaction might local reach temperatures needed for the phase transition (from α and γ to β-Ca(BH4)2) of about 160 °C which could explain the lowered amount of the α and γ-Ca(BH4)2 polymorph in the as-milled Ca-RHC + 0.1NbF5 sample. However, a phase transformation based only on structural deformation by the additional NbB2 during ball milling of the Ca-RHC + 0.1NbF5 sample cannot be excluded entirely (e.g. the formation β-MgH2 phase upon milling procedure).65 Since NbB2 is known as a hard and inert material,66–68 it can act during the milling procedure as a grain refiner in the hydride matrix.69–71 According to, both, theoretical72 and experimental73 studies the phase transition in nano crystalline materials is mainly dependent on the grain size. This feature is about twice finer distributed in Ca-RHC + 0.1NbF5 samples in comparison to pure Ca-RHC samples, as it was shown via Rietveld-refinement in Section 3.4. In contrast to the as-milled pure Ca-RHC, 11B NMR-measurements of as-milled Ca-RHC + 0.1NbF5 showed a trace of nanocrystalline CaB6 (since no sharp Bragg-peaks of CaB6 in the SR-XPD of the as-milled Ca-RHC + 0.1NbF5 was detectable). Since, the d-value mismatch between crystallographic planes of Mg/CaB6 is less than 6%,27,74–76 this nanoparticulated CaB6 phase provides nucleation centres for new CaB6 and Mg phases during the dehydrogenation process. Moreover, XAS, ASAXS and TEM analyses revealed the presence of finely distributed NbB2 nanoparticles in the Ca-RHC + 0.1NbF5 samples (Fig. 8, 10 and 13, Fig. S1, ESI†). Based on the edge-to-edge matching model calculation of the d-value mismatch of the planes {1011} CaB6/{1011} NbB2 and {111} CaB6/{1010} NbB2 are, respectively, equal to 2.9% and 2.8%.27 Therefore, NbB2 provides in additional to existing nanoparticulated CaB6, two more possible crystallographic planes for heterogeneous nucleation and growth of the CaB6 phase in the Ca-RHC + 0.1NbF5 composite system. Hence, upon the desorption reaction of Ca-RHC + 0.1NbF5, a heterogeneous nucleation and growth of CaB6 on NbB2 nanoparticles is expected which consequently enhances the reaction kinetics of doped Ca-RHC in comparison to the undoped hydride composite system. As a consequence of the heterogeneous nucleation and growth the particle sizes in the doped sample should be reduced. Indeed, the BET results of the doped sample after the first dehydrogenation process shows 55% smaller average particle sizes in comparison to the first dehydrogenated pure Ca-RHC. However, the shape of a single particle can be more complex than the assumed spherical-model used for calculation of average particle sizes according to Section 3.7. In that sense, an increased SSA can additionally also be referred to a change of the particle shape and increase of surface area originating from the emergence of cracks and defects during dehydrogenation.77 Also the as-milled Ca-RHC + 0.1Nb5 sample shows approximately 40% larger SSA relative to the undoped as-milled sample. This point toward lower diffusion paths, higher reaction surfaces and smaller structure for fast hydrogen recombination processes. The crucial role of small structures, high reaction surface area and reaction contact area of the metal hydrides and hydride composite systems on their de/rehydrogenation behaviour was also pointed out in detail by Dornheim et al., Pistidda et al. and others1,8,78,79 An additional effect of the NbB2 particles might also be an increase in the material strain at the grain boundaries, as SEM and TEM results indicate well dispersed NbB2 nanoparticles in the matrix and around the interfaces (Fig. 12 and 13 and Fig. S1, ESI†). This hinders the crystallite growth and ensures the stability of the matrix structure. In fact, the strain of doped Ca-RHC was determined via the Rietveld method to be approximately twice larger than that found in the pure Ca-RHC sample. The distribution of transition metal compounds as an additives on the doped 2LiBH4 + MgH2 composite system was investigated by several researchers.47,54,76 Their results are in good agreement with those obtained here on the doped Ca(BH4)2 + MgH2 composite system which, interestingly, shows a similarity in behaviour/impact of transition metal compounds in/on the RHC systems.
5 Conclusions
In this work, the effect of NbF5 on the Ca(BH4)2 − MgH2 reactive hydride composite (Ca-RHC) was studied with a high degree of detail. Two sets of samples were prepared for comparative studies: Ca(BH4)2 + MgH2 and Ca(BH4)2 + MgH2 + 0.1NbF5. It was found that NbF5 additive noticeably decreases the desorption-temperature of Ca-RHC from 350 °C to 250 °C. Via DSC measurements it was shown that the dehydrogenation enthalpy value of the NbF5-doped Ca-RHC was lowered (37 kJ mol−1 H2) in comparison to pure Ca-RHC (42 kJ mol−1 H2). The activation energy for the dehydrogenation process of the doped systems was found to be smaller (198 kJ mol−1 H2) in comparison to the undoped system (217 kJ mol−1 H2). This suggests that the addition of NbF5 has a catalytic effect on the Ca-RHC system. Also, the dehydrogenation reaction paths and final products of Ca-RHC doped with 0.1NbF5 are altered compared to those of pure Ca-RHC. While the desorption reaction pathway of pure Ca-RHC proceeds with the formation of an intermediate ternary alkaline earth hydride phase Ca4Mg3H14, the dehydrogenation of the doped sample proceeds through the formation of the solid solution phase CaH2−xFx by releasing hydrogen. Therefore, the first major effect of NbF5 on Ca-RHC system is on the dehydrogenation reaction path. An analysis of the microstructural characteristics of the doped material showed that the overall particle and crystallite structures in the doped system were ∼50% finer in comparison to the pure Ca-RHC system. This suggests that the additive enhances the creation of considerably higher reactive surface area where the reaction partners have more effective contact points. The refined microstructure of the doped material also significantly decreases the diffusion paths and consequently the mass transport takes place in much shorter amount of time compared to the undoped sample. Hence, the second major impact of NbF5 on the Ca-RHC is on the macro and microstructural characteristics of the Ca-RHC. Furthermore, NMR-results revealed a trace of CaB6 nanoparticles in the as-milled Ca-RHC + 0.1NbF5, contrary to pure as-milled Ca-RHC. It is concluded that after desorption process nanoparticulated CaB6 provide nucleation centres for the formation of new CaB6. SEM results indicated a fine distribution of the additive in the hydride matrix. XAS measurements showed a change in the chemical state of Nb during the milling procedure from NbF5 to the more stable NbB2 phase. The mean NbB2 particle sizes were determined to be distributed around 14 nm, using Nb-ASAXS. HR-TEM confirmed XAS and ASAXS results. Furthermore, NbB2 nanoparticles also provide two additional crystallographic planes aside the aforementioned CaB6 nanoparticles for nucleation and growth of the new CaB6 phase upon the decomposition process of the Ca-RHC + 0.1NbF5 composite system. Therefore, it is concluded that the third effect of the additive is to provide numerous heterogeneous nucleation centres for CaB6 in the doped hydride composite matrix, so that formation of new CaB6 takes place faster in comparison to pure Ca-RHC. The insights gained in this study will lead to better understanding of complex activities of transition metal compound (TMC) additives on the hydrogen sorption properties of RHC systems. Hence, it will help to select appropriate TMC additives to further optimise material design so that RHCs with improved kinetic properties and larger hydrogen storage capacities can be obtained for possible mobile applications in the near future.
Acknowledgements
The authors acknowledge the Australian Microscopy & Microanalysis Research Facility at the Centre for Microscopy, Characterization & Analysis, the University of Western Australia and the financial support of the Australian Research Council for ARC Linkage Grant LP120100435. Portions of this research were carried out at the light source DORIS III at DESY, a member of the Helmholtz Association (HGF). The authors also thank CONICET (Consejo Nacional de Invetigaciones Científicas y Tecnicas), and DAAD (German Academic Exchange Service) e Ministerio de Educación de la Nación Argentina (Sandwich Grant Program) (Grant Number – A/09/75212) and BMBF (Grant No. 03BV108C) for financial support to carry out this work.
References
- M. Dornheim, S. Doppiu, G. Barkhordarian, U. Boesenberg, T. Klassen, O. Gutfleisch and R. Bormann, Scr. Mater., 2007, 56, 841–846 CrossRef CAS PubMed.
- L. H. Rude, T. K. Nielsen, D. B. Ravnsbæk, U. Bösenberg, M. B. Ley, B. Richter, L. M. Arnbjerg, M. Dornheim, Y. Filinchuk, F. Besenbacher and T. R. Jensen, Phys. Status Solidi A, 2011, 208, 1754–1773 CrossRef CAS PubMed.
- J. J. Reilly and G. D. Sandrock, Sci. Am., 1980, 242(2), 118–129 CrossRef CAS PubMed.
- B. Bogdanović and M. Schwickardi, J. Alloys Compd., 1997, 253–254, 1–9 CrossRef.
- M. Sale, C. Pistidda, A. Taras, E. Napolitano, C. Milanese, F. Karimi, M. Dornheim, S. Garroni, S. Enzo and G. Mulas, J. Alloys Compd., 2013, 580(suppl 1), S278–S281 CrossRef CAS PubMed.
- J. A. Puszkiel, F. C. Gennari, P. A. Larochette, J. M. Ramallo-López, U. Vainio, F. Karimi, P. K. Pranzas, H. Troiani, C. Pistidda, J. Jepsen, M. Tolkiehn, E. Welter, T. Klassen, J. Bellosta von Colbe and M. Dornheim, J. Power Sources, 2015, 284, 606–616 CrossRef CAS PubMed.
- J. Puszkiel, F. C. Gennari, P. Arneodo Larochette, H. E. Troiani, F. Karimi, C. Pistidda, R. Gosalawit-Utke, J. Jepsen, T. R. Jensen, C. Gundlach, M. Tolkiehn, J. Bellosta von Colbe, T. Klassen and M. Dornheim, J. Power Sources, 2014, 267, 799–811 CrossRef CAS PubMed.
- C. Pistidda, D. Pottmaier, F. Karimi, S. Garroni, A. Rzeszutek, M. Tolkiehn, M. Fichtner, W. Lohstroh, M. Baricco, T. Klassen and M. Dornheim, Int. J. Hydrogen Energy, 2014, 39, 5030–5036 CrossRef CAS PubMed.
- J. Puszkiel, F. Gennari, P. A. Larochette, F. Karimi, C. Pistidda, R. Gosalawit-Utke, J. Jepsen, T. R. Jensen, C. Gundlach, J. B. von Colbe, T. Klassen and M. Dornheim, Int. J. Hydrogen Energy, 2013, 38, 14618–14630 CrossRef CAS PubMed.
- R. Gosalawit-Utke, T. K. Nielsen, K. Pranzas, I. Saldan, C. Pistidda, F. Karimi, D. Laipple, J. Skibsted, T. R. Jensen, T. Klassen and M. Dornheim, J. Phys. Chem. C, 2012, 116, 1526–1534 CAS.
- R. Gosalawit-Utke, C. Milanese, T. K. Nielsen, F. Karimi, I. Saldan, K. Pranzas, T. R. Jensen, A. Marini, T. Klassen and M. Dornheim, Int. J. Hydrogen Energy, 2013, 38, 1932–1942 CrossRef CAS PubMed.
- R. Gosalawit-Utke, C. Milanese, P. Javadian, J. Jepsen, D. Laipple, F. Karmi, J. Puszkiel, T. R. Jensen, A. Marini, T. Klassen and M. Dornheim, Int. J. Hydrogen Energy, 2013, 38, 3275–3282 CrossRef CAS PubMed.
- K. Miwa, M. Aoki, T. Noritake, N. Ohba, Y. Nakamori, S.-I. Towata, A. Züttel and S.-I. Orimo, Phys. Rev. B: Condens. Matter Mater. Phys., 2006, 74, 155122 CrossRef.
- F. Buchter, Z. Łodziana, A. Remhof, O. Friedrichs, A. Borgschulte, P. Mauron, A. Züttel, D. Sheptyakov, L. Palatinus, K. Chłopek, M. Fichtner, G. Barkhordarian, R. Bormann and B. C. Hauback, J. Phys. Chem. C, 2009, 113, 17223–17230 CAS.
- E. Rönnebro, Curr. Opin. Solid State Mater. Sci., 2011, 15, 44–51 CrossRef PubMed.
- Y. Kim, D. Reed, Y.-S. Lee, J. Y. Lee, J.-H. Shim, D. Book and Y. W. Cho, J. Phys. Chem. C, 2009, 113, 5865–5871 CAS.
- E. Rönnebro and E. H. Majzoub, J. Phys. Chem. B, 2007, 111, 12045–12047 CrossRef PubMed.
- A. Züttel, S. Rentsch, P. Fischer, P. Wenger, P. Sudan, P. Mauron and C. Emmenegger, J. Alloys Compd., 2003, 356–357, 515–520 CrossRef.
- Y. Zhang, E. Majzoub, V. Ozoliņš and C. Wolverton, Phys. Rev. B: Condens. Matter Mater. Phys., 2010, 82, 174107 CrossRef.
- C. Bonatto Minella, S. Garroni, C. Pistidda, R. Gosalawit-Utke, G. Barkhordarian, C. Rongeat, I. Lindemann, O. Gutfleisch, T. R. Jensen, Y. Cerenius, J. Christensen, M. D. Baró, R. D. Bormann, T. Klassen and M. Dornheim, J. Phys. Chem. C, 2011, 115, 2497–2504 Search PubMed.
- M. D. Riktor, M. H. Sorby, K. Chlopek, M. Fichtner and B. C. Hauback, J. Mater. Chem., 2009, 19, 2754–2759 RSC.
- L.-L. Wang, D. D. Graham, I. M. Robertson and D. D. Johnson, J. Phys. Chem. C, 2009, 113, 20088–20096 CAS.
- M. Paskevicius, M. B. Ley, D. A. Sheppard, T. R. Jensen and C. E. Buckley, Phys. Chem. Chem. Phys., 2013, 15, 19774–19789 RSC.
- J. J. Vajo, S. L. Skeith and F. Mertens, J. Phys. Chem. B, 2005, 109, 3719–3722 CrossRef CAS PubMed.
- G. Barkhordarian, T. Klassen, M. Dornheim and R. Bormann, J. Alloys Compd., 2007, 440, L18–L21 CrossRef CAS PubMed.
- Y. Kim, S.-J. Hwang, J.-H. Shim, Y.-S. Lee, H. N. Han and Y. W. Cho, J. Phys. Chem. C, 2012, 116, 4330–4334 CAS.
- C. B. Minella, C. Pistidda, S. Garroni, P. Nolis, M. D. Baró, O. Gutfleisch, T. Klassen, R. Bormann and M. Dornheim, J. Phys. Chem. C, 2013, 117, 3846–3852 CAS.
- C. Bonatto Minella, S. Garroni, D. Olid, F. Teixidor, C. Pistidda, I. Lindemann, O. Gutfleisch, M. D. Baró, R. D. Bormann, T. Klassen and M. Dornheim, J. Phys. Chem. C, 2011, 115, 18010–18014 CAS.
- G. Barkhordarian, T. R. Jensen, S. Doppiu, U. Bosenberg, A. Borgschulte, R. Gremaud, Y. Cerenius, M. Dornheim, T. Klassen and R. Bormann, J. Phys. Chem. C, 2008, 112, 2743–2749 CAS.
- U. Bösenberg, S. Doppiu, L. Mosegaard, G. Barkhordarian, N. Eigen, A. Borgschulte, T. R. Jensen, Y. Cerenius, O. Gutfleisch, T. Klassen, M. Dornheim and R. Bormann, Acta Mater., 2007, 55, 3951–3958 CrossRef PubMed.
-
A. P. Hammersley, FIT2D: An Introduction and Overview, ESRF Internal Report, ESRF97HA02T, FIT2D: An Introduction and Overview, 1997.
- R. Allmann and R. Hinek, Acta Crystallogr., Sect. A: Found. Crystallogr., 2007, 63, 412–417 CrossRef CAS PubMed.
-
K. V. Klementiev, XAFSmass, freeware: http://www.cells.es/Beamlines/CLAESS/software/xafsmass.html.
- B. Ravel and M. Newville, J. Synchrotron Radiat., 2005, 12, 537–541 CrossRef CAS PubMed.
- D. T. Cromer, J. Chem. Phys., 1970, 53, 1891 CrossRef CAS PubMed.
- Y. Filinchuk, E. Rönnebro and D. Chandra, Acta Mater., 2009, 57, 732–738 CrossRef CAS PubMed.
- H. E. Kissinger, Anal. Chem., 1957, 29, 1702–1706 CrossRef CAS.
- F. Gingl, F. Bonhomme, K. Yvon and P. Fischer, J. Alloys Compd., 1992, 185, 273–278 CrossRef CAS.
- M. P. Pitt, M. Paskevicius, D. H. Brown, D. A. Sheppard and C. E. Buckley, J. Am. Chem. Soc., 2013, 135, 6930–6941 CrossRef CAS PubMed.
- J.-F. Brice, A. Courtois and J. Aubry, J. Solid State Chem., 1978, 24, 381–387 CrossRef CAS.
- J.-H. Kim, J.-H. Shim and Y. W. Cho, J. Power Sources, 2008, 181, 140–143 CrossRef CAS PubMed.
- R. Gosalawit-Utke, K. Suarez, J. M. Bellosta von Colbe, U. Bösenberg, T. R. Jensen, Y. Cerenius, C. Bonatto Minella, C. Pistidda, G. Barkhordarian, M. Schulze, T. Klassen, R. D. Bormann and M. Dornheim, J. Phys. Chem. C, 2011, 115, 3762–3768 CAS.
- H. Grove, L. H. Rude, T. R. Jensen, M. Corno, P. Ugliengo, M. Baricco, M. H. Sorby and B. C. Hauback, RSC Adv., 2014, 4, 4736–4742 RSC.
- C. Bonatto Minella, E. Pellicer, E. Rossinyol, F. Karimi, C. Pistidda, S. Garroni, C. Milanese, P. Nolis, M. D. Baró, O. Gutfleisch, K. P. Pranzas, A. Schreyer, T. Klassen, R. Bormann and M. Dornheim, J. Phys. Chem. C, 2013, 117, 4394–4403 CAS.
- E. Deprez, M. A. Muñoz-Márquez, M. A. Roldán, C. Prestipino, F. J. Palomares, C. B. Minella, U. Bösenberg, M. Dornheim, R. Bormann and A. Fernández, J. Phys. Chem. C, 2010, 114, 3309–3317 CAS.
- U. Bösenberg, U. Vainio, P. K. Pranzas, J. M. Bellosta Von Colbe, G. Goerigk, E. Welter, M. Dornheim, A. Schreyer and R. Bormann, Nanotechnology, 2009, 20, 204003 CrossRef PubMed.
- P. K. Pranzas, U. Bösenberg, F. Karimi, M. Münning, O. Metz, C. B. Minella, H.-W. Schmitz, F. Beckmann, U. Vainio, D. Zajac, E. Welter, T. R. Jensen, Y. Cerenius, R. Bormann, T. Klassen, M. Dornheim and A. Schreyer, Adv. Eng. Mater., 2011, 13, 730–736 CrossRef CAS PubMed.
- H. Rietveld, Acta Crystallogr., 1966, 20, 508–513 CrossRef CAS.
- L. Lutterotti, D. Chateigner, S. Ferrari and J. Ricote, Thin Solid Films, 2004, 450, 34–41 CrossRef CAS PubMed.
- T. A. Baser, M. Baricco, S. Enzo, G. Vaughan and A. R. Yavari, J. Mater. Res., 2008, 23, 2166–2173 CrossRef CAS.
-
G. F. A. Guinier, Small-Angle Scattering of X-rays, John Wiley & Sons Inc., New York, 1955 Search PubMed.
- S. Haas, G. Zehl, I. Dorbandt, I. Manke, P. Bogdanoff, S. Fiechter and A. Hoell, J. Phys. Chem. C, 2010, 114, 22375–22384 CAS.
-
I. B. J. Kohlbrecher, http://kur.web.psi.ch/sans1/SANSsoft/sasfit.html.
- E. Deprez, A. Justo, T. C. Rojas, C. López-Cartés, C. Bonatto Minella, U. Bösenberg, M. Dornheim, R. Bormann and A. Fernández, Acta Mater., 2010, 58, 5683–5694 CrossRef CAS PubMed.
- J. Cortés and P. Araya, J. Colloid Interface Sci., 1987, 115, 271–273 CrossRef.
- S. Brunauer, P. H. Emmett and E. Teller, J. Am. Chem. Soc., 1938, 60, 309–319 CrossRef CAS.
- A. C. Dodd, A. J. McKinley, M. Saunders and T. Tsuzuki, J. Nanopart. Res., 2006, 8, 43–51 CrossRef CAS.
- M. D. Riktor, M. H. Sørby, J. Muller, E. G. Bardají, M. Fichtner and B. C. Hauback, J. Alloys Compd., 2015, 632, 800–804 CrossRef CAS PubMed.
- Y. Luo, P. Wang, L.-P. Ma and H.-M. Cheng, J. Alloys Compd., 2008, 453, 138–142 CrossRef CAS PubMed.
- K. Suarez-Alcantara, M. H. Sørby, C. Pistidda, F. Karimi, I. Saldan, B. C. Hauback, T. Klassen and M. Dornheim, J. Phys. Chem. C, 2015, 119, 11430–11437 CAS.
- C. Pistidda, F. Karimi, S. Garroni, A. Rzeszutek, C. Bonatto Minella, C. Milanese, T. T. Le, L. H. Rude, J. Skibsted, T. R. Jensen, C. Horstmann, C. Gundlach, M. Tolkiehn, P. K. Pranzas, A. Schreyer, T. Klassen and M. Dornheim, J. Phys. Chem. C, 2014, 118, 28409–28417 CAS.
- C. Suryanarayana, Prog. Mater. Sci., 2001, 46, 1–184 CrossRef CAS.
- N. Tachibana, K. F. Kobayashi and P. H. Shingu, J. Mater. Sci., 1990, 3149–3154 Search PubMed.
- B. McDermott, R. M. Davis and C. C. Koch, Metall. Trans., 1988, 2867, 2874 Search PubMed.
- A. Bassetti, E. Bonetti, L. Pasquini, A. Montone, J. Grbovic and M. Vittori Antisari, Eur. Phys. J. B, 2005, 43, 19–27 CrossRef CAS.
- Q. Gu, G. Krauss and W. Steurer, Adv. Mater., 2008, 20, 3620–3626 CrossRef CAS PubMed.
- A. H. Üçisik and C. Bindal, Surf. Coat. Technol., 1997, 94–95, 561–565 CrossRef.
- S. Otani, M. M. Korsukova and T. Mitsuhashi, J. Cryst. Growth, 1998, 194, 430–433 CrossRef CAS.
- Y. Wang, H. Y. Wang, Y. F. Yang and Q. C. Jiang, Mater. Sci. Eng. A, 2008, 478, 9–15 CrossRef PubMed.
- J. L. Bobet, C. Even, Y. Nakamura, E. Akiba and B. Darriet, J. Alloys Compd., 2000, 298, 279–284 CrossRef CAS.
- N. Busch, J. Jepsen, C. Pistidda, J. A. Puszkiel, F. Karimi, C. Milanese, M. Tolkiehn, A.-L. Chaudhary, T. Klassen and M. Dornheim, J. Alloys Compd., 2015, 645(suppl 1), S299–S303 CrossRef CAS PubMed.
- T. N. W. Qin and Y. Umakoshi, J. Appl. Phys., 2007, 124303 CrossRef PubMed.
- Z. Li, H. Hahn and R. W. Siegel, Mater. Lett., 1988, 6, 342–346 CrossRef CAS.
- M. X. Zhang and P. M. Kelly, Scr. Mater., 2005, 52, 963–968 CrossRef CAS PubMed.
- P. M. Kelly and M. X. Zhang, Scr. Mater., 2005, 52, 679–682 CrossRef CAS PubMed.
- U. Bösenberg, J. W. Kim, D. Gosslar, N. Eigen, T. R. Jensen, J. M. B. von Colbe, Y. Zhou, M. Dahms, D. H. Kim, R. Günther, Y. W. Cho, K. H. Oh, T. Klassen, R. Bormann and M. Dornheim, Acta Mater., 2010, 58, 3381–3389 CrossRef PubMed.
- F. von Zeppelin, M. Hirscher, H. Stanzick and J. Banhart, Compos. Sci. Technol., 2003, 63, 2293–2300 CrossRef CAS.
- C. Pistidda, G. Barkhordarian, A. Rzeszutek, S. Garroni, C. B. Minella, M. D. Baró, P. Nolis, R. Bormann, T. Klassen and M. Dornheim, Scr. Mater., 2011, 64, 1035–1038 CrossRef CAS PubMed.
- F. Karimi, P. K. Pranzas, A. Hoell, U. Vainio, E. Welter, V. S. Raghuwanshi, C. Pistidda, M. Dornheim, T. Klassen and A. Schreyer, J. Appl. Crystallogr., 2014, 47, 67–75 CrossRef CAS.
Footnote |
| † Electronic supplementary information (ESI) available. See DOI: 10.1039/c5cp03557k |
|
| This journal is © the Owner Societies 2015 |
Click here to see how this site uses Cookies. View our privacy policy here.  Open Access Article
![[thin space (1/6-em)]](https://www.rsc.org/images/entities/char_2009.gif) :
:![[thin space (1/6-em)]](https://www.rsc.org/images/entities/char_2009.gif) 1. All milling procedures were performed in a SPEX 8000 mill.
1. All milling procedures were performed in a SPEX 8000 mill.
![[thin space (1/6-em)]](https://www.rsc.org/images/entities/char_2009.gif) θ, where λ is the X-ray wavelength and 2θ is the scattering angle. The SAXS patterns were collected with a Pilatus 300k detector. The beamline was equipped with a double crystal Si(311)-monochromator with the wavelength resolution of Δλ/λ < 10−4. All selected energies with their corresponding anomalous dispersion factors are listed in Table 1.
θ, where λ is the X-ray wavelength and 2θ is the scattering angle. The SAXS patterns were collected with a Pilatus 300k detector. The beamline was equipped with a double crystal Si(311)-monochromator with the wavelength resolution of Δλ/λ < 10−4. All selected energies with their corresponding anomalous dispersion factors are listed in Table 1.


![[thin space (1/6-em)]](https://www.rsc.org/images/entities/char_2009.gif) q) represent, respectively, the volume and the form factor of spherical particles. The latter expression is given by:
q) represent, respectively, the volume and the form factor of spherical particles. The latter expression is given by:
![[thin space (1/6-em)]](https://www.rsc.org/images/entities/char_2009.gif) Ei) = q−α(Ei) + C(Ei) was included to account for the scattering of large particles (out of experimental accessible q-range) and the energy dependent fluorescence and resonant-Raman scattering. For the fitting procedure, the program SASfit53 was used. The calculated volume-weighted size distribution from the fit for the dehydrogenated Ca-RHC + 0.1NbF5 sample is presented in Fig. 11.
Ei) = q−α(Ei) + C(Ei) was included to account for the scattering of large particles (out of experimental accessible q-range) and the energy dependent fluorescence and resonant-Raman scattering. For the fitting procedure, the program SASfit53 was used. The calculated volume-weighted size distribution from the fit for the dehydrogenated Ca-RHC + 0.1NbF5 sample is presented in Fig. 11.


