Ice nucleation behaviour on sol–gel coatings with different surface energy and roughness†
Received
4th June 2015
, Accepted 20th July 2015
First published on 21st July 2015
Abstract
In this paper, the ice nucleation temperatures of 10 μL water droplets on a series of sol–gel coatings with different roughness and surface energies were obtained using a customized automatic measurement system. Classical nucleation theory was then employed to explain the different icing behaviour on the coatings. It was found that the wetting mode at low temperatures is strongly correlated with the icing behavior of the droplets on the surfaces. Ice-phobic coatings can lower the icing temperature of the droplet on the surface by up to 6.9 °C compared with non-icephobic ones. Using classical nucleation theory, our results support some recent observations that the dominant nucleation sites are along the substrate–water–vapour three-phase contact line rather than at the substrate–water interface.
Introduction
Anti-icing materials have been a well discussed topic in the past few decades and may prove to be important in many areas such as outdoor facilities operating in winter or at high altitudes. Generally, ice accumulation problems have been dealt with by using mechanical forces or by applying chemicals. Problems associated with these approaches include low efficiency, high cost and potential environmental hazards. With the development of nano technologies and the emergence of superhydrophobic surface engineering, workers have been trying to utilize superhydrophobicity for anti-icing applications. However, superhydrophobicity does not always guarantee icephobicity, as discussed by several reports.1–7 The condensation of water molecules at low temperatures may compromise the water repellent ability of the surfaces. The connection between wettability and icephobicity and the role played by surface energy and roughness during ice formation have not been thoroughly investigated to date. Many investigations have focused on ice adhesion, while few have encompassed the nucleation itself which is needed to provide a fundamental understanding of the development of ice-phobic materials. Equally, most of the techniques used to develop the ice-phobic coatings such as lithography,8–11 chemical etching,12–14 liquid-infused porous surface,15 chemical or physical vapour deposition16 either require special equipment with high cost, or possess limitations in the choice of substrates, rendering them unsuitable for large scale applications. Conversely, it would seem that sol–gel coatings are well accepted for large scale applications on a wide range of substrates while the potential applications for ice-phobic coating are yet to be fully explored.
In our previous work,17 a series of sol–gel coatings was developed and their ice adhesion properties were investigated. The current study investigates the ice formation behaviour on these developed sol–gel coatings, covering a large range of surface roughness and apparent surface energy. Heterogeneous nucleation behaviour of supercooled water droplets on different coating surfaces is investigated statistically with the aim of revealing the mechanisms for ice nucleation, as well as the effect of surface roughness and the apparent surface energy.
Experimental work
Two groups of sol–gel coatings with different roughness and surface energy were prepared on glass slides; the detailed procedure has been reported before.17 The common sol for both groups is made of methyl triethoxysilane (MTEOS, 99%, Sigma Aldrich, USA) and glycidyloxypropyl trimethoxysilane (GLYMO, 98%, Sigma Aldrich, USA). In one group, different amounts of silica particles were added to achieve varying degrees of surface roughness. In another group, a hydrophobic additive, fluoroalkylsilane (FAS, 97%, Sigma Aldrich, USA), was introduced to induce low surface energy. In addition, bare glass slides and glass slides decorated with FAS but without the sol–gel coating were also studied for comparison. The fluorinated glass was prepared by immersing the glass in hydrolysed 1 vol% FAS methanol solution for 12 hours followed by curing at 120 °C for one hour. The roughness and measured apparent surface energy of the coatings are shown in Fig. 1 and the sample wetting status at −10 °C based on the previous study17 is shown in Table 1. The M-x series of samples lack the addition of the hydrophobic additive FAS, and the number x indicates the weight percentage of silica nanoparticles in the final coating. The F-x series of samples follow the same coating composition and procedure except that they contain the hydrophobic additive, FAS. As a result, the weight percent of the silica particle is slightly lower than their M-series counterpart, but the surface morphology remains similar. The surface morphology of the coatings is shown in Fig. S1 in the ESI.† The diameter of the silica particles is around 16 nm. In the current study, thin glass substrates (100 μm thick) were used in order to minimize the temperature gradient for better control of the icing temperature. The coating thickness is around 20 to 40 μm so that the temperature gradient in the coatings can be considered negligible.
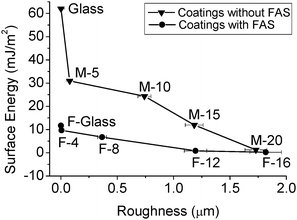 |
| | Fig. 1 Surface roughness and surface energy of the samples used in the study. | |
Table 1 Sample wetting status at −10 °C
| Samples |
Contact angle at −10 °C (°) |
Wetting mode at −10 °C |
| Glass |
28.5 ± 0.3 |
Wenzel |
| M-5 |
70.0 ± 0.4 |
Wenzel |
| M-10 |
75.0 ± 1.1 |
Wenzel |
| M-15 |
81.0 ± 1.2 |
Wenzel |
| M-20 |
115.7 ± 1.9 |
Wenzel |
| F-glass |
105.2 ± 0.5 |
Wenzel |
| F-4 |
105.4 ± 0.7 |
Wenzel |
| F-8 |
110.3 ± 0.5 |
Wenzel |
| F-12 |
153.9 ± 3.1 |
Semi-Cassie to Wenzel |
| F-16 |
163.5 ± 2.8 |
Cassie |
The icing behaviour of the droplets on the coatings was investigated using a dedicated automatic measurement system. It consists of two stacked peltier thermoelectric cooling units, an aluminium block with an embedded digital temperature sensor and a loop control system. The schematic is shown in Fig. 2. The function of the peltier stage on the bottom is purely for cooling of the peltier stage above it so that it can accomplish repeated cooling and heating cycles effectively. The heat generated by the bottom peltier stage is diffused by the bulk aluminium walls which are also well connected to the heat sink on the back of the device. The system utilizes a laser to detect the icing events and the detector was placed normal to the direction of the laser and pointing to the droplet. All the holes for wires and the gap between the lid and the chamber were sealed with silicone to ensure an isolated environment to prevent the moisture outside of the chamber from entering the chamber.
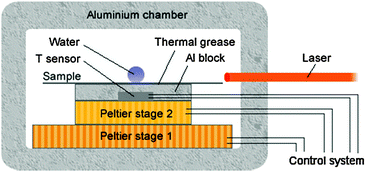 |
| | Fig. 2 Schematic of the automatic measurement system. | |
For each sample, a 10 μL deionised water droplet was placed on the surface and the sample was cooled from room temperature to a set point which was lower than the suspected supercoiling point. After complete freezing, the ice droplet was then warmed up to room temperature and held for 1 to 3 minutes to ensure complete melting of the ice and equilibrium state before the next cycle begins. The ramp rate from 0 °C to the set low temperature point was 5 °C min−1. The ramp rate from room temperature to 0 °C and from set points to room temperature will not affect the nucleation process, and thus was set at 40 °C min−1 to save time. A typical cycling record is shown in Fig. 3.
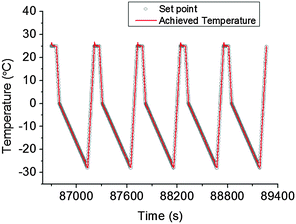 |
| | Fig. 3 The 170th to 174th cycles on sample M-10. | |
Because the droplets were always supercooled significantly when nucleation occurred the freezing event was very rapid in each case. At the beginning of freezing of the water droplet, the detected laser intensity would change drastically because of the enhanced refraction and reflection inside the freezing droplet as shown in Fig. 4. There is a fluctuation (i.e. increase) in the measured temperature because of the release of latent heat from water to ice. This sensitive, measurable change in turn confirms that the temperature gradient caused by the substrate itself is negligible. The temperature at which a sudden increase of the photodetector reading is observed, which represents the beginning of ice formation, is defined as the supercoiling point, or nucleation or icing temperature. To study the nucleation behaviour and gather statistical data, each sample was tested with 500 cycles.
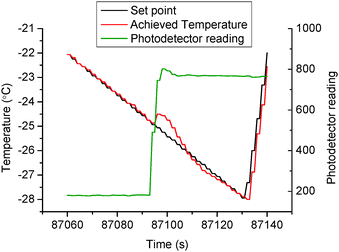 |
| | Fig. 4 The detection of icing formation during a typical cycle (the 170th cycle on sample M-10). | |
Results and discussion
The obtained icing temperatures for the samples are shown in Fig. 5 and 6 for the M- and F-series of coatings, respectively. The icing temperatures for most M-series samples have a stationary distribution, i.e. they stay relatively stable with increasing number of cycles. However, M-20 and some of the F-series tend to show a slight increase of the nucleation temperatures over the time taken for the 500 cycles. This is likely due to the continuous penetration of water into the asperities of the surfaces together with slight spreading of the droplets on surfaces which have a higher contact angle. This is seen not to be the case for the hydrophilic surfaces with a lower contact angle which did not display such a phenomenon. Although the spreading was not thought significant, it has led to a larger contact area between the droplet and the surface, thus theoretically would result in more possible nucleation sites and so the possibility of the icing temperature tending to increase. For low contact angle surfaces, the wetting state is relatively stable during the freezing/melting cycles, thus there was little or no change to the nucleation process. Despite the mild shift of the nucleation temperatures for some of the samples, there is a good statistical agreement between the first 250 cycles and the next 250 cycles in all cases. This kind of phenomenon was common in some previous reports,15,18–20 and does not affect the theoretical analysis which follows.
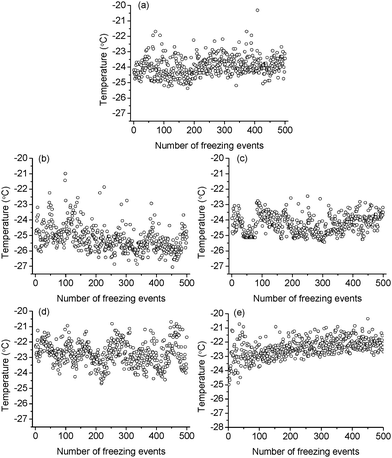 |
| | Fig. 5 The nucleation temperature of a 10 μL droplet on (a) glass, (b) M-5, (c) M-10, (d) M-15 and (e) M-20. | |
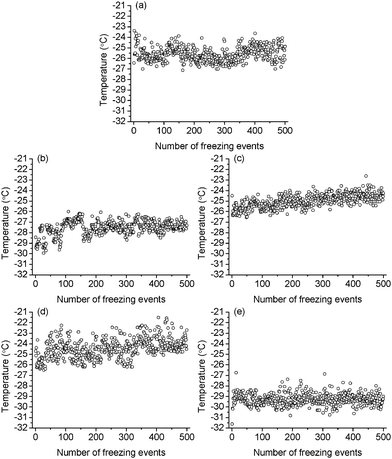 |
| | Fig. 6 The nucleation temperature of a 10 μL droplet on (a) F-glass, (b) F-4, (c) F-8, (d) F-12 and (e) F-16. | |
To investigate the distribution of icing temperatures on the samples, we bin the data with a bin width of 0.2 °C across the whole icing temperature range. The distribution of icing events on each bin section with the normalized distribution curve is shown in Fig. S2 and S3 in the ESI.† The summarized normalized distribution is shown in Fig. 7. The ordinate is converted from the icing event number to freezing probability defined as
| |  | (1) |
where
Ni is the number of icing events in the
ith bin and
N0 the total icing events which are 500 in the current study. The peak temperatures for the maximum freezing probability density for each sample are shown in
Table 2. The difference between the lowest and highest mean icing temperature among all samples is 6.9 °C.
Table 2 Statistical values of the nucleation events on the samples
| Samples |
Peak value (°C) |
T
50 (°C) |
10–90 width (°C) |
| Glass |
−23.95 |
−24.00 |
1.63 |
| M-5 |
−25.23 |
−25.36 |
1.94 |
| M-10 |
−24.26 |
−24.31 |
1.63 |
| M-15 |
−22.76 |
−22.75 |
2.06 |
| M-20 |
−22.42 |
−22.43 |
1.69 |
| F-glass |
−25.60 |
−25.63 |
1.88 |
| F-4 |
−27.54 |
−27.44 |
1.75 |
| F-8 |
−24.99 |
−25.00 |
1.63 |
| F-12 |
−24.44 |
−24.45 |
2.50 |
| F-16 |
−29.28 |
−29.31 |
1.44 |
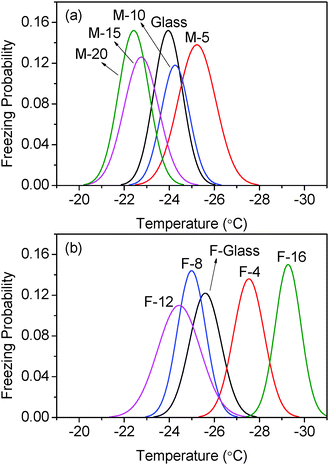 |
| | Fig. 7 Freezing probability distribution as a function of temperature on (a) non-fluorinated (M-x series) samples and (b) fluorinated (F-x series) samples. | |
Moreover, the survival curve is also adopted here to give another look at the distribution. The survival curve is defined as21
| |  | (2) |
where
N(
t) is the number of unfrozen events at time
t and
N0 the total icing events. Since the temperature decreases linearly with time,
eqn (2) evolves to
| |  | (3) |
where
c is the cooling rate. The results are shown in
Fig. 8. It is notable that the survival curves have very similar slopes and show a clear coherent difference between samples. The
T50 data (the temperature for 50% unfrozen events), which were used as the icing temperature in some reports,
15,22,23 are in perfect agreement with the peak values. Notice that the survival curves are based on 500 cycles which are much more than the 200 cycle threshold
21 for a stable curve, and the slope at the bottom half of the freezing events is close to zero. Also worthy of note that the 10–90 widths (the range from 10% frozen temperature to 90% frozen temperature) shown in
Table 2 are comparable to the data demonstrated in
ref. 24. Thus, we believe that the investigation based on the data is statistically reliable. Such a comparison does suggest however that the nucleation site which is dominant seems not to be changing dramatically in those samples where there is an increasing temperature trend over the 500 runs, which suggests that either any extra nucleation sites exposed during spreading of the drops are very similar indeed to the sites responsible for the nucleation event say 50 cycles earlier or, that there is simply a drift in the temperature measuring – which of course seems not to be the case in most of the 500 runs series carried out.
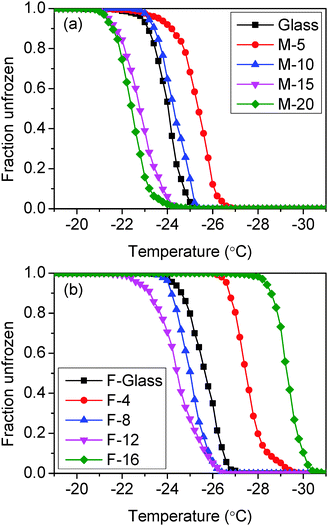 |
| | Fig. 8 The survival curves of (a) non-fluorinated samples and (b) fluorinated samples. | |
Nucleation is a stochastic process, yet it is affected by the energy and geometry of the surface according to classical nucleation theory. It is known that a low surface energy and convex surface are preferable for lower icing temperatures.25–30 For the sample group without FAS (hydrophobic) treatment, M-5 has the lowest icing temperature. This is likely because this surface is relatively smooth and has much lower surface energy than bare glass (Fig. 1). M-10 shows higher icing temperature as it is rougher than M-5 although its apparent surface energy is lower. The other two samples in this group have very similar and high icing temperatures. These two samples are the roughest in the series and can be significantly wetted by water before freezing occurs. It seems that fully wetted rough surfaces provide numerous concave positions for nucleation which have the lowest barrier as compared with smooth surfaces.
Similarly, in the second group of samples with FAS (hydrophobic) treatment, F-4 has a relatively lower icing temperature because of its smooth surface and lower surface energy than F-glass. Samples F-8 and F-12 show higher icing temperature because of their rough surface and Wenzel wetting status at low temperature. F-16, in contrast, has the lowest icing temperature among all the surfaces because it can maintain the Cassie state at sub-zero temperatures.17 This means that there is air trapped between the water droplet and the surface. In this case, the contact area between water and the substrate is much less than on a flat or a fully wetted rough surface. Although it might not necessarily mean that the concave sites for nucleation were totally avoided, the chance for concave surface nucleation was greatly reduced in such a situation.
To further investigate the different nucleation behaviours of the samples, we first employed classical nucleation theory and assumed that heterogeneous nucleation occurs only at the water/coating interface. The nucleation rate can be expressed as31,32
| |  | (4) |
| |  | (5) |
where
JA is the pre-factor,
k the Boltzmann constant,
Tm = 273.15 K the melting point of ice,
γ = [28 + 0.25(
T − 273.15)] × 10
−3 J m
−2 the water–ice interfacial energy,
33 Δ
Hm,v = (6010 J mol
−1)/(1.965 × 10
−5 m
3 mol
−1) = 3.06 × 10
8 J m
−3 the volumetric enthalpy change during ice formation,
34 and
fA(
θ) the factor which is dependent on the surface geometry and it is always between 0 (no energy barrier) and 1 (homogeneous nucleation) no matter whether the surface is flat, concave or convex.
25–30
For each data set, the nucleation rate R(Ti) at Ti with bin width of ΔTi which contains ni icing events can be expressed as follows18,35
| |  | (6) |
where
c is the cooling rate,

the unfrozen icing events. Since the droplet on each sample has different contact area because of the different contact angle and roughness, the area nucleation rate becomes
35| |  | (7) |
where
S is the actual contact area between the droplet and the substrate. For the smooth samples such as the glass slide without sol–gel coating, the actual contact area is determined by the nominal area covered by the water droplet with a radius of
r:
32| |  | (8) |
where
V is the volume of the droplet and
θ the apparent contact angle. For rough and fully wetted samples, the actual contact area would be equal to the apparent contact area multiplied by the roughness ratio
fw which is defined by Wenzel's equation
36where
θ* is the contact angle for an ideal smooth surface. However, since the particle and the base gel which constitute the coatings have different surface energy and their fraction in each sample is different, it is impossible to calculate the roughness ratio through this method. According to some reports,
37,38 the roughness ratio for a patterned superhydrophobic surface is between 1.2 and 3.2. For the rough samples M-20 and F-16, their contact angle at room temperature are 162.7° and 172.7°, respectively. Assuming that the intrinsic contact angle is between 110° and 120° because the surface is basically fully covered by the hydrophobic nano particles, then the roughness ratio should be between 1.9 and 2.9 based on Wenzel's law. This provides a reasonable basis for further analysis. Considering that the surface roughness is caused by the nanoparticles and it starts to form a kind of porous structure when the roughness becomes higher, we assume that the roughness ratio changes exponentially with the roughness value. Based on the data we have, the roughness ratio can be approximately modelled as
| | fw = 20.75![[thin space (1/6-em)]](https://www.rsc.org/images/entities/char_2009.gif) ra ra | (10) |
where
ra is the roughness (root mean square) of the samples. This makes the roughness ratio for M-20, which is the largest among samples with the Wenzel wetting mode, to be 2.458. For superhydrophobic sample F-16, the contact area is decided by the Cassie–Baxter equation
39| | cos![[thin space (1/6-em)]](https://www.rsc.org/images/entities/char_2009.gif) θ = fc(cos θ = fc(cos![[thin space (1/6-em)]](https://www.rsc.org/images/entities/char_2009.gif) θ* + 1) − 1 θ* + 1) − 1 | (11) |
Since the surface is mainly occupied by the hydrophobic nanoparticles,
17θ* was assumed to be 110°, which is close to the value for fluorinated flat glass. The calculated contact area of different samples is listed in
Table 3.
Table 3 Calculated contact area of different samples
| Samples |
Roughness (μ) |
Contact radius (mm) |
Contact area ratio |
Contact area (mm2) |
| Glass |
0.001 ± 0.000 |
2.907 |
1.001 |
26.548 |
| M-5 |
0.078 ± 0.005 |
1.985 |
1.041 |
12.889 |
| M-10 |
0.741 ± 0.058 |
1.908 |
1.470 |
16.802 |
| M-15 |
1.183 ± 0.079 |
1.818 |
1.850 |
19.188 |
| M-20 |
1.730 ± 0.097 |
1.296 |
2.458 |
12.960 |
| F-glass |
0.003 ± 0.001 |
1.459 |
1.001 |
6.689 |
| F-4 |
0.006 ± 0.001 |
1.456 |
1.003 |
6.678 |
| F-8 |
0.365 ± 0.038 |
1.381 |
1.209 |
7.239 |
| F-12 |
1.194 ± 0.100 |
0.591 |
1.860 |
2.042 |
| F-16 |
1.817 ± 0.140 |
0.382 |
0.063 |
0.029 |
Using the nucleation rate from experiment, the best fits to eqn (4) are shown in Fig. 9. The fitted log10(JA) and fA(θ) are listed in Table 4.
Table 4 Fitted nucleation parameters
| Samples |
Fitted fA(θ) |
log10(JA) |
Fitted fL(θ) |
log10(JL) |
| Glass |
0.172 |
8.860 |
0.172 |
6.023 |
| M-5 |
0.154 |
7.914 |
0.154 |
4.928 |
| M-10 |
0.241 |
11.039 |
0.241 |
8.186 |
| M-15 |
0.136 |
8.452 |
0.136 |
5.678 |
| M-20 |
0.118 |
7.953 |
0.118 |
5.155 |
| F-glass |
0.249 |
10.611 |
0.249 |
7.475 |
| F-4 |
0.254 |
9.258 |
0.254 |
6.121 |
| F-8 |
0.231 |
10.495 |
0.231 |
7.416 |
| F-12 |
0.152 |
9.005 |
0.152 |
5.666 |
| F-16 |
0.390 |
13.239 |
0.390 |
8.019 |
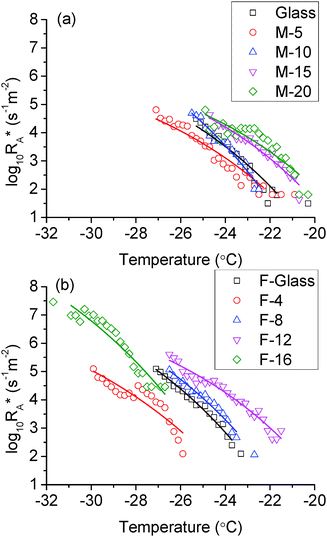 |
| | Fig. 9 Area nucleation rate on (a) non-fluorinated samples and (b) fluorinated samples. Hollow symbols are data derived from the experiment. Solid lines are the best fits by eqn (4). | |
In the non-fluorinated group, the area nucleation rates for M-20 and M-15, glass and M-10 are very close. This is in agreement with the overlap among these samples as shown in Fig. 7. M-5 has the lowest nucleation rate, so it shows the lowest icing temperature in this group. For the fluorinated samples, they showed a relatively well separated and parallel trend. However, the curve for F-16 indicated an extraordinary nucleation rate, which is 2 orders of magnitude higher than other samples. There might be several factors involved. It is possible that the surface can withstand the cooling and spreading of the droplet only up until some threshold value. After that, the energy barrier of nucleation on a convex surface is conquered by the supercooling and all the contact area could serve as active nucleation sites. This would explain the observed lower starting icing temperature, but not the high nucleation rate. As can be seen in Fig. 9, the fitted curve for F-16 has a similar slope as others. It predicts the nucleation rate at the order of 102–104 s−1 m−2 between −24 °C and −26 °C. At such a rate, at least some icing events would have occurred. However, there was not a single icing event in this range after 500 cycles for F-16. The lowest and highest nucleation rates are both 2 orders of magnitude larger than other samples. This is contradictory to the observed lowest icing temperature of F-16. Therefore the assumption made earlier that nucleation occurs at the water/coating interface needs to be further examined.
Given that the calculated nucleation rate was based on the actual contact area, a positive shift of the nucleation rate is expected if the actual contact area is only a small fraction of the projected area, for example the case for F-16 as discussed above. To resolve the discrepancy, we suggest that the nucleation process is dominated by another mechanism rather than the heterogeneous nucleation at the water–substrate interface which we began this analysis with. The possible nucleation sites generally include the water–solid interface, the water–air interface and the bulk water. Bulk water nucleation is obviously not dominant in the current case as it would equate to homogeneous nucleation which has the highest free energy barrier. Nucleation initiating at the water–air interface has been reported by several authors.40–44 However, they were mostly with cases of falling water droplets which lack the substrate–water interface to provide the low energy barrier nucleation site. The droplet size in our study is also not on the micro scale so that the surface-to-volume ratio can never be large enough that the surface nucleation rate would contribute dominantly to the total nucleation rate.43 Jung44 reported a case in which the nucleation started at the water–air interface. However, it was because of the air flow which accelerated the evaporation of the droplet and caused an increased temperature difference in the water–air interface. Besides, another contribution could be the disturbance of the air flow on the droplet surface which would definitely favour the nucleation process. In our case, the droplet was cooled from the bottom and there was no air flow inside the test chamber. So it is therefore unlikely that the surface nucleation could dominant the process.
With regard to the heterogeneous nucleation process,5,32,45 each water droplet always became blurry, or non-transparent, at the onset of freezing which demonstrated a formed ice shell around the droplet. It was also confirmed by infrared thermography46,47 that there was a sudden temperature jump in a very short time at the top of the droplet because of the release of latent heat. There have been quite some debates about the initiation site of nucleation. Some authors48–50 suggested that the nucleation preferentially starts at the three-phase contact line, while others51,52 claimed that it starts randomly at the whole solid–liquid interface. The controversy might be caused by different test environments or substrate microstructures. Recently, Gurganus et al.53 found that a nanotextured surface can increase the chance of contact line nucleation. Given the fact that most of our samples are covered by nanoparticles, we suspect that the dominant nucleation sites are mainly along the three-phase contact line instead of on the whole contact area. Accordingly, we define a line nucleation rate as
| |  | (12) |
Such a nucleation rate is plotted in
Fig. 10 and the corresponding fitting parameters
fL(
θ) and log
10(
JL) are shown in
Table 4. It is worth mentioning that there are also three-phase contact lines at the water–substrate interface for F-16 as there is likely trapped air there. We have ignored this for the convenience of calculation in the current work. Fortunately, the negligence does not substantially change the fitting results, as the larger the denominator in
eqn (12), the lower the curve of F-16 in
Fig. 10b. Equally, the reflected nucleation rate is not very sensitive to the contact line length change due to the exponential relationship as shown in
eqn (4).
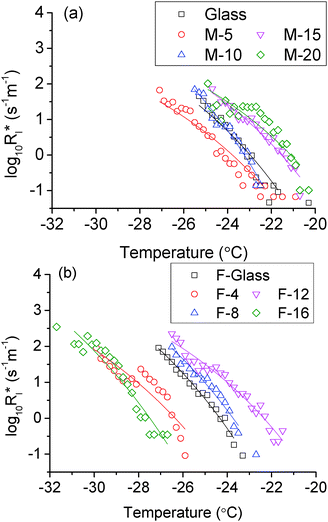 |
| | Fig. 10 Line nucleation rate on (a) non-fluorinated samples and (b) fluorinated samples. Hollow symbols are data derived from the experiment. Solid lines are the best fits by eqn (4). | |
Comparing Fig. 9 and 10, it is clear that the relative position for most samples does not change except for F-16. With the three-phase contact line nucleation assumption, the nucleation rate for sample F-16 is comparable with that of other samples. Statistically it also makes good sense as the top and bottom icing temperature fall reasonably in the same region. For any given temperature in the range, the nucleation rate for F-16 is always the lowest, which explains perfectly the lowest icing temperature observed in the experiment.
As can be seen in Table 4, the change of the fitting mode from contact area to contact line showed no influence on the value of fitting geometric factors in the fitting process because they reflect the slopes of the curves as revealed in eqn (4). For most of the samples (except M-5), the values of the geometric factors reflect the change of corresponding icing temperatures in each group, i.e., the lower the geometric factor, the higher the icing temperature. The geometric factor is a quantitatively verified parameter by simulation54 in terms of classical nucleation theory. It is related to intrinsic surface energy and surface morphology. However, it is obvious that the surface morphology plays a more important role when the surface gets rough. For fully wetted surfaces, which represent most of the samples in the current work, the nuclei are more likely to form at the concave sites between the particles and the base gel or between two particles. The wedge shaped nucleus on these surfaces would lead to a lower geometric factor than the crown shaped ones on flat or convex surfaces.29,30 The rougher the surface, the more concave sites are available for nucleation, and thus the higher icing temperature. It is also noticed that the samples in the fluorinated group generally have higher geometric factors than their counterparts in the non-fluorinated group. This reflects the effect of decreased intrinsic surface energy of samples with addition of FAS. Among all the samples, F-16 has an extraordinarily high geometric factor. This is because of its non-wetting behaviour at low temperatures. Consequently the concave sites are prevented to certain extent from being in contact with water droplets because of the trapped air.
As for the pre-factors, it is interesting to notice that most of them follow the trend of the corresponding geometric factors in each group (except F-4). Generally, the pre-factor represents the diffusion of water molecules to the ice embryo.55 It is related at least to the fractional area for nucleation, the number and size of nuclei, and the rate of molecular kinetics at the critical nucleus boundary.18,55,56 Although the exact quantification for the pre-factor has not been resolved satisfactorily,57 it seems that the pre-factor is closely related to the geometric factor in the current study. It is probably because the water–ice interfaces are less on given size nuclei formed on a concave site than on a flat or a convex site. Consequently the efficiency of the water molecules to move to the ice embryo is lower on a concave nuclei site. Thus, the lower the geometric factor, the lower the pre-factor.
Conclusions
We have investigated the ice nucleation temperatures of 10 μL water droplets on a series of sol–gel coatings covering a wide range of roughness, apparent surface energy, and different wetting modes at low temperatures. The results correlate well with the wetting behaviour of the samples at low temperatures. Low surface energy coupled with the rough surface and the Cassie wetting mode is preferred for any lowering of the nucleation temperature. The ice-phobic coating in the fluorinated series was seen to lower the icing temperature by up to 6.9 °C.
Through analysis based on classical nucleation theory, the geometric factors and pre-factors show strong correlation with each other. Both of them are affected by the surface properties and wetting mode at low temperatures. Our fitting results support the conclusion that the dominant heterogeneous nucleation sites in our study are not on the whole water–substrate interface, but rather on the water–air–substrate contact line.
Acknowledgements
Q. T. Fu acknowledges the financial support from the Nanyang Technological University (NTU) in the form of research scholarship. Z. Chen acknowledges the SUG grant support from the College of Engineering (CoE) of NTU.
References
- S. Farhadi, M. Farzaneh and S. A. Kulinich, Appl. Surf. Sci., 2011, 257, 6264–6269 CrossRef CAS PubMed.
- L. L. Cao, A. K. Jones, V. K. Sikka, J. Z. Wu and D. Gao, Langmuir, 2009, 25, 12444–12448 CrossRef CAS PubMed.
- M. Zou, S. Beckford, R. Wei, C. Ellis, G. Hatton and M. A. Miller, Appl. Surf. Sci., 2011, 257, 3786–3792 CrossRef CAS PubMed.
- K. K. Varanasi, T. Deng, J. D. Smith, M. Hsu and N. Bhate, Appl. Phys. Lett., 2010, 97, 234102 CrossRef PubMed.
- L. Yin, Q. Xia, J. A. Xue, S. Q. Yang, Q. J. Wang and Q. M. Chen, Appl. Surf. Sci., 2010, 256, 6764–6769 CrossRef CAS PubMed.
- S. A. Kulinich, S. Farhadi, K. Nose and X. W. Du, Langmuir, 2011, 27, 25–29 CrossRef CAS PubMed.
- M. Nosonovsky and V. Hejazi, ACS Nano, 2012, 6, 8488–8491 CrossRef CAS PubMed.
- L. Mishchenko, B. Hatton, V. Bahadur, J. A. Taylor, T. Krupenkin and J. Aizenberg, ACS Nano, 2010, 4, 7699–7707 CrossRef CAS PubMed.
- P. Eberle, M. K. Tiwari, T. Maitra and D. Poulikakos, Nanoscale, 2014, 6, 4874–4881 RSC.
- T. Maitra, M. K. Tiwari, C. Antonini, P. Schoch, S. Jung, P. Eberle and D. Poulikakos, Nano Lett., 2013, 14, 172–182 CrossRef PubMed.
- J. Chen, R. M. Dou, D. P. Cui, Q. L. Zhang, Y. F. Zhang, F. J. Xu, X. Zhou, J. J. Wang, Y. L. Song and L. Jiang, ACS Appl. Mater. Interfaces, 2013, 5, 4026–4030 CAS.
- R. Menini and M. Farzaneh, Surf. Coat. Technol., 2009, 203, 1941–1946 CrossRef CAS PubMed.
- R. Jafari, R. Menini and M. Farzaneh, Appl. Surf. Sci., 2010, 257, 1540–1543 CrossRef CAS PubMed.
- F. Wang, C. Li, Y. Lv, F. Lv and Y. Du, Cold Reg. Sci. Technol., 2010, 62, 29–33 CrossRef PubMed.
- P. W. Wilson, W. Lu, H. Xu, P. Kim, M. J. Kreder, J. Alvarenga and J. Aizenberg, Phys. Chem. Chem. Phys., 2013, 15, 581–585 RSC.
- Y. Y. Wu, Y. Inoue, H. Sugimura, O. Takai, H. Kato, S. Murai and H. Oda, Thin Solid Films, 2002, 407, 45–49 CrossRef CAS.
- Q. Fu, X. Wu, D. Kumar, J. W. C. Ho, P. D. Kanhere, N. Srikanth, E. Liu, P. Wilson and Z. Chen, ACS Appl. Mater. Interfaces, 2014, 6, 20685–20692 CAS.
- L. H. Seeley and G. T. Seidler, Phys. Rev. Lett., 2001, 87, 055702 CrossRef CAS.
- R. A. Shaw, A. J. Durant and Y. Mi, J. Phys. Chem. B, 2005, 109, 9865–9868 CrossRef CAS PubMed.
- T. W. Barlow and A. D. J. Haymet, Rev. Sci. Instrum., 1995, 66, 2996–3007 CrossRef CAS PubMed.
- P. W. Wilson, A. F. Heneghan and A. D. J. Haymet, Cryobiology, 2003, 46, 88–98 CrossRef CAS.
- P. W. Wilson and A. D. J. Haymet, Phys. Chem. Chem. Phys., 2009, 11, 2679–2682 RSC.
- P. W. Wilson, K. E. Osterday, A. F. Heneghan and A. D. J. Haymet, J. Biol. Chem., 2010, 285, 34741–34745 CrossRef CAS PubMed.
- P. W. Wilson and A. D. J. Haymet, J. Phys. Chem. B, 2012, 116, 13472–13475 CrossRef CAS PubMed.
- M. J. Jamieson, C. E. Nicholson and S. J. Cooper, Cryst. Growth Des., 2005, 5, 451–459 CAS.
- D. H. Xu and W. L. Johnson, Phys. Rev. B: Condens. Matter Mater. Phys., 2005, 72, 052101 CrossRef.
- S. J. Cooper, C. E. Nicholson and J. Liu, J. Chem. Phys., 2008, 129, 124715 CrossRef PubMed.
- N. H. Fletcher, J. Chem. Phys., 1958, 29, 572–576 CrossRef CAS PubMed.
- B. K. Chakraverty and G. M. Pound, Acta Metall., 1964, 12, 851–860 CrossRef CAS.
- C. A. Sholl and N. H. Fletcher, Acta Metall., 1970, 18, 1083–1086 CrossRef.
- D. T. Wu, Solid State Phys., 1997, 50, 37–187 CAS.
- P. Hao, C. Lv and X. Zhang, Appl. Phys. Lett., 2014, 104, 161609 CrossRef PubMed.
-
H. R. Pruppacher, J. D. Klett and P. K. Wang, Microphysics of clouds and precipitation, Kluwer Academic Publishers, Dordrecht, 2nd edn, 1997, pp. 157–161 Search PubMed.
- G. P. Johari, J. Chem. Phys., 1997, 107, 10154–10165 CrossRef CAS PubMed.
- K. Y. Li, S. Xu, W. X. Shi, M. He, H. L. Li, S. Z. Li, X. Zhou, J. J. Wang and Y. L. Song, Langmuir, 2012, 28, 10749–10754 CrossRef CAS PubMed.
- R. N. Wenzel, Ind. Eng. Chem., 1936, 28, 988–994 CrossRef CAS.
- J. Yong Chae and B. Bharat, Nanotechnology, 2006, 17, 4970–4980 CrossRef.
- Z. Yoshimitsu, A. Nakajima, T. Watanabe and K. Hashimoto, Langmuir, 2002, 18, 5818–5822 CrossRef CAS.
- A. B. D. Cassie and S. Baxter, Trans. Faraday Soc., 1944, 40, 546–551 RSC.
- Y. S. Djikaev, A. Tabazadeh, P. Hamill and H. Reiss, J. Phys. Chem. A, 2002, 106, 10247–10253 CrossRef CAS.
- A. Tabazadeh, Y. S. Djikaev, P. Hamill and H. Reiss, J. Phys. Chem. A, 2002, 106, 10238–10246 CrossRef CAS.
- A. Tabazadeh, Y. S. Djikaev and H. Reiss, Proc. Natl. Acad. Sci. U. S. A., 2002, 99, 15873–15878 CrossRef CAS PubMed.
- M. E. Earle, T. Kuhn, A. F. Khalizov and J. J. Sloan, Atmos. Chem. Phys., 2010, 10, 7945–7961 CrossRef CAS.
- S. Jung, M. K. Tiwari, N. V. Doan and D. Poulikakos, Nat. Commun., 2012, 3, 615 CrossRef PubMed.
- P. Guo, Y. M. Zheng, M. X. Wen, C. Song, Y. C. Lin and L. Jiang, Adv. Mater., 2012, 24, 2642–2648 CrossRef CAS PubMed.
- A. Alizadeh, M. Yamada, R. Li, W. Shang, S. Otta, S. Zhong, L. H. Ge, A. Dhinojwala, K. R. Conway, V. Bahadur, A. J. Vinciquerra, B. Stephens and M. L. Blohm, Langmuir, 2012, 28, 3180–3186 CrossRef CAS PubMed.
- G. Chaudhary and R. Li, Exp. Therm. Fluid Sci., 2014, 57, 86–93 CrossRef PubMed.
- S. Jung, M. Dorrestijn, D. Raps, A. Das, C. M. Megaridis and D. Poulikakos, Langmuir, 2011, 27, 3059–3066 CrossRef CAS PubMed.
- S. Suzuki, A. Nakajima, N. Yoshida, M. Sakai, A. Hashimoto, Y. Kameshima and K. Okada, Chem. Phys. Lett., 2007, 445, 37–41 CrossRef CAS PubMed.
- F. Tavakoli, S. Davis and H. P. Kavehpour, J. Coat. Technol. Res., 2015 DOI:10.1007/s11998-015-9693-0.
- C. Gurganus, A. B. Kostinski and R. A. Shaw, J. Phys. Chem. C, 2013, 117, 6195–6200 CAS.
- C. Gurganus, A. B. Kostinski and R. A. Shaw, J. Phys. Chem. Lett., 2011, 2, 1449–1454 CrossRef CAS.
- C. W. Gurganus, J. C. Charnawskas, A. B. Kostinski and R. A. Shaw, Phys. Rev. Lett., 2014, 113, 235701 CrossRef CAS.
- R. Cabriolu and T. Li, Phys. Rev. E: Stat., Nonlinear, Soft Matter Phys., 2015, 91, 052402 CrossRef.
- T. M. Schutzius, S. Jung, T. Maitra, P. Eberle, C. Antonini, C. Stamatopoulos and D. Poulikakos, Langmuir, 2014, 37, 4807–4821 Search PubMed.
- T. S. Li, D. Donadio, G. Russo and G. Galli, Phys. Chem. Chem. Phys., 2011, 13, 19807–19813 RSC.
- L. S. Bartell, Annu. Rev. Phys. Chem., 1998, 49, 43–72 CrossRef CAS PubMed.
Footnote |
| † Electronic supplementary information (ESI) available: Histogram of the icing events on samples with bin width of 0.2 °C. See DOI: 10.1039/c5cp03243a |
|
| This journal is © the Owner Societies 2015 |
Click here to see how this site uses Cookies. View our privacy policy here.  Open Access Article


 the unfrozen icing events. Since the droplet on each sample has different contact area because of the different contact angle and roughness, the area nucleation rate becomes35

![[thin space (1/6-em)]](https://www.rsc.org/images/entities/char_2009.gif) θ = fw
θ = fw![[thin space (1/6-em)]](https://www.rsc.org/images/entities/char_2009.gif) cos
cos![[thin space (1/6-em)]](https://www.rsc.org/images/entities/char_2009.gif) θ*
θ*![[thin space (1/6-em)]](https://www.rsc.org/images/entities/char_2009.gif) ra
ra![[thin space (1/6-em)]](https://www.rsc.org/images/entities/char_2009.gif) θ = fc(cos
θ = fc(cos![[thin space (1/6-em)]](https://www.rsc.org/images/entities/char_2009.gif) θ* + 1) − 1
θ* + 1) − 1


