
 Open Access Article
 This Open Access Article is licensed under a
 Creative Commons Attribution 3.0 Unported Licence
Benchmarking two-photon absorption cross sections: performance of CC2 and CAM-B3LYP
Maarten T. P.
Beerepoot
*a,
Daniel H.
Friese
a,
Nanna H.
List
b,
Jacob
Kongsted
b and
Kenneth
Ruud
a
aCentre for Theoretical and Computational Chemistry, Department of Chemistry, University of Tromsø—The Arctic University of Norway, N-9037 Tromsø, Norway. E-mail: maarten.beerepoot@uit.no; Tel: +47 77623103
bDepartment of Physics, Chemistry and Pharmacy, University of Southern Denmark, DK-5230 Odense M, Denmark
First published on 25th June 2015
Abstract
We investigate the performance of CC2 and TDDFT/CAM-B3LYP for the calculation of two-photon absorption (TPA) strengths and cross sections and contrast our results to a recent coupled cluster equation-of-motion (EOM-EE-CCSD) benchmark study [K. D. Nanda and A. I. Krylov, J. Chem. Phys., 2015, 142, 064118]. In particular, we investigate whether CC2 TPA strengths are significantly overestimated compared to higher-level coupled-cluster calculations for fluorescent protein chromophores. Our conclusion is that CC2 TPA strengths are only slightly overestimated compared to the reference EOM-EE-CCSD results and that previously published overestimated cross sections are a result of inconsistencies in the conversion of the TPA strengths to macroscopic units. TDDFT/CAM-B3LYP TPA strengths, on the other hand, are found to be 1.5 to 3 times smaller than the coupled-cluster reference for the molecular systems considered. The unsatisfactory performance of TDDFT/CAM-B3LYP can be linked to an underestimation of excited-state dipole moments predicted by TDDFT/CAM-B3LYP.
1 Introduction
Two-photon absorption (TPA)—that is, a simultaneous absorption of two photons1—is a non-linear optical process with an intensity depending on the square of the incoming light. Searching for molecules with high TPA cross sections is an active field of research2,3 and the interplay between experiment and theory is paramount for a good understanding of structure–property relations.2,4Quantum chemical calculation of TPA strengths has been implemented at various levels of theory in different software packages and has recently gained significant interest. The implementation in the Dalton software package5 was described by Hättig, Christiansen and Jørgensen6 for coupled-cluster methods and by Sałek et al.7 for time-dependent density functional theory (TDDFT). More recently, Friese, Hättig and Ruud8 implemented TPA based on the resolution-of-identity CC2 (RI-CC2) in a development version of Turbomole,9 thereby enabling the calculation of TPA at the coupled-cluster level for medium-sized molecules. Further, calculation of TPA strengths was implemented in QChem10,11 for the algebraic diagrammatic construction method by Knippenberg et al.12 and very recently for equation-of-motion for excitation energies CCSD (EOM-EE-CCSD) by Nanda and Krylov.13 In addition, Salem and Brown14 have reported TDDFT TPA cross sections calculated in GAMESS.15 All these different implementations span the spectrum from computationally efficient to very accurate, with TDDFT allowing for efficient calculations on large molecules and the coupled-cluster hierarchy of methods allowing for systematic improvement of the accuracy. CC2 and TDDFT have so far been benchmarked against higher-order coupled-cluster methods only for very small organic molecules of up to six atoms.16 Benchmarking CC2 and TDDFT TPA strengths against higher-level methods is important in order to assess the accuracy of these methods in work on larger molecules, for which more accurate calculations are not yet feasible. The largest molecule studied using EOM-EE-CCSD by Nanda and Krylov is 4-(p-hydroxybenzylidene)-1,2-dimethylimidazolin-5-one (HBDI) with 28 atoms.13 CC2 TPA cross sections have been reported for molecular systems of more than twice that size: a truncated molecular tweezer complex consisting of 78 atoms8 and the YFP–Tyr203 dimer with 62 atoms.17 TDDFT TPA cross sections have been reported for molecular systems with more than 100 atoms, such as the fullerene–buckycatcher complex in ref. 18.
Very recently, Nanda and Krylov reported TPA strengths for medium-sized (20 to 28 atoms) neutral fluorescent protein chromophores using the EOM-EE-CCSD method.13 By comparing their calculated cross sections to published CC2 results using the same geometry of the HBI chromophore,14 they noted a strong overestimation (a factor of 4.4) by CC2.13 The suggested explanations for this discrepancy were a strong overestimation of TPA strengths for CC2 or a mistake in the conversion to macroscopic units.13 In addition, a previous study by three of us on CC2 and TDDFT/CAM-B3LYP cross sections on intermolecular charge-transfer excitation in the yellow fluorescent protein also reported CC2 TPA cross sections to be larger than those calculated with TDDFT/CAM-B3LYP.17
The aim of this study is to assess the quality of CC2 and TDDFT/CAM-B3LYP TPA strengths by comparing with the recent benchmark study by Nanda and Krylov13 and to inspect whether CC2 calculations do indeed strongly overestimate the TPA strength. Comparison between different methods are often made on the basis of macroscopic rather than microscopic units, leading to extra challenges and complications for benchmarking work. Therefore we begin in Section 2 by addressing different factors that need to be considered in order to make a correct comparison between TPA cross sections in macroscopic units. Following this, we compare the TPA strengths of a set of fluorescent protein chromophores computed with CC2 and TDDFT/CAM-B3LYP to those obtained with EOM-EE-CCSD13 and previously reported CC214 cross sections, using the same molecular geometries as in the reference works.
2 Conversion to macroscopic units
The macroscopic TPA cross section σTPA in cgs units can be obtained from the rotationally averaged TPA strength 〈δTPA〉 in atomic units using19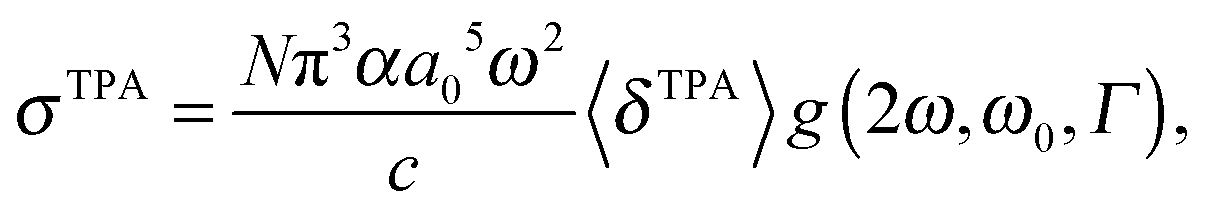 | (1) |
One should be aware that ω in eqn (1) is the photon energy, which in the degenerate TPA case corresponds to half the excitation energy. Defining ω as the excitation energy (2ω) rather than the photon energy (as is done in ref. 14 and 22) results in TPA cross sections higher by a factor of 4.
In the following we will describe the prefactor from the rotational averaging of the TPA strength (Section 2.1), the lineshape function g(2ω, ω0, Γ) (Section 2.2), and the type of experiment that is compared to (Section 2.3) in more detail with particular emphasis on what one needs to be aware of when comparing TPA strengths in macroscopic units.
2.1 The prefactor of the rotational averaging
The rotationally averaged TPA strength 〈δTPA〉 in atomic units can be obtained from the TPA transition moment S as23–25 | (2) |
 | (3) |
![[small mu, Greek, macron]](https://www.rsc.org/images/entities/i_char_e0cd.gif) a = μa − 〈0|μa|0〉, i.e.〈n|a|f〉 is the difference dipole moment between the ground and excited state if n = f27 and a transition dipole moment if n ≠ f.
a = μa − 〈0|μa|0〉, i.e.〈n|a|f〉 is the difference dipole moment between the ground and excited state if n = f27 and a transition dipole moment if n ≠ f.
For linearly polarized light with parallel polarization (F = G = H = 2)23 and two photons of the same energy, eqn (2) reduces to
 | (4) |
 | (5) |
 | (6) |
 | (7) |
2.2 The lineshape function
The lineshape function g(2ω, ω0, Γ) with broadening factor Γ describes broadening effects, correcting for the infinitely sharp calculated vertical excitations and allowing for comparison to experimental peaks, in which rovibrational excitations and collisional dynamics also play a role.26 This is usually done in a phenomenological way by introducing an empirical damping parameter Γ to describe the spectral broadening of an excitation. In many gas-phase calculations, a Lorentzian lineshape function is used for g(2ω, ω0, Γ), | (8) |
 | (9) |
 | (10) |
In solution, a Gaussian lineshape function is most commonly used for g(2ω, ω0, Γ),30
 | (11) |
 | (12) |
 | (13) |
 , see Fig. 1a.
 | ||
| Fig. 1 (a) Lorentzian (eqn (8)) and Gaussian (eqn (11)) broadening functions with HWHM = 0.1, (b) Lorentzian broadening functions with Γ = 0.2 as FWHM and as HWHM and (c) Lorentzian broadening functions with different values of Γ as HWHM. | ||
One should be aware that Γ can also be defined as the full width at half maximum (FWHM) instead of the HWHM (FWHM = 2·HWHM). The use of Γ = 0.2 eV as the FWHM is equivalent to a HWHM of 0.1 eV when one substitutes Γ for Γ/231–34 in eqn (8) or (11). If one uses 0.1 eV as FWHM,35 the resulting TPA cross section σTPA is twice as high compared to work using 0.1 eV as HWHM, see Fig. 1b and eqn (9) and (12). We also point out that the use of eqn (10) with N = 818,36–38 can in principle result from either the use of eqn (1) with N = 8 and Γ defined as the HWHM or with N = 4 and Γ defined as the FWHM.
The broadening effects are different for each excited state,26 which can also be taken into account in theoretical work.30,32,36,39 What is usually done, however, is choosing a single empirical parameter for Γ, often chosen to be 0.1 eV,13,14,18,21,22,28,29,37,38 but also other broadening factors have been used, usually taken from the broadening of a specific peak in an experimental spectrum.2,31,34,35 We note that an alternative approach used for the calculation of TPA strengths is given by damped response theory,40 in which an imaginary factor iγ is added to the optical frequency ω to incorporate broadening effects. In work on damped response theory with the complex polarization propagator such as ref. 40, γ is used for the HWHM and Γ for the FWHM.
One should be cautious when comparing TPA cross sections computed with different broadening factors as they affect also the maximum of the peak, see Fig. 1c. The discussion here makes it sufficiently clear that giving the value of Γ and specifying the type of broadening and whether Γ is HWHM or FWHM is important for the reproducibility of published TPA cross sections.
2.3 Comparison with experiment
The use of different integers N in eqn (1) is among other reasons due to comparison to different experimental setups. When deriving eqn (1), one obtains N = 8.19,21 This corresponds to an experimental setup with two laser sources (a so-called double-beam experiment41), thus in principle allowing for two photons with different energies. The use of N = 8 in eqn (1), however, is not correct when comparing calculated cross sections to the photon dissipation rate in single-beam TPA experiments.30–33,39,42,43 In fact, the photon dissipation rate is in this case twice the calculated two-photon absorption rate because two photons together excite the molecule. Thus, one needs N = 16 in eqn (1) to compare to single-beam experiments.31,33,39,42,43 When two lasers are used as the photon sources—as intended in e.g.ref. 19 and 21—the photon dissipation rate of each of the lasers equals the two-photon absorption rate in the sample.Furthermore, the TPA transition moment (see eqn (3)) can be defined in different ways.31–33,39,41–43 The correct definition of the two-photon transition moment Sif to compare to single-beam experiments (such as the z-scan technique3) is half the one in eqn (3),31–33,39,41–43
 | (14) |
![[S with combining macron]](https://www.rsc.org/images/entities/i_char_0053_0304.gif) —lower by a factor of 4. To correct for this factor of 4 in 〈δTPA〉, a factor of N = 4 (instead of N = 16) in the conversion to macroscopic units has been used in combination with 〈δTPA〉 calculated using S in eqn (3) to obtain a σTPA that can be compared to single-beam experiments.30,32,34 This is the strategy implemented in e.g. the Dalton program,5,44 where S is defined as in eqn (3). The choice of the right value of N in eqn (1) is summarized in Fig. 2.
—lower by a factor of 4. To correct for this factor of 4 in 〈δTPA〉, a factor of N = 4 (instead of N = 16) in the conversion to macroscopic units has been used in combination with 〈δTPA〉 calculated using S in eqn (3) to obtain a σTPA that can be compared to single-beam experiments.30,32,34 This is the strategy implemented in e.g. the Dalton program,5,44 where S is defined as in eqn (3). The choice of the right value of N in eqn (1) is summarized in Fig. 2.
 | ||
| Fig. 2 Schematic overview of the value for N needed in eqn (1). | ||
3 Computational details
We present CC2 and TDDFT/CAM-B3LYP one- and two-photon absorption calculations for the four neutral fluorescent protein chromophores in Fig. 3. The HBI (4-(p-hydroxybenzylidene)imidazolidin-5-one) and HBDI (4-(p-hydroxybenzylidene)-1,2-dimethylimidazolin-5-one) molecules are models for the neutral green fluorescent protein chromophore. The chromophore of the cyan fluorescent protein (CFP) is similar to HBI with an indole ring in place of the phenol ring. The chromophore of the phosphorescent yellow protein (PYP) is p-coumaric acid. The chromophores of fluorescent proteins are frequently studied using TPA both experimentally45,46 and computationally13,14,17,22,37,38,47,48 due to their relevance in biological imaging. | ||
| Fig. 3 Molecular structures of the chromophores used in this study. | ||
All calculations are gas-phase calculations on vertical excitations. Calculations with the approximate coupled-cluster singles and doubles model (CC2)49 were done in Turbomole9 using the resolution-of-identity (RI) approximation.8,50,51 The RI approximation has been shown to give insignificant errors compared to the basis-set error for excitation energies50 and one-photon oscillator strengths.51 1s-orbitals of non-hydrogen atoms were kept frozen in the correlation treatment. TDDFT calculations were done using Dalton5,7,44 with the CAM-B3LYP exchange–correlation functional52 with α = 0.19, β = 0.46 and μ = 0.33. The range-separated functional CAM-B3LYP has an average error that is independent of the degree of charge transfer in the excitations investigated.29,47,53 Furthermore, it yields excitation energies47 and oscillator strengths,54 also considered in this work, in very good agreement with coupled-cluster results for neutral chromophores. It should be noted that the parameters of the functional are optimized using a test set of only neutral chromophores,52 making the transferability to charged systems unknown.
Basis sets from the Pople (6-31+G*)55–57 and Dunning (aug-cc-pVDZ, d-aug-cc-pVDZ and aug-cc-pVTZ)58 families were used to ensure reliable comparison to previous works.13,14 The auxiliary basis sets aug-cc-pVDZ (for molecular basis sets 6-31+G*, aug-cc-pVDZ and d-aug-cc-pVDZ) and aug-cc-pVTZ (for molecular basis set aug-cc-pVTZ) were used for all RI-CC2 calculations.59 To compare to the work of Nanda and Krylov,13 we removed the d-functions from the second set of augmentation functions from the d-aug-cc-pVDZ basis set. We will refer to this modified basis set as mod-d-aug-cc-pVDZ in Section 4.
Molecular structures were taken from reference works to ensure that differences in calculated one-photon and two-photon absorption properties result only from different methods and not from using different molecular geometries. We will therefore only compare our results to other work where exactly the same molecular geometries were used13,14 and not to works where different geometries of the same molecules were studied.22,37,47,48 The geometries of HBI and CFP were taken from Salem and Brown,14 where the geometries were optimized with DFT using the PBE0 exchange–correlation functional and the 6-31+G** basis set. The geometries of HBDI and PYP were taken from Nanda and Krylov,13 where the geometries were optimized with RI-MP2 and the aug-cc-pVDZ and aug-cc-pVTZ basis sets, respectively. All chromophores have Cs symmetry, which was also exploited in the CC2 calculations. We limit our study to the lowest excitation of the chromophores (lowest two excitations for PYP), which is of A′ symmetry and π → π* character. The excitation to the 2A′ state of PYP and the considered excitations in HBI, HBDI and CFP are dominated by the HOMO–LUMO transition with both orbitals involved delocalized over the whole conjugated system of the chromophore. The 1A′ excitation of PYP has contributions from the HOMO and LUMO as well as from an occupied π and a virtual π* orbital that are both located on the phenol ring.
Rotational averaging of the TPA transition moments was done using eqn (4) with Sab defined as in eqn (3). Conversion to GM units was done using eqn (1) with N = 4 and a Lorentzian lineshape function with a HWHM of 0.1 eV was used to ensure comparability to reference work.13 Since we only report cross sections at resonant conditions (ω = ω0/2), the conversion corresponds to eqn (10) with N = 4 and Γ = 0.1 eV.
4 Results
Calculated excitation energies and one- and two-photon absorption properties for the four molecules in Fig. 3 are tabulated in Tables 1–4 (HBI, HBDI, CFP and PYP) together with reference values from the literature.13,14| Method | Basis set | 2ω [a.u.] | ΔE [eV] | f | 〈δTPA〉 [a.u.] | σ TPA [GM] | Ref. |
|---|---|---|---|---|---|---|---|
| EOM-EE-CCSD | mod-d-aug-cc-pVDZ | 14.68 | 13 | ||||
| CC2 | mod-d-aug-cc-pVDZ | 0.1359 | 3.70 | 0.80 | 3345 | 16.75 | |
| CC2 | aug-cc-pVDZ | 0.1359 | 3.70 | 0.80 | 3358 | 16.83 | |
| CAM-B3LYP | aug-cc-pVDZ | 0.1348 | 3.67 | 0.72 | 994 | 4.90 | |
| CC2 | aug-cc-pVTZ | 0.1356 | 3.69 | 0.81 | 3527 | 17.60 | |
| CAM-B3LYP | aug-cc-pVTZ | 0.1348 | 3.67 | 0.72 | 983 | 4.85 | |
| EOM-EE-CCSD | 6-31+G* | 18.3 | 13 | ||||
| CC2 | 6-31+G* | 3.80 | 80 | 14 | |||
| CC2 | 6-31+G* | 0.1399 | 3.81 | 0.85 | 3790 | 20.11 | |
| CAM-B3LYP | 6-31+G* | 0.1368 | 3.72 | 0.75 | 1057 | 5.37 |
| Method | Basis set | 2ω [a.u.] | ΔE [eV] | f | 〈δTPA〉 [a.u.] | σ TPA [GM] | Ref. |
|---|---|---|---|---|---|---|---|
| EOM-EE-CCSD | mod-d-aug-cc-pVDZ | 3.97 | 0.77 | 978 | 5.64 | 13 | |
| CC2 | mod-d-aug-cc-pVDZ | 0.1355 | 3.69 | 0.75 | 1135 | 5.66 | |
| CC2 | aug-cc-pVDZ | 0.1356 | 3.69 | 0.75 | 1136 | 5.67 | |
| CAM-B3LYP | aug-cc-pVDZ | 0.1354 | 3.68 | 0.74 | 490 | 2.44 | |
| CC2 | aug-cc-pVTZ | 0.1353 | 3.68 | 0.76 | 1281 | 6.37 | |
| CAM-B3LYP | aug-cc-pVTZ | 0.1354 | 3.68 | 0.74 | 491 | 2.44 | |
| CAM-B3LYP | 6-31+G* | 0.1372 | 3.73 | 0.77 | 516 | 2.64 |
| Method | Basis set | 2ω [a.u.] | ΔE [eV] | f | 〈δTPA〉 [a.u.] | σ TPA [GM] | Ref. |
|---|---|---|---|---|---|---|---|
| CAM-B3LYP | aug-cc-pVTZ | 0.1287 | 3.50 | 0.61 | 1659 | 7.46 | |
| CC2 | aug-cc-pVDZ | 0.1284 | 3.49 | 0.69 | 5197 | 23.24 | |
| CAM-B3LYP | aug-cc-pVDZ | 0.1287 | 3.50 | 0.61 | 1672 | 7.51 | |
| CC2 | 6-31+G* | 3.58 | 102 | 14 | |||
| CC2 | 6-31+G* | 0.1318 | 3.59 | 0.73 | 5411 | 25.50 | |
| CAM-B3LYP | 6-31+G* | 0.1305 | 3.55 | 0.64 | 1674 | 7.73 |
| Method | Basis set | State | 2ω [a.u.] | ΔE [eV] | f [a.u.] | 〈δTPA〉 [GM] | σ TPA | Ref. |
|---|---|---|---|---|---|---|---|---|
| EOM-EE-CCSD | mod-d-aug-cc-pVDZ | 1A′ | 4.48 | 0.22 | 1224 | 9.02 | 13 | |
| 2A′ | 4.75 | 0.53 | 2631 | 21.47 | 13 | |||
| CC2 | mod-d-aug-cc-pVDZ | 2A′ | 0.1604 | 4.37 | 0.52 | 3281 | 22.91 | |
| 1A′ | 0.1702 | 4.63 | 0.27 | 1646 | 12.94 | |||
| CC2 | aug-cc-pVDZ | 2A′ | 0.1605 | 4.37 | 0.52 | 3278 | 22.91 | |
| 1A′ | 0.1703 | 4.63 | 0.28 | 1645 | 12.93 | |||
| CAM-B3LYP | aug-cc-pVDZ | 2A′ | 0.1582 | 4.31 | 0.65 | 1758 | 11.94 | |
| CC2 | aug-cc-pVTZ | 2A′ | 0.1601 | 4.36 | 0.52 | 3239 | 22.51 | |
| 1A′ | 0.1692 | 4.61 | 0.27 | 1596 | 12.40 | |||
| CAM-B3LYP | aug-cc-pVTZ | 2A′ | 0.1581 | 4.30 | 0.65 | 1706 | 11.57 | |
| CAM-B3LYP | 6-31+G* | 2A′ | 0.1601 | 4.36 | 0.68 | 1953 | 13.57 |
The calculated CC2/6-31+G* TPA cross sections σTPA for HBI (Table 1) and CFP (Table 3) are a factor of 4 lower than the CC2 cross section in ref. 14 using the same molecular geometry. This shows that the conversion factor used here and by Nanda and Krylov13 is different from the one used by Salem and Brown14 by a factor of 4. The overestimation of the TPA cross section of the first A′ state of the HBI chromophore by CC2/6-31+G* in comparison to EOM-EE-CCSD/6-31+G* is thus not a factor of 4.4,13 but a factor of 1.1. We find that CC2 also overestimates EOM-EE-CCSD TPA strengths 〈δTPA〉 with the mod-d-aug-cc-pVDZ basis set by a factor of 1.16 for HBDI and by factors of 1.25 and 1.34 for the 2A′ and 1A′ states in PYP, respectively (see Tables 2 and 4). Differences in excitation energies, oscillator strengths and TPA cross sections between the aug-cc-pVDZ and mod-d-aug-cc-pVDZ basis sets calculated with CC2 are negligible (see Tables 1, 2 and 4).
TDDFT/CAM-B3LYP TPA strengths 〈δTPA〉, on the contrary, are much lower than the coupled-cluster results. The difference depends on the molecule and is for different basis sets a factor of 3.4 to 3.6 for HBI, 2.3 to 2.6 for HBDI, 3.1 to 3.2 for CFP and 1.9 for PYP compared to CC2 calculations. The underestimation of CAM-B3LYP/aug-cc-pVDZ in comparison to EOM-EE-CCSD/d-aug-cc-pVDZ is a factor of 2.00 for HBDI and 1.50 for PYP for 〈δTPA〉 and a factor of 3.00 for HBI for σTPA (for which no 〈δTPA〉 is given in ref. 13). The TDDFT/CAM-B3LYP cross sections are more or less converged when using the aug-cc-pVDZ basis set, as was also shown in a previous study of one- and two-photon properties on the neutral and anionic structures of the GFP chromophore using the crystal structure geometry.37 TPA cross sections are slightly larger with the 6-31+G* basis set, which was previously found to be the case for the neutral but not for the anionic GFP chromophore.37
In contrast to the TPA strengths, the CAM-B3LYP oscillator strengths are in good agreement with the coupled-cluster results with very similar values for HBDI, a slight underestimation for HBI and CFP and a modest overestimation for PYP, none of which exceeds 20%. This is in agreement with a more thorough analysis of Caricato et al., who found that CAM-B3LYP provides the best agreement with EOM-CCSD oscillator strengths among the set of density functionals investigated for 11 small organic neutral molecules.54
5 Discussion
The most important observation from the numerical results presented in the previous section is that CC2 TPA strengths agree well with the benchmark EOM-EE-CCSD results, whereas the TDDFT/CAM-B3LYP TPA strengths are significantly underestimated.In a thorough comparison of TPA strengths of small molecules of up to six atoms by Paterson et al., CC2 was compared to the higher-order methods CCSD and CC3.16 For some of the investigated transitions, CC2 was observed to overestimate CCSD and CC3 TPA strengths, but not by more than a factor of 2. CCSD, on the other hand, was shown on average to overestimate TPA strengths slightly in comparison to CC3.16 Combined with the results presented in this work, this seems to indicate that CC2 performs generally well in the calculation of TPA strengths with the possible exception of specific transitions that require an accurate description of double excitations.
It is interesting to understand whether the underestimation of TDDFT/CAM-B3LYP TPA strengths is specific to the limited number of excitations in the (neutral) molecules investigated here, or more general. While the number of studies reporting TPA cross sections calculated with TDDFT is high, few of them address the accuracy compared to more accurate methods. This is in part related to the lack of efficient publicly available codes to compute coupled-cluster TPA strengths. At least four previous studies have included a comparison of CC2 and TDDFT/CAM-B3LYP TPA strengths. Paterson et al.16 included different density functionals in their comparison to the coupled-cluster hierarchy of methods on small molecules of up to six atoms. They found that CAM-B3LYP generally outperforms LDA, BLYP and B3LYP but overestimates most of the TPA strengths.16 Friese, Ruud and Hättig discuss the agreement between CC2 and TDDFT/CAM-B3LYP mainly in a qualitative way, but report cross sections of CAM-B3LYP/cc-pVDZ both higher and lower than CC2/cc-pVDZ for qualitatively similar electronic transitions.8 In a previous work, three of us have inspected a π-stacking system of an extended anionic HBDI chromophore and a tyrosine residue found in the yellow fluorescent protein.17 CC2/aug-cc-pVDZ TPA cross sections were found to be much higher than CAM-B3LYP/aug-cc-pVDZ cross sections. In particular, the TPA cross section of the π → π* excitation located on the chromophore was lower by a factor of 6.3 for the CAM-B3LYP calculations. Comparing this with the factor of 2.3 in this work (Table 2), we note a significant difference that is presumably due to using the neutral or anionic HBDI chromophore. Salem and Brown14 report CC2/6-31+G* TPA cross sections for the same π → π* transition of five neutral chromophores, including HBI and CFP. Their CAM-B3LYP/6-31+G** gas-phase TPA cross sections (in their ESI) are smaller by a factor of 1.3 for anionic HBI, 3.6 for neutral HBI, 3.3 for CFP and 2.5 and 4.5 for two different protonation states of the chromophore of the blue fluorescent protein. Similar or larger underestimations are reported for the B3LYP and PBE0 exchange–correlation functionals.
The underestimation of CAM-B3LYP TPA strengths can be understood by its underestimation of excited-state dipole moments.60–62 Eriksen et al. found that the ground-state dipole moment of para-nitroaniline is overestimated by CAM-B3LYP, while the excited-state dipole moment of the charge-transfer state is dramatically underestimated, resulting in a much too small difference dipole moment.60 Zaleśny and co-workers found that the problems with excited-state dipole moments are not limited to a specific molecule or a particular functional, but constitute a general problem for TDDFT.61,62 An underestimation of the excited-state dipole moment—combined with accurate or even overestimated ground-state dipole moments—leads to underestimated difference dipole moments.62 The difference dipole moments enter in the expression for the TPA transition moment in eqn (3) through the term 〈n||f〉 with n = f, which is often the dominating term for non-centrosymmetric molecules.63 Thus, underestimated difference dipole moments lead to underestimated TPA strengths. For n ≠ f the element 〈n||f〉 in eqn (3) is a transition dipole moment between two excited states. These elements are likely to be inaccurate for TDDFT as well since they crucially depend on the electron density of the excited states, but they are less studied in the literature. Concluding the discussion of the TDDFT/CAM-B3LYP TPA strengths, we can say that TDDFT/CAM-B3LYP generally seems to underestimate TPA strengths for these molecules with the magnitude varying for different functionals, molecules and protonation states. There seems to be a need for benchmarking TDDFT/CAM-B3LYP TPA strengths of a larger set of medium-sized chromophores—including different protonation states—against a more accurate method such as EOM-EE-CCSD in order to obtain a better estimation of the error inherent to using TDDFT/CAM-B3LYP to calculate the TPA strength.
In this study we have limited the calculations to neutral chromophores of fluorescent proteins that allow for comparison to available benchmark data. We have not tried to reproduce experimental TPA spectra. To do this in a proper way, one should not only take into account the form of the lineshape function for a particular excitation32,36,39 (see Section 2.2) and the type of experiment that it is compared to (see Section 2.3), but also temperature effects,48 non-Condon transitions64 and the environment.37,38 In particular the latter has been shown to affect both experimental45,46 and calculated37,38 TPA cross sections in a profound way. Indeed, it has been shown that different fluorescent proteins with the same chromophore can have maxima in the TPA spectrum that differ by a factor of 5 in intensity.45
The discussion of the conversion factor in Section 2 clearly shows the importance of providing the (correct) details about the conversion used for determining the TPA cross sections from TPA strengths in atomic units. The factor of 4 difference in TPA cross sections between Salem and Brown14 and Nanda and Krylov13 is probably related to the former using excitation energies instead of photon energies for ω. For the sake of reproducibility, a good practice is to provide excitation energies and TPA cross sections in atomic units in addition to macroscopic units, as we have done in Tables 1–4. Not only should the correct formulae for rotational averaging and conversion to GM units be given explicitly and applied consistently, one should also state the type of broadening used and whether the broadening factor Γ is the full or half width at half maximum. When comparing to experiments, one needs to ensure that the right conversion factor is used for the type of experiment employed (see Fig. 2).31–33,42,43 When comparing to experiments that use the relative fluorescence method,4,34,46 one could consider computing the TPA cross section for the reference molecules65 as well and compare the relative cross sections to relative fluorescence intensities from experiment. This approach corrects for systematic errors in the computational and experimental method in much the same way as for chemical shifts in NMR spectroscopy, which can be more reliably compared to experiment than absolute shielding constants.66 In summary, care should be exercised when comparing calculated and experimental TPA cross sections, whereas for comparison between computed results it suffices to use atomic units or to ensure that the same conversion protocol is used as in the reference work.
6 Conclusion
We have compared CC2 and TDDFT/CAM-B3LYP TPA strengths against recent EOM-EE-CCSD benchmark data for a set of neutral fluorescent protein chromophores. This provides a much-needed comparison of two methods that allow TPA calculations on larger (biological) systems (CC2 and TDDFT/CAM-B3LYP) against a higher-order method (EOM-EE-CCSD). We have found that CC2 TPA strengths are in good agreement with the EOM-EE-CCSD cross sections with a small overestimation up to a factor of 1.4 that depends on the molecule. TDDFT/CAM-B3LYP TPA cross sections, however, are underestimated compared to coupled-cluster results by a factor of 1.5 to 3 for this set of molecules, whereas the one-photon oscillator strengths do not deviate by more than 20%. The underestimation of TDDFT/CAM-B3LYP TPA cross sections can be understood in terms of the known underestimation of excited-state dipole moments of TDDFT methods.We have demonstrated how an erroneous assumption on CC2 TPA cross sections was based on a conversion of the TPA strengths to macroscopic units that was different from the one used in the reference work. This stresses the importance of providing all relevant details in the conversion to macroscopic units in computational work on TPA, namely (a) the excitation energy and TPA strength in atomic units, (b) the formulae for both the conversion and the rotational averaging of the transition moments, (c) the proper choice of the conversion for comparison to different types of experiments (see Fig. 2) and (d) the type of lineshape function used, including the broadening factor and whether it corresponds to the full or half width at half maximum.
Acknowledgements
This works has received support from the Research Council of Norway through a Centre of Excellence Grant (Grant No. 179568/V30), from the European Research Council through a Starting Grant (Grant No. 279619) and from the Norwegian Supercomputer Program (Grant No. NN4654K). J. K. thanks the Danish Council for Independent Research (the Sapere Aude programme), the Danish e-Infrastructure Cooperation (DeIC), the Lundbeck and the Villum Foundations for financial support. The authors thank Robert Zaleśny (Wrocław University of Technology, Wroclaw, Poland) for helpful suggestions.References
- M. Göppert-Mayer, Ann. Phys., 1931, 401, 273–294 CrossRef PubMed.
- F. Terenziani, C. Katan, E. Badaeva, S. Tretiak and M. Blanchard-Desce, Adv. Mater., 2008, 20, 4641–4678 CrossRef CAS PubMed.
- M. Pawlicki, H. A. Collins, R. G. Denning and H. L. Anderson, Angew. Chem., Int. Ed., 2009, 48, 3244–3266 CrossRef CAS PubMed.
- M. Albota, D. Beljonne, J.-L. Brédas, J. E. Ehrlich, J.-Y. Fu, A. A. Heikal, S. E. Hess, T. Kogej, M. D. Levin, S. R. Marder, D. McCord-Maughon, J. W. Perry, H. Röckel, M. Rumi, G. Subramaniam, W. W. Webb, X.-L. Wu and C. Xu, Science, 1998, 281, 1653–1656 CrossRef CAS.
- K. Aidas, C. Angeli, K. L. Bak, V. Bakken, R. Bast, L. Boman, O. Christiansen, R. Cimiraglia, S. Coriani, P. Dahle, E. K. Dalskov, U. Ekström, T. Enevoldsen, J. J. Eriksen, P. Ettenhuber, B. Fernández, L. Ferrighi, H. Fliegl, L. Frediani, K. Hald, A. Halkier, C. Hättig, H. Heiberg, T. Helgaker, A. C. Hennum, H. Hettema, E. Hjertenæs, S. Høst, I.-M. Høyvik, M. F. Iozzi, B. Jansík, H. J. Aa. Jensen, D. Jonsson, P. Jørgensen, J. Kauczor, S. Kirpekar, T. Kjærgaard, W. Klopper, S. Knecht, R. Kobayashi, H. Koch, J. Kongsted, A. Krapp, K. Kristensen, A. Ligabue, O. B. Lutnæs, J. I. Melo, K. V. Mikkelsen, R. H. Myhre, C. Neiss, C. B. Nielsen, P. Norman, J. Olsen, J. M. H. Olsen, A. Osted, M. J. Packer, F. Pawlowski, T. B. Pedersen, P. F. Provasi, S. Reine, Z. Rinkevicius, T. A. Ruden, K. Ruud, V. Rybkin, P. Sałek, C. C. M. Samson, A. S. de Merás, T. Saue, S. P. A. Sauer, B. Schimmelpfennig, K. Sneskov, A. H. Steindal, K. O. Sylvester-Hvid, P. R. Taylor, A. M. Teale, E. I. Tellgren, D. P. Tew, A. J. Thorvaldsen, L. Thøgersen, O. Vahtras, M. A. Watson, D. J. D. Wilson, M. Ziolkowski and H. Ågren, Wiley Interdiscip. Rev.: Comput. Mol. Sci., 2014, 4, 269–284 CrossRef CAS PubMed.
- C. Hättig, O. Christiansen and P. Jørgensen, J. Chem. Phys., 1998, 108, 8355–8359 CrossRef PubMed.
- P. Sałek, O. Vahtras, J. Guo, Y. Luo, T. Helgaker and H. Ågren, Chem. Phys. Lett., 2003, 374, 446–452 CrossRef.
- D. H. Friese, C. Hättig and K. Ruud, Phys. Chem. Chem. Phys., 2012, 14, 1175–1184 RSC.
- TURBOMOLE developer's version, a development of University of Karlsruhe and Forschungszentrum Karlsruhe GmbH, 1989–2007, TURBOMOLE GmbH, since 2007, available from http://www.turbomole.com.
- Y. Shao, Z. Gan, E. Epifanovsky, A. T. B. Gilbert, M. Wormit, J. Kussmann, A. W. Lange, A. Behn, J. Deng, X. Feng, D. Ghosh, M. Goldey, P. R. Horn, L. D. Jacobson, I. Kaliman, R. Z. Khaliullin, T. Kuś, A. Landau, J. Liu, E. I. Proynov, Y. M. Rhee, R. M. Richard, M. A. Rohrdanz, R. P. Steele, E. J. Sundstrom, H. L. Woodcock III, P. M. Zimmerman, D. Zuev, B. Albrecht, E. Alguire, B. Austin, G. J. O. Beran, Y. A. Bernard, E. Berquist, K. Brandhorst, K. B. Bravaya, S. T. Brown, D. Casanova, C.-M. Chang, Y. Chen, S. H. Chien, K. D. Closser, D. L. Crittenden, M. Diedenhofen, R. A. DiStasio Jr., H. Do, A. D. Dutoi, R. G. Edgar, S. Fatehi, L. Fusti-Molnar, A. Ghysels, A. Golubeva-Zadorozhnaya, J. Gomes, M. W. D. Hanson-Heine, P. H. P. Harbach, A. W. Hauser, E. G. Hohenstein, Z. C. Holden, T.-C. Jagau, H. Ji, B. Kaduk, K. Khistyaev, J. Kim, J. Kim, R. A. King, P. Klunzinger, D. Kosenkov, T. Kowalczyk, C. M. Krauter, K. U. Lao, A. Laurent, K. V. Lawler, S. V. Levchenko, C. Y. Lin, F. Liu, E. Livshits, R. C. Lochan, A. Luenser, P. Manohar, S. F. Manzer, S.-P. Mao, N. Mardirossian, A. V. Marenich, S. A. Maurer, N. J. Mayhall, C. M. Oana, R. Olivares-Amaya, D. P. O'Neill, J. A. Parkhill, T. M. Perrine, R. Peverati, P. A. Pieniazek, A. Prociuk, D. R. Rehn, E. Rosta, N. J. Russ, N. Sergueev, S. M. Sharada, S. Sharmaa, D. W. Small, A. Sodt, T. Stein, D. Stück, Y.-C. Su, A. J. W. Thom, T. Tsuchimochi, V. Vanovschi, L. Vogt, O. Vydrov, T. Wang, M. A. Watson, J. Wenzel, A. White, C. F. Williams, J. Yang, S. Yeganeh, S. R. Yost, Z.-Q. You, I. Y. Zhang, X. Zhang, Y. Zhou, B. R. Brooks, G. K. L. Chan, D. M. Chipman, C. J. Cramer, W. A. Goddard III, M. S. Gordon, W. J. Hehre, A. Klamt, H. F. Schaefer III, M. W. Schmidt, C. D. Sherrill, D. G. Truhlar, A. Warshel, X. Xu, A. Aspuru-Guzik, R. Baer, A. T. Bell, N. A. Besley, J.-D. Chai, A. Dreuw, B. D. Dunietz, T. R. Furlani, S. R. Gwaltney, C.-P. Hsu, Y. Jung, J. Kong, D. S. Lambrecht, W. Liang, C. Ochsenfeld, V. A. Rassolov, L. V. Slipchenko, J. E. Subotnik, T. Van Voorhis, J. M. Herbert, A. I. Krylov, P. M. W. Gill and M. Head-Gordon, Mol. Phys., 2015, 113, 184–215 CrossRef CAS PubMed.
- A. I. Krylov and P. M. W. Gill, Wiley Interdiscip. Rev.: Comput. Mol. Sci., 2013, 3, 317–326 CrossRef CAS PubMed.
- S. Knippenberg, D. R. Rehn, M. Wormit, J. H. Starcke, I. L. Rusakova, A. B. Trofimov and A. Dreuw, J. Chem. Phys., 2012, 136, 064107 CrossRef CAS PubMed.
- K. D. Nanda and A. I. Krylov, J. Chem. Phys., 2015, 142, 064118 CrossRef PubMed.
- M. A. Salem and A. Brown, J. Chem. Theory Comput., 2014, 10, 3260–3269 CrossRef CAS.
- M. W. Schmidt, K. K. Baldridge, J. A. Boatz, S. T. Elbert, M. S. Gordon, J. H. Jensen, S. Koseki, N. Matsunaga, K. A. Nguyen, S. Su, T. L. Windus, M. Dupuis and J. A. Montgomery Jr., J. Comput. Chem., 1993, 14, 1347–1363 CrossRef CAS PubMed.
- M. J. Paterson, O. Christiansen, F. Pawłowski, P. Jørgensen, C. Hättig, T. Helgaker and P. Sałek, J. Chem. Phys., 2006, 124, 054322 CrossRef PubMed.
- M. T. P. Beerepoot, D. H. Friese and K. Ruud, Phys. Chem. Chem. Phys., 2014, 16, 5958–5964 RSC.
- S. Chakrabarti and K. Ruud, J. Phys. Chem. A, 2009, 113, 5485–5488 CrossRef CAS PubMed.
- W. L. Peticolas, Annu. Rev. Phys. Chem., 1967, 18, 233–260 CrossRef CAS.
- W. M. McClain, Acc. Chem. Res., 1974, 7, 129–135 CrossRef CAS.
- D. H. Friese, M. T. P. Beerepoot, M. Ringholm and K. Ruud, J. Chem. Theory Comput., 2015, 11, 1129–1144 CrossRef CAS PubMed.
- R. Nifosì and Y. Luo, J. Phys. Chem. B, 2007, 111, 14043–14050 CrossRef PubMed.
- P. R. Monson and W. M. McClain, J. Chem. Phys., 1970, 53, 29–37 CrossRef CAS PubMed.
- D. L. Andrews and T. Thirunamachandran, J. Chem. Phys., 1977, 67, 5026–5033 CrossRef CAS PubMed.
- D. H. Friese, M. T. P. Beerepoot and K. Ruud, J. Chem. Phys., 2014, 141, 204103 CrossRef PubMed.
- A. Rizzo, S. Coriani and K. Ruud, Computational Strategies for Spectroscopy. From Small Molecules to Nano Systems, John Wiley and Sons, 2012, pp. 77–135 Search PubMed.
- W. J. Meath and E. A. Power, J. Phys. B: At. Mol. Phys., 1984, 17, 763–781 CrossRef CAS.
- C. L. Devi, K. Yesudas, N. S. Makarov, V. J. Rao, K. Bhanuprakash and J. W. Perry, Dyes Pigm., 2015, 113, 682–691 CrossRef PubMed.
- E. Rudberg, P. Sałek, T. Helgaker and H. Ågren, J. Chem. Phys., 2005, 123, 184108 CrossRef PubMed.
- K. Matczyszyn, J. Olesiak-Banska, K. Nakatani, P. Yu, N. A. Murugan, R. Zaleśny, A. Roztoczyńska, J. Bednarska, W. Bartkowiak, J. Kongsted, H. Ågren and M. Samoć, J. Phys. Chem. B, 2015, 119, 1515–1522 CrossRef CAS PubMed.
- D. L. Silva, P. Krawczyk, W. Bartkowiak and C. R. Mendonça, J. Chem. Phys., 2009, 131, 244516 CrossRef CAS PubMed.
- D. L. Silva, N. A. Murugan, J. Kongsted, Z. Rinkevicius, S. Canuto and H. Ågren, J. Phys. Chem. B, 2012, 116, 8169–8181 CrossRef CAS PubMed.
- D. L. Silva, L. De Boni, D. S. Correa, S. C. S. Costa, A. A. Hidalgo, S. C. Zilio, S. Canuto and C. R. Mendonca, Opt. Mater., 2012, 34, 1013–1018 CrossRef CAS PubMed.
- D. Hršak, L. Holmegaard, A. S. Poulsen, N. H. List, J. Kongsted, M. P. Denofrio, R. Erra-Balsells, F. M. Cabrerizo, O. Christiansen and P. R. Ogilby, Phys. Chem. Chem. Phys., 2015, 17, 12090–12099 RSC.
- M. Guillaume, K. Ruud, A. Rizzo, S. Monti, Z. Lin and X. Xu, J. Phys. Chem. B, 2010, 114, 6500–6512 CrossRef CAS PubMed.
- N. A. Murugan, J. Kongsted, Z. Rinkevicius, K. Aidas, K. V. Mikkelsen and H. Ågren, Phys. Chem. Chem. Phys., 2011, 13, 12506–12516 RSC.
- A. H. Steindal, J. M. H. Olsen, K. Ruud, L. Frediani and J. Kongsted, Phys. Chem. Chem. Phys., 2012, 14, 5440–5451 RSC.
- N. H. List, J. M. H. Olsen, H. J. Aa. Jensen, A. H. Steindal and J. Kongsted, J. Phys. Chem. Lett., 2012, 3, 3513–3521 CrossRef CAS.
- M. G. Vivas, D. L. Silva, L. de Boni, R. Zalesny, W. Bartkowiak and C. R. Mendonca, J. Appl. Phys., 2011, 109, 103529 CrossRef PubMed.
- K. Kristensen, J. Kauczor, A. J. Thorvaldsen, P. Jørgensen, T. Kjærgaard and A. Rizzo, J. Chem. Phys., 2011, 134, 214104 CrossRef PubMed.
- D. P. Craig and T. Thirunamachandran, Molecular Quantum Electrodynamics, Dover, New York, 1998 Search PubMed.
- K. Ohta and K. Kamada, J. Chem. Phys., 2006, 124, 124303 CrossRef PubMed.
- K. Ohta, L. Antonov, S. Yamada and K. Kamada, J. Chem. Phys., 2007, 127, 84504 CrossRef PubMed.
- Dalton, a molecular electronic structure program, Release DALTON2013.0, 2013, see http://daltonprogram.org/.
- M. Drobizhev, S. Tillo, N. S. Makarov, T. E. Hughes and A. Rebane, J. Phys. Chem. B, 2009, 113, 855–859 CrossRef CAS PubMed.
- M. Drobizhev, N. S. Makarov, S. E. Tillo, T. E. Hughes and A. Rebane, Nat. Methods, 2011, 8, 393–399 CrossRef CAS PubMed.
- N. H. List, J. M. Olsen, T. Rocha-Rinza, O. Christiansen and J. Kongsted, Int. J. Quantum Chem., 2012, 112, 789–800 CrossRef CAS PubMed.
- M. T. P. Beerepoot, A. H. Steindal, J. Kongsted, B. O. Brandsdal, L. Frediani, K. Ruud and J. M. H. Olsen, Phys. Chem. Chem. Phys., 2013, 15, 4735–4743 RSC.
- O. Christiansen, H. Koch and P. Jørgensen, Chem. Phys. Lett., 1995, 243, 409–418 CrossRef CAS.
- C. Hättig and F. Weigend, J. Chem. Phys., 2000, 113, 5154–5161 CrossRef PubMed.
- C. Hättig and A. Köhn, J. Chem. Phys., 2002, 117, 6939–6951 CrossRef PubMed.
- T. Yanai, D. P. Tew and N. C. Handy, Chem. Phys. Lett., 2004, 393, 51–57 CrossRef CAS PubMed.
- M. J. G. Peach, P. Benfield, T. Helgaker and D. J. Tozer, J. Chem. Phys., 2008, 128, 044118 CrossRef PubMed.
- M. Caricato, G. W. Trucks, M. J. Frisch and K. B. Wiberg, J. Chem. Theory Comput., 2011, 7, 456–466 CrossRef CAS.
- W. J. Hehre, R. Ditchfield and J. A. Pople, J. Chem. Phys., 1972, 56, 2257–2261 CrossRef CAS PubMed.
- T. Clark, J. Chandrasekhar, G. W. Spitznagel and P. Von Ragué Schleyer, J. Comput. Chem., 1983, 4, 294–301 CrossRef CAS PubMed.
- P. C. Hariharan and J. A. Pople, Theor. Chim. Acta, 1973, 28, 213–222 CrossRef CAS.
- T. H. Dunning, J. Chem. Phys., 1989, 90, 1007–1023 CrossRef CAS PubMed.
- F. Weigend, A. Köhn and C. Hättig, J. Chem. Phys., 2002, 116, 3175–3183 CrossRef CAS PubMed.
- J. J. Eriksen, S. P. A. Sauer, K. V. Mikkelsen, O. Christiansen, H. J. A. Jensen and J. Kongsted, Mol. Phys., 2013, 111, 1235–1248 CrossRef CAS PubMed.
- J. Bednarska, A. Roztoczyńska, W. Bartkowiak and R. Zaleśny, Chem. Phys. Lett., 2013, 584, 58–62 CrossRef CAS PubMed.
- R. Zaleśny, G. Tian, C. Hättig, W. Bartkowiak and H. Ågren, J. Comput. Chem., 2015, 36, 1124–1131 CrossRef PubMed.
- P. Cronstrand, Y. Luo, P. Norman and H. Ågren, Chem. Phys. Lett., 2003, 375, 233–239 CrossRef CAS.
- E. Kamarchik and A. I. Krylov, J. Phys. Chem. Lett., 2011, 2, 488–492 CrossRef CAS.
- N. S. Makarov, M. Drobizhev and A. Rebane, Opt. Express, 2008, 16, 4029–4047 CrossRef CAS.
- T. Helgaker, M. Jaszuński and K. Ruud, Chem. Rev., 1999, 99, 293–352 CrossRef CAS PubMed.
| This journal is © the Owner Societies 2015 |