
 Open Access Article
 This Open Access Article is licensed under a
 Creative Commons Attribution 3.0 Unported Licence
Vibrational lifetimes and friction in adsorbate motion determined from quasi-elastic scattering
Barbara A. J.
Lechner†
*a,
Holly
Hedgeland‡
a,
Andrew P.
Jardine
a,
William
Allison
a,
B. J.
Hinch
b and
John
Ellis
a
aCavendish Laboratory, University of Cambridge, JJ Thomson Avenue, Cambridge, CB3 0HE, UK. E-mail: bajl2@cam.ac.uk
bDepartment of Chemistry and Chemical Biology, Rutgers University, Piscataway, New Jersey 08854, USA
First published on 15th July 2015
Abstract
The vibrational excitation of molecules adsorbed on a surface is typically probed by spectroscopic techniques such as infrared or Raman spectroscopy. In the present article we demonstrate an alternative method to determine vibrational lifetimes of adsorbate molecules using quasi-elastic helium atom scattering (QHAS). As a probe of diffusive motion of molecules on surfaces QHAS is well established. Here, we demonstrate that QHAS can also be used to probe the vibrational lifetime of a molecule in its adsorption well. Measurements of cyclopentadienyl, C5H5, on Cu(111) allow us to distinguish two substrate phonon modes as well as two molecular vibrational modes, perpendicular and parallel to the surface. We further find that the dephasing of the vibrational motion corresponds to the friction determined in previous diffusion measurements.
1 Introduction
Dynamical phenomena at the atomic scale influence and control a wide range of processes occurring on surfaces of solids.1–3 A fundamental understanding of the forces guiding surface motion is thus of utmost importance for the advancement of many fields of science and technology. The microelectronics industry, for example, uses the forces between particles to pattern surfaces in a bottom-up approach,4 while the chemical industry aims to optimise catalysts to bond the reactants strongly yet allow them to be mobile so they can undergo a reaction on the surface.5 Surface dynamic processes occur on a vast range of length- and timescales and can be divided into two main categories: surface diffusion and vibrational motion. Diffusive motion can be measured by recording consecutive snapshots of a surface using scanning probe techniques or by measuring surface correlations with quasi-elastic scattering, to name but two approaches. Vibrational motion, on the other hand, is typically measured by spectroscopic techniques such as infrared and Raman spectroscopy or inelastic scattering. Here, we demonstrate how quasi-elastic helium atom scattering (QHAS) can probe the vibrational lifetimes of adsorbates in addition to their diffusive motion.Helium atom scattering (HAS) is a non-destructive, extremely surface sensitive technique thanks to the inert helium atom probe and low beam energies.6 Traditionally, HAS provides an energy spectrum where inelastic scattering results in peaks due to the vibrational motion of a surface system while diffusive motion causes a broadening of the quasi-elastic peak. Helium spin-echo (HeSE) is a subset of quasi-elastic helium atom scattering which utilises the nuclear spin of a helium-3 atom as an internal timer to measure correlation on the surface.7,8 A HeSE experiment operates in the time domain and provides a measure of the intermediate scattering function (ISF). In contrast, traditional time-of-flight instruments operate in the energy domain and measure the dynamical structure factor. HeSE data is thus related to an energy spectrum by a temporal Fourier transform.
To date, HeSE has been applied to a range of adsorbate systems, measuring adsorbate diffusion8–11 and substrate phonons.12,13 Here, we present the first HeSE investigation of the vibrational lifetimes of a molecule in an adsorption well. We use the model system cyclopentadienyl (Cp), C5H5, on Cu(111) to demonstrate the method, studying its vibrational lifetimes and the associated friction. This system is ideally suited to such a study as we can observe different modes of motion simultaneously without the added complication of strong lateral interactions which would alter the experimental lineshapes14,15 whilst the molecule is also heavy enough that we expect its behaviour to be predominantly classical. In addition, the diffusive motion of Cp/Cu(111) is well understood thanks to our previous experiments,16,17 allowing us to check for consistency within the measurements.
2 Experiment
In a HeSE experiment, a magnetic field splits a polarised He beam into two spin components which scatter off the sample consecutively, are recombined after scattering and spin-analysed to provide a polarisation measurement as the beam enters the detector. The result is a measure of the coherence of the two spin components. When scattered off a static surface, the entire scattered beam passes through the analyser; in the case of a dynamic surface, on the other hand, the two components do not scatter identically and thus do not recombine to give the same final spin-state, resulting in a loss of polarisation or, proportionally, measured helium intensity. Periodic motion such as surface phonons or molecular vibrations results in a periodic variation of the intensity whilst aperiodic processes such as jump diffusion exhibit a decay with time. By measuring at different momentum transfer values, ΔK, and along several azimuthal directions we get a full picture of the two-dimensional surface motion. HeSE measures dynamics under equilibrium conditions and a typical spectrum takes on the order of a few minutes to record. To improve the signal to noise ratio, we averaged over several consecutive curves at each measurement condition. The signal intensity drops at larger momentum transfer values, necessitating longer measurement times.We mounted a Cu(111) single crystal (Surface Preparation Laboratory, Netherlands) in an ultra-high vacuum chamber with a base pressure of 3 × 10⁻¹¹ mbar and cleaned it by argon ion sputtering (800 eV, 10 μA, 10 min, 300 K) and annealing to 800 K. The specular helium reflectivity used as a measure of the cleanliness of the crystal surface was ≥25%. We aligned the crystal azimuthally using the known diffraction pattern of a CO overlayer.11 Cyclopentadiene was obtained from distillation of its stable dimer, stored in liquid nitrogen to avoid spontaneous dimerisation and dosed by backfilling the chamber with its vapour pressure, resulting in dissociative adsorption of cyclopentadienyl.18 The intensity of the specular beam was used to monitor for contamination of the system and establish an acceptable measurement duration. All HeSE experiments were performed using an incident helium beam energy between 7.5 meV and 8.1 meV and at a temperature of 300 K.
3 Results and analysis
We have previously studied the diffusion of Cp on Cu(111) using HeSE and interpreted the data with the help of classical molecular dynamics (MD) simulations.16 The data was simulated with Langevin dynamics in a two-dimensional adsorbate–substrate potential and included pairwise inter-adsorbate interactions. By varying the parameters to match the experimental observations, we could thus determine the potential energy surface (PES), lateral adsorbate interactions and the Langevin friction parameter, η, for diffusion. In the analysis, we used data in the long-time limit to deduce the diffusive behaviour. We found that Cp moves predominantly in single jumps between adjacent hcp and fcc hollow sites over an energy barrier of 40 ± 3 meV.16 Despite their anionic nature, the molecules exhibit exceptionally weak lateral interactions. In addition, a strong frictional coupling to the substrate with η = 2.5 ± 0.5 ps−1 was observed.19To illustrate that further information can be obtained from the technique, we show, in Fig. 1, some typical HeSE curves for Cp/Cu(111) at 300 K, for two values of momentum transfer along both high-symmetry directions. Experimental data are plotted as blue points, as a function of spin-echo time. The polarisation is directly related to the intermediate scattering function8 and it is an indication of the correlation on the surface as a function of time; for aperiodic motion the correlation decays monotonically with time while periodic vibrational motion appears as an oscillatory feature. The data in Fig. 1 are plotted with a logarithmic time axis so that the different timescales of the processes are clearly visible. Four distinct signatures can be identified in the polarisation curves for Cp/Cu(111): (1) in all panels, there is decay in the polarisation evident in the long-time limit (solid black line). The decay arises from jump diffusion between preferred adsorption sites and can be analysed by exponential decays, as described in detail in ref. 16 and 17. Green data points show the residual after subtracting the exponentials from the polarisation measurements, revealing additional features. (2) At small values of ΔK (left-hand panels) periodic oscillations can be seen at small times (dashed green and blue lines). (3) At small times and larger ΔK (right-hand panels) a fast monotonic decay can be seen (dotted red lines). (4) A constant offset from zero to which the decay levels off to is typically due to scattering from static defects on the surface8 and its variation with momentum transfer is a diffraction pattern. In the present paper, we focus on the features at small timescales, i.e. the periodic oscillations and the fast decay.
 | ||
| Fig. 1 Polarisation measurements as a function of spin-echo time for 0.03 ML Cp/Cu(111). The left-hand panels show data at 0.4 Å−1 and the right-hand panels at 1.9 Å−1, each measured along the two high-symmetry directions. Experimental data are plotted as blue points. In all spectra, jump diffusion is evident as a decay in polarisation, described by solid black lines. The residual after subtracting the exponential from the data is shown as green points. The grey dash-dotted curves in the bottom right panel illustrate the two exponents composing the black line in that panel, as described in ref. 16. In the left-hand panels, periodic oscillations are evident at small times, illustrated by the blue and green dashed lines connecting the data points. In the right-hand panels, a fast decay at small times becomes apparent, marked by red dashed lines. To illustrate the different processes occurring on a range of timescales, the polarisation curves are presented on a logarithmic time axis. | ||
4 Measuring phonons and molecular vibrations
The oscillatory features apparent at small momentum transfer values (ΔK ≤ 1.2 Å−1) indicate the presence of vibrational motion. To separate all frequencies present and identify these vibrations, we Fourier transformed the spectra into energy space.11,12 Two typical energy spectra are shown in Fig. 2, exhibiting a large elastic peak and several additional peaks in the energy loss and energy gain domains. We studied the variation of the peak positions with ΔK to obtain the dispersion curves for the different modes, shown in Fig. 3. Four vibrational modes are observed in the Cp/Cu(111) spectra, which can be assigned as described below.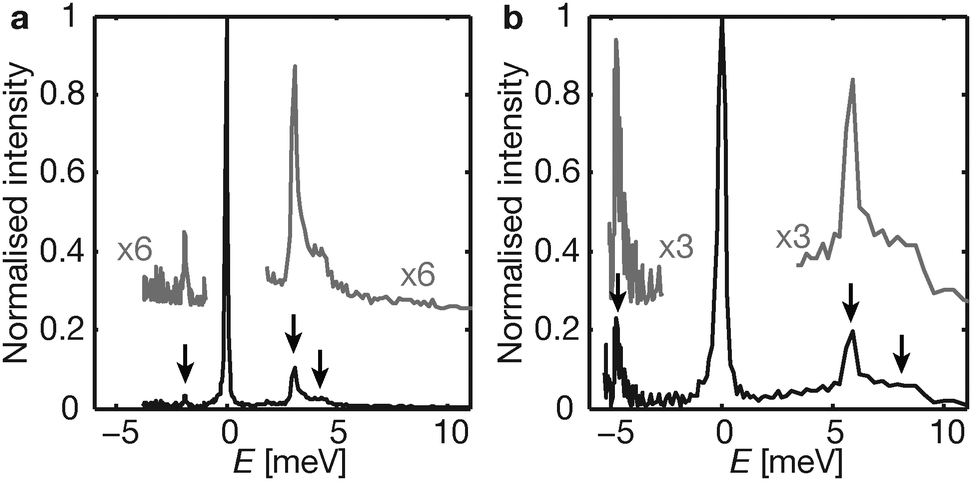 | ||
Fig. 2 Spectra in the energy domain, obtained by Fourier transforming the polarisation measurements for Cp/Cu(111), exhibit several inelastic peaks (marked by arrows). Measurements along the 〈11![[2 with combining macron]](https://www.rsc.org/images/entities/char_0032_0304.gif) 〉 direction at angles corresponding to a momentum transfer of (a) 0.4 Å−1 and (b) 0.7 Å−1 for elastic scattering (ΔE = 0) show an energy loss peak from molecular vibrations at −1.9 meV and −4.6 meV, respectively. In addition, two energy gain peaks due to substrate phonons can be seen in both spectra. 〉 direction at angles corresponding to a momentum transfer of (a) 0.4 Å−1 and (b) 0.7 Å−1 for elastic scattering (ΔE = 0) show an energy loss peak from molecular vibrations at −1.9 meV and −4.6 meV, respectively. In addition, two energy gain peaks due to substrate phonons can be seen in both spectra. | ||
 | ||
| Fig. 3 The dispersion curves for Cp/Cu(111) at 300 K show four distinct vibrational modes. Two dispersive modes, shown as crosses, are substrate phonons, as identified by Harten et al. for clean Cu(111) (lines).20 The small shift in energy between the new data and the results of ref. 20 can be attributed to an increased effective mass of the substrate atoms upon Cp adsorption. Kinks in the higher energy mode, marked with arrows, are evident in both crystal directions. They occur at energies that are resonant with Cp vibrations. Two additional non-dispersive modes, which are only weakly apparent in the experiment, are presented as circles. We identify the non-dispersive modes at −1.9 meV and −4.6 meV as molecular vibrational modes perpendicular and parallel to the surface, respectively. | ||
The highest intensity peaks in Fig. 2 are two energy gain peaks, which we can identify as two dispersive modes in Fig. 3. Helium atom scattering measurements of a clean Cu(111) surface showed two dispersive phonon modes20 which were later confirmed in an electron energy loss spectroscopy (EELS) study.21 Comparing the strong dispersive modes in the Cp/Cu(111) data with the published phonon modes of clean Cu(111),20 shown as lines in Fig. 3, the oscillations in the ISFs can be attributed primarily to substrate phonons. A small shift to lower energies is observed, indicating an increased effective mass of the copper atoms upon Cp adsorption, thus decreasing the vibrational frequency. The higher energy dispersion curve exhibits two kinks (cf. arrows in Fig. 3) along both azimuths, which are most likely caused by resonances of the substrate phonon with Cp vibrational modes.
In addition, the spectra in Fig. 2 each show a weaker peak, at −1.9 meV and −4.6 meV, respectively. By studying their momentum transfer dependence, we find that these two peaks are non-dispersive modes, shown as circles in Fig. 3. The mode at −1.9 meV is suggestive of a frustrated translation of the Cp normal to the surface, reminiscent of those reported in ref. 22, as it is only apparent at low values of momentum transfer. Of greater interest here, the energy loss mode at approximately −4.6 meV is at the same location as the first kink in the higher energy dispersion curve, and agrees well with the energy for the Cp T-mode (horizontal vibrational mode) estimated below. The width of the peak is also consistent with such an assignment.
5 Vibrational lifetimes and friction
In the polarisation measurements in Fig. 1, a fast decay becomes apparent at larger momentum transfer values. We argue below that this decay results from the dephasing of Cp as it vibrates within its adsorption well between the hops. Dephasing occurs typically on faster timescales than jump diffusion. The contribution of vibrational lifetimes to quasi-elastic broadening has recently been noted theoretically23 and the momentum transfer dependence of the dephasing rate of vibrations within an adsorption well has been predicted using molecular dynamics (MD) simulations.24 We note that whilst the lineshape of the broadening has also been the subject of some discussion in theory,25–27 we are not in a position to determine the functional form of the lineshape from the present experiment and we concentrate instead on the simpler task of determining the full width at half maximum (FWHM) of the contribution from vibrational dephasing.We analyse the data using an exponential function to describe the fast decay and thus extract the width of its contribution to the quasi-elastic peak. The results are shown in Fig. 4, which gives the dependence of the width of the quasi-elastic peak on momentum transfer. The fast decay signature loses intensity at small values of ΔK, and eventually drops to zero. Therefore, only data at ΔK > 1.2 Å−1 are used, where reliable information can be extracted. The signal intensity of the fast decay is reflected in the size of the error bars, which runs counter the effect of a decrease in overall intensity at high momentum transfer, such that the FWHM has the smallest error in the middle of the momentum transfer range. The trend of the experimental peak width is indicated by the dashed line in Fig. 4 and there is a clear change from the linear slope, seen at large ΔK to a region with no ΔK dependence, at lower values of ΔK, leading to a non-zero intercept of 3.4 meV. The deviation from linear behaviour together with the decrease in the magnitude of the feature at small ΔK, are exactly as predicted by previous numerical simulations for a harmonic oscillator coupled to a heat bath.24 We therefore attribute the broadening to a vibrational lifetime that is manifest in the quasi-elastic signal. The numerical value of the intercept corresponds to dephasing resulting in a vibrational lifetime of 2.6 ps−1. Interestingly, the lifetime is the same as that deduced from an earlier analysis of the diffusional friction coefficient, η = 2.5 ± 0.5 ps−1.16 Within a simple Langevin description of dynamics, dephasing of the vibration through coupling to the heat-bath of the substrate leads to a lifetime that is the same as that controlling the diffusion rate. The present system is, evidently, one that follows that rule. However, there is no reason to believe that such a rule is universal, since the coupling of different vibrational modes to the heat-bath could vary and be different to that for centre-of-mass motion. Indeed, a counter example was reported in the case of CO on Cu(001),28 where the number of multiple jumps indicated the Langevin η for diffusion was much less than the measured lifetime of vibrations.
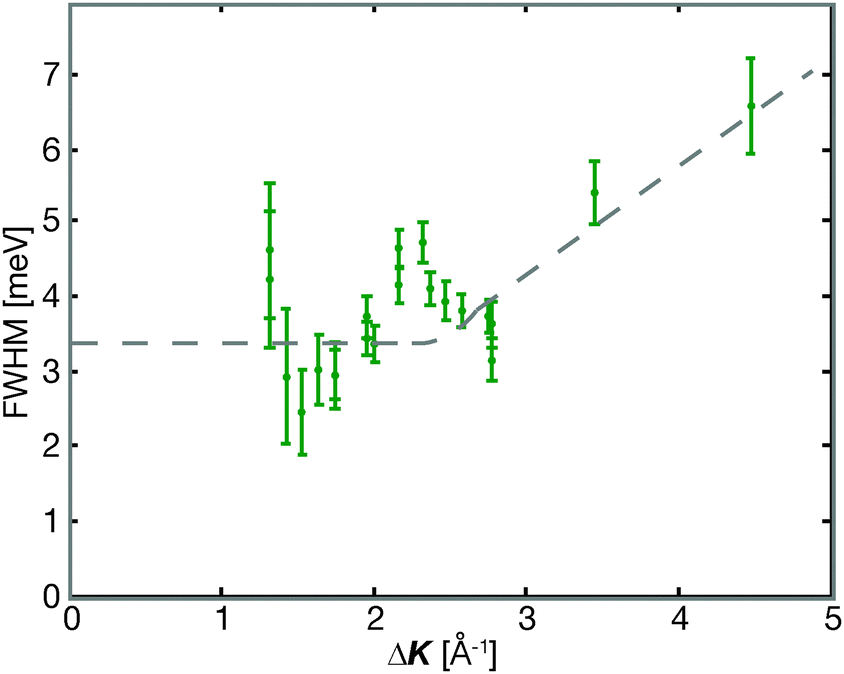 | ||
| Fig. 4 The momentum transfer dependence of the FWHM of the vibrational dephasing of Cp/Cu(111) at 300 K. A dashed line is drawn on the data to illustrate schematically the shape predicted in ref. 24. | ||
The overall shape of the curve in Fig. 4 agrees well with the prediction from numerical simulations in ref. 24. We can understand the ΔK dependence in Fig. 4 and identify the relevant vibrational mode by considering scattering from a particle vibrating in the adsorption well. In Fig. 4, the transition from a constant to a linearly increasing FWHM occurs roughly when the scattering phase reaches Φ = ΔK·R = π/4, where R is the mean displacement of the adsorbate within the adsorption well.24 For Cp/Cu(111) the take-off point is at ΔK ≈ 2.5 ± 0.4 Å−1, which corresponds to a spring constant of k = 4.2 ± 1.4 N m−1 through the relationship E = ½kBT = ½kR2, where kB is the Boltzmann constant and T the sample temperature (here 300 K). The value we determine is close to that of the frustrated translation of the whole molecule. The latter quantity can be estimated from the potential energy surface (PES) that determines the diffusive motion of Cp/Cu(111), which has been determined using a Langevin simulation.16 The PES, shown in Fig. 5, was created by describing the potential energy landscape with a Fourier series11,29 and optimised to describe the experimental data. From the curvature of the adsorption well, shown in the right-hand panel of Fig. 5, a spring constant of k = 5.3 ± 0.1 N m−1 is found, in good agreement with the estimate given earlier.
 | ||
Fig. 5 PES for hopping on a lattice of hollow sites used to simulate the diffusive motion of Cp/Cu(111) in ref. 16. The left-hand panel shows a top view of the PES, while the right-hand panel represents a cross section from top (T) to hollow (H) and bridge (B) site along 〈11〉 and from bridge to top site along 〈1![[1 with combining macron]](https://www.rsc.org/images/entities/char_0031_0304.gif) 0〉. 0〉. | ||
A spring constant of k = 5.3 ± 0.1 N m−1, corresponds to a vibrational energy, for Cp, of 4.6 ± 0.1 meV. The value is consistent with the −4.6 meV non-dispersive mode of Cp/Cu(111) observed in Fig. 3. The −4.6 meV mode can therefore be attributed to a translational mode (T-mode) of Cp.
6 Conclusions
In conclusion, we have presented the first QHAS determination of vibrational lifetimes of an extended molecular adsorbate. HeSE measurements of the vibrations of cyclopentadienyl, C5H5, on Cu(111) allowed us to determine the vibrational dephasing rate and spring constant and compare them to previous measurements of the molecule's diffusion. The observation demonstrates that, under favourable circumstances, QHAS techniques such as HeSE are capable of probing both the diffusional and vibrational motion of an adsorbate simultaneously. Our findings give a comprehensive picture of the Cp/Cu(111) adsorbate system, describing substrate phonons and molecular T-mode vibrations in addition to the previously determined diffusive motion. In the case of Cp/Cu(111), we found that the vibrational lifetimes are caused by the dephasing of harmonic oscillations in an adsorption well and thus correspond to the diffusional friction coefficient. Finally, the present work demonstrates that HeSE measurements are self-consistent across all length- and timescales measured.Acknowledgements
Financial support by the EPSRC (EP/E0049621), the Austrian Academy of Sciences (BAJL), the Royal Society (APJ) and the US National Science Foundation (CHE1124879, BJH) is gratefully acknowledged.References
- R. Gomer, Rep. Prog. Phys., 1990, 53, 917–1002 CrossRef CAS.
- J. V. Barth, Surf. Sci. Rep., 2000, 40, 75–149 CrossRef CAS.
- T. Ala-Nissila, R. Ferrando and S. C. Ying, Adv. Phys., 2002, 51, 949–1078 CrossRef CAS PubMed.
- J. V. Barth, G. Costantini and K. Kern, Nature, 2005, 437, 671–679 CrossRef CAS PubMed.
- G. A. Somorjai and Y. Li, Introduction to surface chemistry and catalysis, John Wiley & Sons, 2010 Search PubMed.
- A. P. Jardine, J. Ellis and W. Allison, J. Phys.: Condens. Matter, 2002, 14, 6173–6191 CrossRef CAS.
- A. P. Jardine, S. Dworski, P. Fouquet, G. Alexandrowicz, D. J. Riley, G. Y. H. Lee, J. Ellis and W. Allison, Science, 2004, 304, 1790–1793 CrossRef CAS PubMed.
- A. P. Jardine, H. Hedgeland, G. Alexandrowicz, W. Allison and J. Ellis, Prog. Surf. Sci., 2009, 84, 323 CrossRef CAS PubMed.
- B. A. J. Lechner, H. Hedgeland, J. Ellis, W. Allison, M. Sacchi, S. J. Jenkins and B. J. Hinch, Angew. Chem., Int. Ed., 2013, 52, 5085–5088 CrossRef CAS PubMed.
- B. A. J. Lechner, M. Sacchi, A. P. Jardine, H. Hedgeland, W. Allison, J. Ellis, S. J. Jenkins, P. C. Dastoor and B. J. Hinch, J. Phys. Chem. Lett., 2013, 4, 1953–1958 CrossRef CAS.
- P. R. Kole, H. Hedgeland, A. P. Jardine, W. Allison, J. Ellis and G. Alexandrowicz, J. Phys.: Condens. Matter, 2012, 24, 104016 CrossRef PubMed.
- P. R. Kole, A. P. Jardine, H. Hedgeland and G. Alexandrowicz, J. Phys.: Condens. Matter, 2010, 22, 304018 CrossRef CAS PubMed.
- E. M. McIntosh, P. R. Kole, M. El-Batanouny, D. M. Chisnall, J. Ellis and W. Allison, Phys. Rev. Lett., 2013, 110, 086103 CrossRef CAS.
- R. Martínez-Casado, J. L. Vega, A. S. Sanz and S. Miret-Artés, J. Phys.: Condens. Matter, 2007, 19, 176006 CrossRef PubMed.
- B. A. J. Lechner, Studying Complex Surface Dynamical Systems Using Helium-3 Spin-Echo Spectroscopy, Springer, 2014 Search PubMed.
- H. Hedgeland, B. A. J. Lechner, F. E. Tuddenham, A. P. Jardine, W. Allison, J. Ellis, M. Sacchi, S. J. Jenkins and B. J. Hinch, Phys. Rev. Lett., 2011, 106, 186101 CrossRef CAS.
- B. A. J. Lechner, P. R. Kole, H. Hedgeland, A. P. Jardine, W. Allison, B. J. Hinch and J. Ellis, Phys. Rev. B, 2014, 89, 121405 CrossRef.
- C.-H. Sun, B. E. Bent and J. G. Chen, J. Vac. Sci. Technol., A, 1997, 15, 1581 Search PubMed.
- B. A. J. Lechner, A. S. de Wijn, H. Hedgeland, A. P. Jardine, B. J. Hinch, W. Allison and J. Ellis, J. Chem. Phys., 2013, 138, 194710 CrossRef CAS PubMed.
- U. Harten, J. P. Toennies and Ch. Wöll, Faraday Discuss. Chem. Soc., 1985, 80, 137 RSC.
- M. H. Mohamed, L. L. Kesmodel, B. M. Hall and D. L. Mills, Phys. Rev. B, 1988, 37, 2763 CrossRef CAS.
- G. Witte and Ch. Wöll, J. Chem. Phys., 1995, 103, 5860 CrossRef CAS PubMed.
- T. Firmino, R. Marquardt, F. Gatti and W. Dong, J. Phys. Chem. Lett., 2014, 5, 4270 CrossRef CAS.
- A. P. Jardine, J. Ellis and W. Allison, J. Chem. Phys., 2004, 120, 8724 CrossRef CAS PubMed.
- S. Miret-Artés and E. Pollak, J. Phys.: Condens. Matter, 2005, 17, S4133–S4150 CrossRef.
- R. Martínez-Casado, J. L. Vega, A. S. Sanz and S. Miret-Artés, Phys. Rev. Lett., 2007, 98, 216102 CrossRef.
- R. Martínez-Casado, A. S. Sanz, J. L. Vega, G. Rojas-Lorenzo and S. Miret-Artés, Chem. Phys., 2010, 370, 180–193 CrossRef PubMed.
- G. Alexandrowicz, A. P. Jardine, P. Fouquet, S. Dworski, W. Allison and J. Ellis, Phys. Rev. Lett., 2004, 93, 156103 CrossRef CAS.
- G. Alexandrowicz, P. R. Kole, E. Y. M. Lee, H. Hedgeland, R. Ferrando, A. P. Jardine, W. Allison and J. Ellis, J. Am. Chem. Soc., 2008, 130, 6789–6794 CrossRef CAS PubMed.
Footnotes |
| † Present address: Materials Sciences Division, Lawrence Berkeley National Laboratory, Berkeley, California 94720, USA. |
| ‡ Present address: London Centre for Nanotechnology, University College London, London, WC1H 0AH, UK. |
| This journal is © the Owner Societies 2015 |