
 Open Access Article
 This Open Access Article is licensed under a
 Creative Commons Attribution 3.0 Unported Licence
The Raman optical activity of β-D-xylose: where experiment and computation meet†
François
Zielinski
a,
Shaun T.
Mutter
a,
Christian
Johannessen
b,
Ewan W.
Blanch
*c and
Paul L. A.
Popelier
*a
aManchester Institute of Biotechnology and School of Chemistry, University of Manchester, 131 Princess Street, Manchester, M1 7DN, UK. E-mail: pla@manchester.ac.uk
bDepartment of Chemistry, University of Antwerp, Groenenborgerlaan 171, 2020 Antwerp, Belgium
cSchool of Applied Sciences, RMIT University, GPO Box 2476, Melbourne, VIC 3001, Australia. E-mail: ewan.blanch@rmit.edu.au
First published on 23rd June 2015
Abstract
Besides its applications in bioenergy and biosynthesis, β-D-xylose is a very simple monosaccharide that exhibits relatively high rigidity. As such, it provides the best basis to study the impact of different solvation shell radii on the computation of its Raman optical activity (ROA) spectrum. Indeed, this chiroptical spectroscopic technique provides exquisite sensitivity to stereochemistry, and benefits much from theoretical support for interpretation. Our simulation approach combines density functional theory (DFT) and molecular dynamics (MD) in order to efficiently account for the crucial hydration effects in the simulation of carbohydrates and their spectroscopic response predictions. Excellent agreement between the simulated spectrum and the experiment was obtained with a solvation radius of 10 Å. Vibrational bands have been resolved from the computed ROA data, and compared with previous results on different monosaccharides in order to identify specific structure–spectrum relationships and to investigate the effect of the solvation environment on the conformational dynamics of small sugars. From the comparison with ROA analytical results, a shortcoming of the classical force field used for the MD simulations has been identified and overcome, again highlighting the complementary role of experiment and theory in the structural characterisation of complex biomolecules. Indeed, due to unphysical puckering, a spurious ring conformation initially led to erroneous conformer ratios, which are used as weights for the averaging of the spectral average, and only by removing this contribution was near perfect comparison between theory and experiment achieved.
Introduction
As a chiroptical technique, Raman optical activity (ROA) spectroscopy holds great promise for the analysis of biomolecular systems.1–3 In particular, it offers an alternative to traditional analytical methods that are not always applicable.4–9 ROA is the measurement of small differences in Raman scattering between circularly polarised light beams (incident, scattered or both). Since most biologically active molecules are chiral, ROA represents an attractive and powerful tool for the study of conformational dynamics, the structural elucidation of biological samples, and more generally the assignment of absolute configuration. Because of its great sensitivity to molecular structure, sample conditions, or surrounding molecular environment, the interpretation of ROA experimental data greatly benefits from the support of modelling and simulation, nowadays well within common computational and theoretical means.10–13So far, ROA has mostly been applied to study peptide and protein structure6,14–20 while comparatively few efforts have been dedicated to carbohydrates, due to their flexibility and susceptibility to solvent effects. However, recent methodological developments21–23 have put forward promising ways to tackle solvation modelling and conformational averaging. A growing consensus supports the need for the inclusion of explicit solvent molecules. Whilst implicit solvent models are effective for studies on peptides,24,25 it has already been established that their shortcomings are more pronounced for carbohydrates.22,26,27 More precisely, implicit solvation is suitable for carbohydrates that dissolve in apolar solvents, e.g. carbohydrates with protected OH groups, but it is rather unsuitable as a model for water. Explicit solvent models have also been used with great success for biologically relevant polar molecules28 and peptides.19
Calculating ROA spectra with explicit water molecules can be carried out through two different approaches. The first approach is to calculate the entire system at the same level theory, which can be very expensive computationally and, hence, is limited to relatively small numbers of water molecules. Moreover, it can be very difficult to optimise the geometry of such a system, due to a shallow potential energy surface. More involved methods may therefore be required, such as Bouř's normal mode optimisation procedure.29,30 The second approach is to use a combination of quantum mechanics and classical molecular mechanics methods (QM/MM). This treats the solute in question at the QM level, while the solvent is treated at a computationally much less expensive MM level of theory. In this way, the inclusion of significantly more solvent molecules in ROA simulations can be achieved practically.
A combined MD/QM method that we introduced to study methyl-β-D-glucose27 was later expanded in a study on D-glucuronic acid and N-acetyl-D-glucosamine.26 This approach consists of gathering knowledge on the conformational dynamics in solution of the saccharide at hand, through MD simulation. From this basis, it is then possible to extract a limited number of solvated configurations according to the statistical significance of the related conformers. The selected configurations, originally defined within a periodic system, are then cropped into spherical systems featuring a reduced number of water molecules surrounding the solute, in a manner suitable for QM/MM optimisation and spectral calculations.31 Explicit solvation can thus be enforced throughout the process, ensuring that the conformational behaviour of the flexible carbohydrate is properly modelled, and that the diffuse ROA-spectroscopic responses encompass the environment's impact. The predicted spectrum is effectively an average of every snapshot computation, where conformer population ratios are used as weights in order to recover the time-averaged nature of the experimental spectrum.
A practical consideration for QM/MM calculations is how much solvent to include in the MM calculation. The spectra of methyl-β-D-glucose was accurately modelled with 150 water molecules,27 while D-glucuronic acid and N-acetyl-D-glucosamine simulations used approximately 210 water molecules (employing a solvation sphere with 12 Å radius from the centre of the solute).26 Urago et al.19 also used in the region of 200 water molecules in their study of a cyclic dipeptide. Whilst inclusion of extra water molecules in this fashion does not necessarily increase the computational cost of each optimisation step, it does significantly increase the number of optimisation steps needed until convergence. Therefore, it is desirable to use the minimum number of solvent molecules to accurately model the ROA spectra, in order to decrease computation time. Consequently, the objective of the present work is benchmarking the optimal solvation radius for accurate calculation of carbohydrate ROA spectra. To this aim, we have considered β-D-xylose as the test case of this study, which is shown in Fig. 1. Indeed, this molecule is smaller and exhibits less conformational flexibility than most other monosaccharides. Therefore, there is less chance of structural changes affecting spectral comparisons between predictions with different sizes of solvation shell. Also, to the best of our knowledge, no one has ever reported a theoretical ROA spectrum for β-D-xylose while only one experimental spectrum has been reported, by Barron and co-workers.32 Moreover, this monosaccharide is an important molecule in the context of bioenergy, as it is one of the main constituents of hemicelluloses and a major by-product of biomass33,34 as well as being a primary saccharide in the biosynthetic pathways of many anionic polysaccharides.35–37
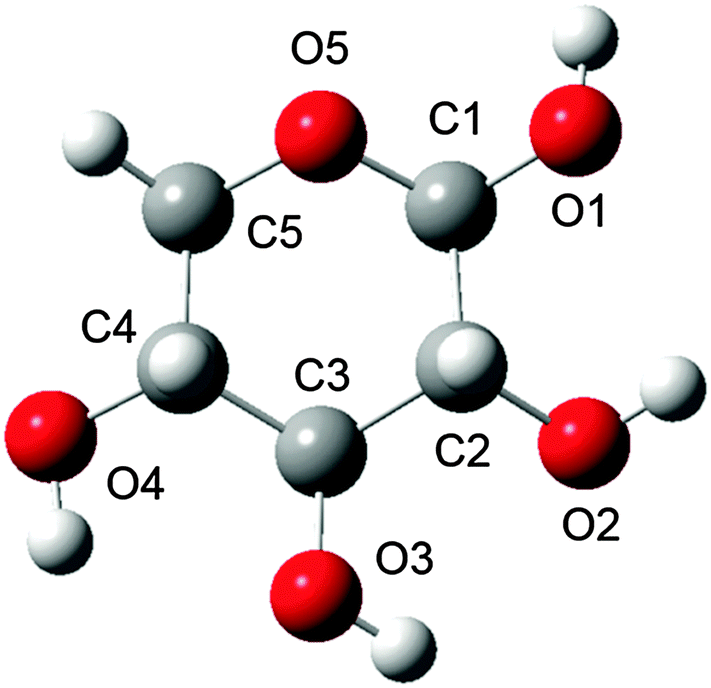 | ||
| Fig. 1 Ball and stick representation of β-D-xylose with the numbering scheme used herein. Carbon, hydrogen, and oxygen atoms are shown in grey, white, and red, respectively. Hydrogens are referred to by adding the atom label it is linked to as suffix, e.g. HO3 for the hydrogen linked to O3. | ||
The β-D-xylose molecule lacks the relatively flexible moieties at the C5 position (Fig. 1) or the N-acetylated amino groups present in previously investigated carbohydrates. Therefore, xylose's conformational behaviour has been scrutinised through the dihedral angles related to the 6-membered ring xylose contains, and its hydroxyl groups. Indeed, bond lengths, angles and “internal” dihedrals (such as the ones related to the ring) will undergo significant changes through the QM/MM optimisation. Thus the only geometrical features relevant for snapshot selection are those expressing the orientation of the “external” atoms, which are more likely to be held in place by the solvent. The large variety of conformers spanned by the combinations of each of these dihedrals' possible orientations prompted even further development of the snapshot selection procedure. Indeed, each substituent's orientation impacts the neighbouring groups. In other words, their conformer probabilities are correlated. Furthermore, the delocalised nature of the ROA vibrations, in terms of coupling between ring deformations and hydroxyl modes, makes a singular assignment of bands difficult. These last points then justify considering the “molecular” conformation of carbohydrates rather than independently scrutinising the histograms of individual dihedrals.
Technical and methodological details
The general computational method developed in this study is illustrated by Fig. 2. The basic data consist of the dynamic behaviour of a solvated sugar, sampled by extensive MD simulation. The conformational analysis of these data provides optimal starting points for the subsequent QM/MM processing. The latter enables the prediction of ROA spectra from the electromagnetic properties of the system while accurately accounting for the solvation environment. As will be illustrated later, the method benefits from the physical and technical insights gained by confronting theory with experiment: the relevant steps are improved when limitations are identified. In this work, the impact of the water shell size on the spectrum prediction of conformational behaviour is scrutinised. To do so, snapshots were extracted with threshold radii varying from 5 to 12 Å, for each selected frame. All ab initio calculations were carried out using GAUSSIAN0938 while MD simulations were performed by DL_POLY v4.05.39 | ||
| Fig. 2 Schematic of the approach to calculation of ROA spectra, with arrows representing flow of data between steps. | ||
Experimental measurements
β-D-Xylose was purchased from Sigma-Aldrich and used without further purification. The ROA spectrum was measured at ambient temperature in water using a ChiralRAMAN instrument from BioTools Inc. (Jupiter FL, USA).,40 which employs the scattered circular polarization (SCP) measurement strategy. The ROA spectrum is presented as circular intensity differences (IR − IL) with IR and IL denoting the Raman intensities with right- and left-circular polarization, respectively. The sample concentration was ∼150 mM in deionised H2O. Experimental conditions were: laser wavelength 532 nm, laser power at the sample 500 mW, spectral resolution 7 cm−1 and acquisition time 18 h. Cosmic ray spikes were removed from the ROA data by means of a median filter, after which the spectrum was smoothed using a second-order Savitzky–Golay filter.Molecular dynamics simulations
Explicit solvation was processed through DL_FIELD v 3.141 by immersing the sugar monomer within a pre-optimised cubic cell of TIP3P water molecules. Corresponding input files were generated, again using DL_FIELD to apply the GLYCAM0642 force field parameters and constraining the water model as rigid body. In order to reduce compute time, the cubic cell was cropped from 40 Å (minimum size with DL_FIELD) down to 30 Å, which is suitable for this monosaccharide.The Smooth Particle-Mesh Ewald method was chosen for electrostatic interactions, and the cut-off for its real-space part and Van der Waals interactions is set to 7 Å (>2σmax) for optimal computational efficiency. First the water molecules and then the full system were progressively equilibrated by relaxing the force-capping-threshold from 100 to 10![[thin space (1/6-em)]](https://www.rsc.org/images/entities/char_2009.gif) 000 internal units (necessary to stabilise the crudely solvated initial configuration). Once the system reached equilibration at 298 K, the volume was relaxed to convergence for a 1 atm pressure within an NPT ensemble. For all stages, a 0.5 fs integration timestep was used. Berendsen coupling was set up to 0.1 ps (thermostat) and 1.0 ps (NPT stage barostat) as time constants. The production run was carried out within an NVT ensemble for an extensive 50 ns simulation timeframe, which is considered adequate for the proper sampling of a monosaccharide's conformational diversity.43
000 internal units (necessary to stabilise the crudely solvated initial configuration). Once the system reached equilibration at 298 K, the volume was relaxed to convergence for a 1 atm pressure within an NPT ensemble. For all stages, a 0.5 fs integration timestep was used. Berendsen coupling was set up to 0.1 ps (thermostat) and 1.0 ps (NPT stage barostat) as time constants. The production run was carried out within an NVT ensemble for an extensive 50 ns simulation timeframe, which is considered adequate for the proper sampling of a monosaccharide's conformational diversity.43
Conformational analysis and snapshots selection
From the MD trajectory's wealth of configurational data, it is important to select and extract the most statistically representative structures. Indeed, committing an optimal number of snapshots to the next QM/MM processing is critical for keeping our method's computational efficiency within practical bounds.A number of dihedral angles were selected, in order to encompass the most important geometrical features of the considered sugar monomer, i.e. the orientation of the various hydroxyl groups (for the one corresponding to glycosidic link position, the monitored dihedral angle was defined starting from the ring's oxygen atom as per O5–C1–O1–HO1 to emulate the usual ω angle in carbohydrate convention, whereas the others were defined along H–C–O–H patterns). The value spaces spanned by each angle, as observed on the corresponding histograms, were divided into broad domains corresponding to singular conformations (e.g. for ω, the usual gg/gt/tg conformer domains are [−120,0], [0,120], and [−180,−120]∪[120,180], respectively). The MD trajectory frames were then processed by spreadsheet functions so as to obtain the populations of each molecular conformer and identify the dominant structures. Each of the selected geometrical feature average values were computed for each selected conformer. Note that in order not to include contamination from overlapping conformer populations, these averages were computed over restrained intervals centred on the angle values corresponding to the population maxima. Finally, MD frames representative of the most dominant conformers were retrieved by filtering the values closest to the corresponding averages. These snapshots, centred on the sugar's centre of mass, were then cropped into smaller spherical (non-periodic) systems for a range of radii.
QM/MM optimization and spectrum calculation
In order to efficiently handle the explicit solvent molecules, we rely on the ONIOM method,44 as implemented in GAUSSIAN09. Each starting configuration was divided into a QM layer (B3LYP/6-31G(d) level of theory and basis set) for the monosaccharide, and a classical MM encompassing all the water solvent molecules (AMBER's parm96 force field and TIP3P parameters). The electrostatic polarisation effect of the solvent can then be accounted for in the QM Hamiltonian, thanks to the electronic embedding scheme.For an ab initio vibrational mode calculation to be valid, the QM part of the system must be optimised beforehand. Two different optimisation procedures were applied: OPTSOLUTE and OPTALL. With OPTSOLUTE, the water molecules were frozen in their initial geometry and only the sugar was relaxed. The OPTALL procedure allows for the optimisation of the whole system. The former is much less computationally intensive but was shown26 to be detrimental to the quality of the spectrum prediction, whereas the OPTALL scheme did yield much better agreement between predicted spectra and experiment at the cost of a more delicate operation (relatively flat potential energy surface).
Once the system was optimised and the harmonic frequencies calculated, the last stage of the method consists of the calculation of the ROA intensities. To that end, we rely on the (n + 1) algorithm,12 a fully analytic two-step procedure, based on magnetic field dependent basis functions (GIAOs),45,46 for the computation of the frequency dependent ROA tensors. As recommended by other studies and benchmarks,47,48 these ROA computations made use of the rDPS basis set. The excitation wavelength was set to 532 nm, in accordance with the experimental conditions. The combination of the appropriate invariants and the inclusion of ν4 and Boltzmann factors enabled us to obtain, for comparison with experiment, backscattered scattered circular polarization (SCP-180) ROA intensities at far-from-resonance conditions. Finally, a Lorentzian bandshape (10 cm−1 peak half-width) was used for the generation of predicted spectra (with ROA intensities shown in arbitrary units). Finally, the individual conformer spectra were weighted according to their MD population ratio, and merged using lineshape form averaging to generate the final predicted spectrum for comparison with experiment.
Results
MD – conformations
Once the MD simulation is completed, the various energies and structural features must be examined for any signs of problems or artifacts. It is not, however, until the following process has been carried out and the QM/MM procedure completed that the occurrence of an inverted chair conformation, i.e. with hydrogens in equatorial positions, was detected. In fact, predicted ROA spectra based on this particular inverted chair conformation (reported in Fig. S2 of the ESI†) are in very poor agreement with experiment, by comparison with predictions obtained from the usual chair conformation. It was by observing these striking differences that we were able to identify their cause and backtrack to this, a priori, spurious simulation result. This inverted chair conformation dominates the configurations explored by the MD simulation, with a conformer ratio of 60.4%, whereas the usual and expected chair form (i.e. equatorial substituents) only appears in 39.6% of the MD frames (the corresponding histogram is presented in Fig. S1-a of the ESI†). Observing such a conformation goes against intuition, due to the supposedly high steric repulsion of the substituents. An AMBER49 validation run, carried out with similar simulation parameters and force field, confirmed the surprising DL_POLY results, whereas gas-phase optimisations produce the usual chair conformation (both at classical and quantum level: AMBER + GLYCAM and GAUSSIAN) reported as the global minimum in elsewhere.50 In reality, only under the most strained conditions or constrained environment (such as in an enzyme pocket), should different puckering forms be expected.51 This result is most likely due to a shortcoming of the GLYCAM force field, leading to this spurious puckering of the xylose ring when solvated by TIP3P water. Thus, the complementary role of theory and experiment is dramatic in the present case, where the experimental ROA spectrum guides the interpretation of the simulation results. Reporting this particular problem will hopefully lead to further development of more reliable carbohydrate specific force fields, or even better force fields altogether. Contrarily to most monosaccharides, β-D-xylose is deprived of substituent on the C5 atom, and elsewhere on the ring no substituents bulkier than hydroxyl groups are present. Hence, we raise the hypothesis that, in the case of β-D-xylose, GLYCAM parameters fall short of long-ranged dihedral constraints, which are responsible for the ring rigidity in other monosaccharides. We cannot observe the large difference in the O5–C1 bond length reported before50 between the two conformations at hand, which points again at a transferability limitation of the GLYCAM parameters, hindering the realistic simulation of β-D-xylose conformational dynamic.In spite of the GLYCAM's lack of reliability, it remains necessary to select QM/MM starting points from the MD trajectory that it generates. Indeed, the latter remains our only source for sensible solvated configurations. Consequently, the MD trajectory was purged from every frame featuring the inverted chair conformation, before any further conformational data processing. The simulation length covered by the purged trajectory drops down to only 20 ns from the 50 ns spanned by the full MD simulation (time length recommended for exhaustiveness of sampling for monosaccharides43). Such a reduction in the sampled configurational space is not significant in the xylose case, as this sugar's conformational behaviour possesses fewer degrees of freedom than the usual monosaccharides (and no possible slow-process deformations, as there are only hydroxyl substituents).
Histograms for each of the selected dihedral angles are presented in Fig. 3, and the corresponding “individual” conformer populations are listed in Table 1. For each monitored dihedral angle, three preferred orientations emerge: around −60°, 60° and 180°, as expected from a ring based on tetragonal carbon atoms. Without any further knowledge of structure–spectrum relationships, there is no guidance to reduce, unless arbitrarily, the sheer amount of combinations of hydroxyl group torsions (34 = 81 possibilities) to a manageable number of snapshots. Therefore, “combined” conformer ratios were calculated for every case, while a simple descending sort enabled us to prioritise the 14 most statistically relevant combinations observed within the MD sampling. The specifics of the corresponding snapshot are reported in the ESI† (sugar geometries, correlated and uncorrelated probabilities). This elaborate “combined” procedure was preferred over one using products of “individual” conformer ratios. The latter approach, which is cruder, would indeed disregard any possible correlation between the orientations of neighbouring hydroxyl groups, for example. The numerical differences between both approaches are reported with more details in the ESI.† These reported values show notably that the probability order of the “combined” conformers is unstable over the two methods, and that non-correlated “combined” conformer ratios can be off by up to 5% of the total number of frames.
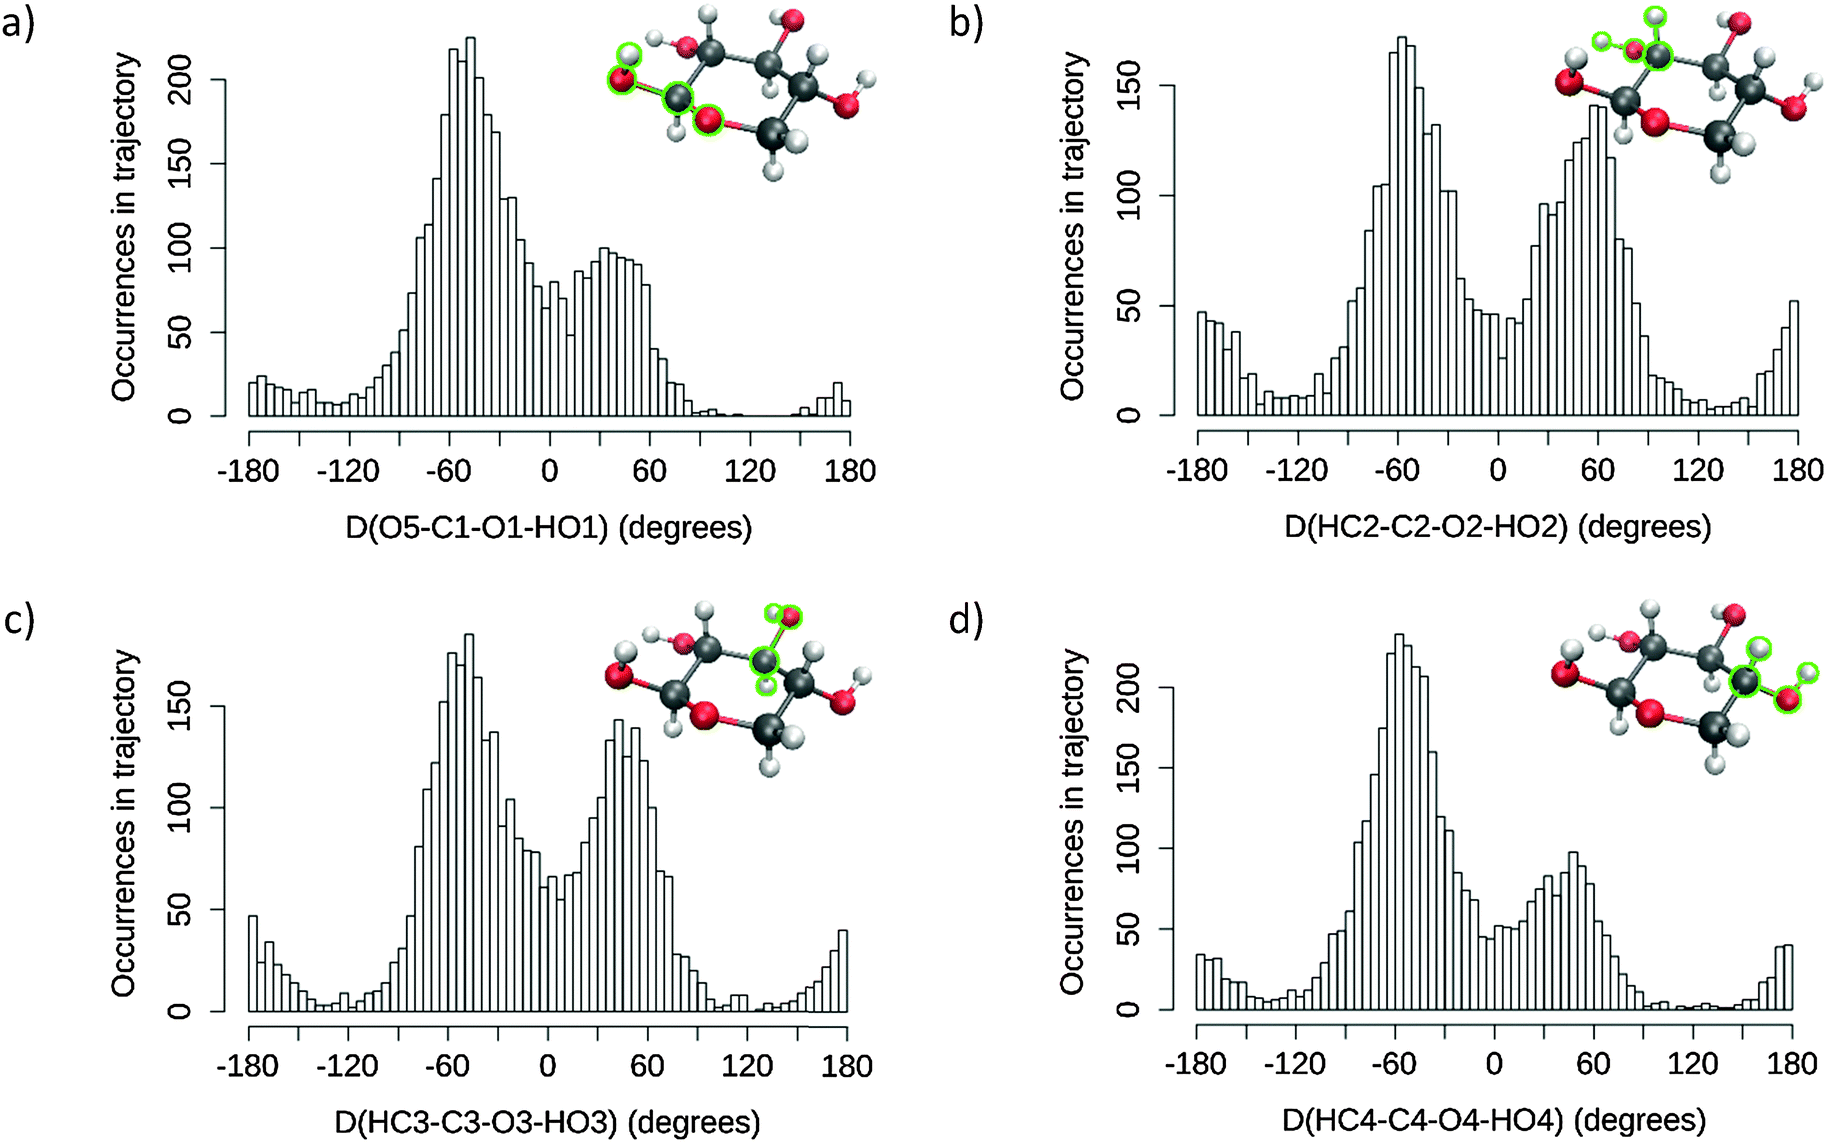 | ||
| Fig. 3 Values distribution of the selected dihedral angles along the MD trajectory (NVT production run), purged of the “inverted” chair ring conformation: (a) D(O5–C1–O1–HO1), (b) D(HC2–C2–O2–HO2), (c) D(HC3–C3–O3–HO3) and (d) D(HC4–C4–O4–HO4). | ||
| O5–C1–O2–HO1 | HC2–C2–O2–HO2 | HC3–C3–O3–HO3 | HC4–C4–O4–HO4 | |
|---|---|---|---|---|
| [−120,0] | 0.655 | 0.474 | 0.522 | 0.650 |
| [0,120] | 0.289 | 0.406 | 0.392 | 0.265 |
| [−180,−120]∪[120,180] | 0.056 | 0.120 | 0.086 | 0.085 |
QM/MM – ROA predictions
Of the 14 selected snapshots, three were arbitrarily chosen to test the solvent shell dependence. Coordinates were extracted from these snapshots and truncated to give a series of spherical systems with radii in a range from 5 Å to 12 Å, with β-D-xylose at the centre. This resulted in average numbers of water molecules of 6, 19, 30, 55, 82, 114, 160, and 213, for 5, 6, 7, 8, 9, 10, 11 and 12 Å, respectively, across the three snapshots. Each of the systems was optimised using the OPTALL and OPTSOLUTE approaches and the ROA spectra were calculated accordingly.The spectra of the different solvation shell sizes for the first examined snapshot, calculated using OPTALL, are reported in Fig. 4. The optimal size of the solvation shell corresponds to the size that exhibits minimal change in the band profile as more solvent molecules are added to the simulation. There are relatively small differences in spectral details when increasing the size of the solvation shell beyond 9 Å. However, 10 Å does still provide a noticeable improvement in the relative intensities of the ROA bands at higher wavenumbers. As expected, the level of consistency between the calculated spectra becomes worse as the solvation shell shrinks. This is especially prevalent in the low wavenumber region where there are marked differences in the band profile. Generally, many of the bands in the fingerprint region do not correspond in sign or intensity with the bands modelled for solvation shells of 5–6 Å. The 8 Å radius solvation shell is the smallest to give reasonable agreement with the 12 Å radius solvation shell in the low wavenumber region, notably reproducing the most prominent positive band in this region at 425 cm−1. However, there is still poor agreement with experiment in the region around 1000 cm−1. The same analysis was carried out for a further two snapshots and their spectra are reported in the ESI.† A similar level of agreement is observed across all three snapshots, with the 9 Å solvation shell being the smallest size to correctly reproduce most of the ROA features. However, we recommend increasing the solvation shell to 10 Å for accurate ROA calculations as it still offers significant improvement over 9 Å, particularly for features in the higher wavenumber regions above 1200 cm−1.
 | ||
| Fig. 4 ROA spectra of a single β-D-xylose snapshot for spherical solvation systems with a range of radii in Å (listed on the right hand side), calculated using the OPTALL approach. | ||
For the first snapshot examined, the spectra generated for each of the different solvation shell sizes, calculated using OPTSOLUTE, are reported in Fig. 5. Unlike for the case of the OPTALL calculations, there is consistency with the 12 Å radius solvation shell in the predicted ROA features between solvation shell sizes at much smaller radii. To reproduce the spectrum above 1000 cm−1 accurately, a solvation shell radius of only 6 Å was required. Increasing this radius to 7 Å resulted in excellent consistency for ROA features above 800 cm−1. A solvation shell of 8 Å gives also excellent consistency over the full range of the calculated spectra reported here. For methods analogous to OPTSOLUTE, we recommend the use of a solvation shell size of 8 Å, corresponding to approximately 55 water molecules, as a minimum for accurate reproduction of the full ROA spectrum. This trend can also be seen with the two further snapshots examined, as reported in the ESI.†
 | ||
| Fig. 5 ROA spectra of a single β-D-xylose snapshot for spherical systems with a range of radii in Å (listed on the right hand side), calculated using the OPTSOLUTE approach. | ||
As a result of the analysis outlined above, the remaining eleven snapshots were truncated to a radius of 10 Å. These were optimised using the OPTALL and OPTSOLUTE approaches, and their ROA spectra were calculated. Despite the above results indicating an 8 Å radius as being suitable for the OPTSOLUTE approach, ROA spectra were calculated using the same size of solvation shell as OPTALL to allow for more accurate comparison between these two optimisation procedures. The spectra for the individual snapshots were weighted using the MD conformer populations to produce the final predicted spectrum.
Fig. 6 presents the calculated and experimental spectra for β-D-xylose. Panels A and B correspond to the spectra calculated in the gas phase and with the PCM implicit solvation model, respectively. Panels C and D represent the spectra weighted from fourteen snapshots optimised using the OPTSOLUTE and OPTALL approaches, respectively. Panel E shows the experimental spectrum. There is excellent agreement between the experimental spectrum in panel E and that for the calculation in panel D. This shows that the OPTALL approach is very well suited for the reproduction of the ROA spectrum of β-D-xylose. The profiles show excellent agreement at wavenumbers above the sharp negative band at 1122 cm−1, in all three of intensity, sign and position, although the bands in panel D are slightly shifted to a higher wavenumber by approximately 30 cm−1. Closer examination verifies the excellent correlation between experimental and modelled spectral features. For example, the strong positive band in panel D at 1066 cm−1 corresponds to the doublet centred at 1041 cm−1 in panel E, although examination of the band in the calculated spectrum shows two shoulders, one at 1053 cm−1 and the other at 1092 cm−1. The peak and shoulder at lower wavenumber likely correspond to the experimental band at 1017 cm−1 and the higher wavenumber shoulder at 1092 cm−1 corresponds to the experimental band at 1062 cm−1. Coalescence of these bands in the calculated spectra likely results in the apparent difference between the modelled spectra shown in panels D and E. The low wavenumber regions offer reasonable agreement also, although some of the finer details between 600 cm−1 and 800 cm−1 are not reproduced as well as those at higher wavenumber. The OPTSOLUTE approach, in panel C, appears to give better band definition in the low wavenumber regions than OPTALL, although in general the relative intensities are in poorer agreement with experiment.
 | ||
| Fig. 6 ROA spectra of β-D-xylose. Calculated gas phase spectrum (A), calculated spectrum using PCM (B), OPTXYLOSE spectrum (C), OPTALL spectrum (D), and experimental (E). | ||
Previous reported work has shown that gas phase and implicit solvated calculations are not suitable for ROA calculations of carbohydrates.26 This is also apparent here, with very poor agreement between the gas phase (panel A) and PCM (panel B) calculations with experiment (panel E). The peak profiles present very few comparable features and incorrect relative intensities and signs. As has been shown for previous monosaccharides, the OPTALL approach is clearly superior for calculation of carbohydrate ROA.
The molecular origin of the observed bands is an important area to also explore when studying carbohydrates. Early experiments by Barron and co-workers identified regions of carbohydrate spectra corresponding to groups of vibrational modes,32 but very few publications offer well defined vibrational assignments of calculated spectra for sugars. Our recent work on D-glucuronic acid and N-acetyl-D-glucosamine was the first to assign vibrational modes for carbohydrates based on weighted spectra calculated using explicit solvation.26 To further the understanding of carbohydrate ROA spectra, the vibrational analysis of the calculated spectrum of β-D-xylose has been carried out here.
Table 2 shows the ROA band assignments calculated for the OPTALL approach, based on the method outlined in ref. 31. These assignments were obtained by determining the main features in Fig. 6 (panel D), and then by analysing the corresponding vibrations in each of the fourteen individual spectra used in the weightings. This was corroborated by the analysis of the atomic displacement data from the calculation output files. Moreover, the latter enables us to select the most intense and recurrent vibrations from the carbohydrate's diffuse vibrational modes. The features in the low wavenumber regions have not been explored. Indeed, their librational nature, coupled with strong solvent contributions, results in very delocalised and non-distinctive vibrational modes, which are difficult to assign in the manner described above.
| Wavenumber (cm−1) | Assignmenta | Visualisation of modeb |
|---|---|---|
| a Numbering convention used for assignment and visualisation is the same as shown in Fig. 1. b ax and eq correspond to the axial and equatorial positions, respectively. | ||
| 915 |
H–C5–H out of plane wag
Weak O–H wags |

|
| 1020 |
C1–O5–C5 symmetric stretch
Weak O–H wags |

|
| 1053 | Coupled C–C with C–O stretches |

|
| 1066 | Coupled C–C with C–O stretches |
|
| 1092 | Coupled C–C with C–O stretches |

|
| 1122 | Coupled asymmetric C–C with C–O stretches |

|
| 1155 | Ring deformations |

|
| 1199 |
C1–O1 stretch
Weak C–H wags |
|
| 1248 | C–H wags |

|
| 1295 |
H–C5–H in plane twist
C–H wags |

|
| 1369 | C–H wags |

|
| 1431 |
C–C stretches
C–H wags |

|
| 1552 | Coupled O1–H with C1–H wag |

|
Comparison of the vibrational assignments reported in Table 2 to those in ref. 26 (for D-glucuronic acid and N-acetyl-D-glucosamine) shows some similarities. For example, the ring deformation at 1155 cm−1 for β-D-xylose corresponds to ring and bond deformations reported at similar wavenumbers for D-glucuronic acid and N-acetyl-D-glucosamine. Also, the band arising from C–H wags at 1248 cm−1 appears in the spectra for all three monosaccharides. These similarities result in a very similar band profile between 1100 and 1300 cm−1 for β-D-xylose, D-glucuronic acid, and N-acetyl-D-glucosamine. Even though this region of the spectrum has the most striking level of agreement between the reported band assignments, more general rules can be proposed about the diagnostic capability of monosaccharide ROA bands. O–H wags mainly appear in the range from 920–1020 cm−1, C–C and C–O stretches appear from 1020 – 1240 cm−1, C–H wags are found in the 1240 – 1370 cm−1 interval, and there appears to be a combination of C–C stretches and C–H wags between 1370 cm−1 and 1460 cm−1. These general rules are by no means exhaustive but offer previously unknown insights into the origin of carbohydrate ROA bands. Studies on further carbohydrates will reveal more conclusive rules and allow for the possibility of determining higher order structures in polysaccharides and glycans. Last, it is worth mentioning that these similarities cannot generally be extended toward the predicted spectrum for the inverted chair conformations (see ESI,† Fig. S2). Interestingly, the sharp negative band at 1120 cm−1 and positive doublet at 1060 – 1090 cm−1, related to coupled C–C and C–O asymmetric stretches along the ring, are the most striking exceptions. These bands could be characteristic of chair-shaped ring conformations, while offering independence with respect to the substituent pattern.
Conclusion
The extensive comparison of the radii of solvation shell was this work's main methodological focus, as it addresses an important concern for future ROA investigations of carbohydrates in water solution. The conservative threshold of 10 Å should be enough to prevent any loss of accuracy in the ROA spectrum prediction due to using a finite-size solvation shell, while accelerating and simplifying the QM/MM computations. Of course, further opportunities to reduce the system's complexity while retaining the quality of results will follow computational developments, such as the most anticipated QM/MM/PCM mixed approach reported recently.52,53Besides the initial methodology investigation, various important results should be emphasized here. In applying our methodology we have been able to generate ROA spectral predictions in unprecedented agreement with experiment. A growing corpus of successful test cases strengthens the validity in our choice of method assumptions:
• Solvation effects on sugars can be efficiently accounted for by sampling in a weighted fashion the solute's conformational space. A random sampling can be avoided while retaining statistical significance.
• The quality of the ROA spectrum prediction is sensitive to the QM/MM optimisation process.
Similarly, the continued effort dedicated to establishing ROA band assignments provides a wealth of information from which are starting to emerge insights into the vibrational characteristics of carbohydrates. As our understanding of the structure–spectrum relationships improves further, computational methods and theory will benefit from this synergy. Indeed, through the combination of experiment and theory we have been able to identify and adapt to the shortcoming in the simulations leading to the prediction of a spurious inverted chair conformation.
As methods develop, we are progressing toward a broader and deeper applicability of ROA to investigate the dynamic structure of carbohydrates, and thus our understanding of their diverse biologic functionality. Thanks to the present work, our approach is now practically applicable to small oligosaccharides. We then hope to shed light, for instance, on the dynamics of glycosidic links in solution and, more generally, of solvated glycan chains, as such phenomena are of crucial importance, for example for glycoprotein function. Similarly, the interpretation of a number of experimental observations is now within reach, such as the clear glycan bands reported in ref. 54 and 55, which could thus provide structural insights and in turn guide new computational developments. The current work can be viewed from another further perspective, since dramatic changes are observed in the predicted spectra generated over a short range of hydration sphere widths. One could indeed scrutinise these differences and exploit them while probing molecular crowding effects. More specifically, the presence or absence of some features in the predicted spectrum of a carbohydrate could be used as a way to estimate the number of “biological” water molecules accompanying a ligand within an enzyme pocket.
Acknowledgements
We are grateful to Dr Steve Liem for his help in diagnosing the MD simulations, Dr Marcin Górecki for his advice in formatting Table S1 (ESI†). EB and PLAP would like to thank the Engineering and Physical Sciences Research Council (EPSRC) for funding (EP/J019623/1).References
- L. D. Barron and A. D. Buckingham, Mol. Phys., 1971, 20, 1111 CrossRef CAS.
- L. D. Barron, M. P. Bogaard and A. D. Buckingham, J. Am. Chem. Soc., 1973, 95, 603 CrossRef CAS.
- L. D. Barron, L. Hecht, I. H. McColl and E. W. Blanch, Mol. Phys., 2004, 102, 731 CrossRef CAS.
- J. Haesler, I. Schindelholz, E. Riguet, C. G. Bochet and W. Hug, Nature, 2007, 446, 526 CrossRef CAS PubMed.
- Y. He, W. Bo, R. K. Dukor and L. A. Nafie, Appl. Spectrosc., 2011, 65, 699 CrossRef CAS PubMed.
- S. Yamamoto, Anal. Bioanal. Chem., 2012, 403, 2203 CrossRef CAS PubMed.
- F. Zhu, G. E. Tranter, N. W. Isaacs, L. Hecht and L. D. Barron, J. Mol. Biol., 2006, 363, 19 CrossRef CAS PubMed.
- L. D. Barron, L. Hecht, E. W. Blanch and A. F. Bell, Prog. Biophys. Mol. Biol., 2000, 73, 1 CrossRef CAS PubMed.
- N. R. Yaffe, A. Almond and E. W. Blanch, J. Am. Chem. Soc., 2010, 132, 10654 CrossRef CAS PubMed.
- M. Pecul and K. Ruud, Int. J. Quantum Chem., 2005, 104, 816 CrossRef CAS.
- M. Pecul, Chirality, 2009, 21, E98 CrossRef CAS PubMed.
- K. Ruud and A. J. Thorvaldsen, Chirality, 2009, 21, E54 CrossRef CAS PubMed.
- M. Górecki, Org. Biomol. Chem., 2015, 13, 2999 Search PubMed.
- P. Mukhopadhyay, G. Zuber and D. N. Beratan, Biophys. J., 2008, 95, 5574 CrossRef CAS PubMed.
- J. Kapitán, F. Zhu, L. Hecht, J. Gardiner, D. Seebach and L. D. Barron, Angew. Chem., Int. Ed., 2008, 47, 6392 CrossRef PubMed.
- C. R. Jacob, S. Luber and M. Reiher, Chem. – Eur. J., 2009, 15, 13491 CrossRef CAS PubMed.
- M. Kamiński, A. Kudelski and M. Pecul, J. Phys. Chem. B, 2012, 116, 4976 CrossRef PubMed.
- V. Parchaňský, J. Kapitán, J. Kaminský, J. Šebestík and P. Bouř, J. Phys. Chem. Lett., 2013, 4, 2763 CrossRef.
- H. Urago, T. Suga, T. Hirata, H. Kodama and M. Unno, J. Phys. Chem. B, 2014, 118, 6767 CrossRef CAS PubMed.
- S. Yamamoto, T. Furukawa, P. Bouř and Y. Ozaki, J. Phys. Chem. A, 2014, 118, 3655 CrossRef CAS PubMed.
- N. A. Macleod, C. Johannessen, L. Hecht, L. D. Barron and J. P. Simons, Int. J. Mass Spectrom., 2006, 253, 193 CrossRef CAS.
- S. Luber and M. Reiher, J. Phys. Chem. A, 2009, 113, 8268 CrossRef CAS PubMed.
- J. Kaminský, J. Kapitán, V. Baumruk, L. Bednárová and P. Bouř, J. Phys. Chem. A, 2009, 113, 3594 CrossRef PubMed.
- M. Pecul, C. Deillon, A. J. Thorvaldsen and K. Ruud, J. Raman Spectrosc., 2010, 41, 1200 CrossRef CAS.
- J. Šebek, J. Kapitán, J. Šebestík, V. Baumruk and P. Bouř, J. Phys. Chem. A, 2009, 113, 7760 CrossRef PubMed.
- S. T. Mutter, F. Zielinski, J. R. Cheeseman, C. Johannessen, P. L. A. Popelier and E. W. Blanch, Phys. Chem. Chem. Phys., 2015, 17, 6016 RSC.
- J. R. Cheeseman, M. S. Shaik, P. L. A. Popelier and E. W. Blanch, J. Am. Chem. Soc., 2011, 133, 4991 CrossRef CAS PubMed.
- K. H. Hopmann, K. Ruud, M. Pecul, A. Kudelski, M. Dračínský and P. Bouř, J. Phys. Chem. B, 2011, 115, 4128 CrossRef CAS PubMed.
- P. Bouř and T. A. Keiderling, J. Chem. Phys., 2002, 117, 4126 CrossRef.
- P. Bouř, Collect. Czech. Chem. Commun., 2005, 70, 1315 CrossRef.
- S. T. Mutter, F. Zielinski, P. L. A. Popelier and E. W. Blanch, Analyst, 2015, 140, 2944–2956, 10.1039/C4AN02357A.
- Z. Q. Wen, L. D. Barron and L. Hecht, J. Am. Chem. Soc., 1993, 115, 285 CrossRef CAS.
- O. Turhan, A. Isci, B. Mert, O. Sakiyan and S. Donmez, Prep. Biochem. Biotechnol., 2015, 45, 785 CrossRef CAS PubMed.
- A. M. Socha, R. Parthasarathi, J. Shi, S. Pattathil, D. Whyte, M. Bergeron, A. George, K. Tran, V. Stavila, S. Venkatachalam, M. G. Hahn, B. A. Simmons and S. Singh, Proc. Natl. Acad. Sci. U. S. A., 2014, 111, E3587 CrossRef CAS PubMed.
- T. Buskas, S. Ingale and G.-J. Boons, Glycobiology, 2006, 16, 113R CrossRef CAS PubMed.
- T. Mikami and H. Kitagawa, Biochim. Biophys. Acta, Gen. Subj., 2013, 1830, 4719 CrossRef CAS PubMed.
- K. Sugahara and H. Kitagawa, Curr. Opin. Struct. Biol., 2000, 10, 518 CrossRef CAS PubMed.
- M. J. Frisch, G. W. Trucks, H. B. Schlegel, G. E. Scuseria, M. A. Robb, J. R. Cheeseman, G. Scalmani, V. Barone, B. Mennucci, G. A. Petersson, H. Nakatsuji, M. Caricato, X. Li, H. P. Hratchian, A. F. Izmaylov, J. Bloino, G. Zheng, J. L. Sonnenberg, M. Hada, M. Ehara, K. Toyota, R. Fukuda, J. Hasegawa, M. Ishida, T. Nakajima, Y. Honda, O. Kitao, H. Nakai, T. Vreven, J. A. Montgomery Jr, J. E. Peralta, F. Ogliaro, M. J. Bearpark, J. Heyd, E. N. Brothers, K. N. Kudin, V. N. Staroverov, R. Kobayashi, J. Normand, K. Raghavachari, A. P. Rendell, J. C. Burant, S. S. Iyengar, J. Tomasi, M. Cossi, N. Rega, N. J. Millam, M. Klene, J. E. Knox, J. B. Cross, V. Bakken, C. Adamo, J. Jaramillo, R. Gomperts, R. E. Stratmann, O. Yazyev, A. J. Austin, R. Cammi, C. Pomelli, J. W. Ochterski, R. L. Martin, K. Morokuma, V. G. Zakrzewski, G. A. Voth, P. Salvador, J. J. Dannenberg, S. Dapprich, A. D. Daniels, Ö. Farkas, J. B. Foresman, J. V. Ortiz, J. Cioslowski and D. J. Fox, Gaussian, Inc., Wallingford, CT, USA, 2009.
- I. T. Todorov, W. Smith, K. Trachenko and M. T. Dove, J. Mater. Chem., 2006, 16, 1911 RSC.
- L. D. Barron, F. Zhu, L. Hecht, G. E. Tranter and N. W. Isaacs, J. Mol. Struct., 2007, 834, 7 CrossRef.
- C. W. Yong, in DL_FIELD – A force field and model development tool for DL_POLY, ed. R. Blake, CSE Frontier, STFC Computational Science and Engineering, Daresbury Laboratory, 2010, pp. 38–40 Search PubMed.
- K. N. Kirschner, A. B. Yongye, S. M. Tschampel, J. González-Outeiriño, C. R. Daniels, B. L. Foley and R. J. Woods, J. Comput. Chem., 2008, 29, 622 CrossRef CAS PubMed.
- K. N. Kirschner and R. J. Woods, Proc. Natl. Acad. Sci. U. S. A., 2001, 98, 10541 CrossRef CAS PubMed.
- S. Dapprich, I. Komáromi, K. S. Byun, K. Morokuma and M. J. Frisch, THEOCHEM, 1999, 461–462, 1 CrossRef CAS.
- F. London, J. Phys. Radium, 1937, 8, 397 CrossRef CAS.
- R. Ditchfield, Mol. Phys., 1974, 27, 789 CrossRef CAS.
- J. R. Cheeseman and M. J. Frisch, J. Chem. Theory Comput., 2011, 7, 3323 CrossRef CAS.
- G. Zuber and W. Hug, J. Phys. Chem. A, 2004, 108, 2108 CrossRef CAS.
- D. A. Pearlman, D. A. Case, J. W. Calldwell, W. S. Ross, T. E. Cheatham, S. Debolt, D. Ferguson, G. Seibel and P. Kollman, Comput. Phys. Commun., 1995, 91, 1 CrossRef CAS.
- H. B. Mayes, L. J. Broadbelt and G. T. Beckham, J. Am. Chem. Soc., 2014, 136, 1008 CrossRef CAS PubMed.
- J. Iglesias-Fernández, L. Raich, A. Ardèvol and C. Rovira, Chem. Sci., 2015, 6, 1167–1177, 10.1039/C4SC02240H.
- F. Egidi, I. Carnimeo and C. Cappelli, Opt. Mater. Express, 2015, 5, 196–209, DOI:10.1364/OME.5.000196.
- F. Egidi, R. Russo, I. Carnimeo, A. D'Urso, G. Mancini and C. Cappelli, J. Phys. Chem. A, 2015, 119, 5396–5404, DOI:10.1021/jp510542x.
- C. Johannessen, R. Pendrill, G. Widmalm, L. Hecht and L. D. Barron, Angew. Chem., Int. Ed., 2011, 50, 5349 CrossRef CAS PubMed.
- F. Zhu, N. W. Isaacs, L. Hecht and L. D. Barron, J. Am. Chem. Soc., 2005, 127, 6142 CrossRef CAS PubMed.
Footnote |
| † Electronic supplementary information (ESI) available. See DOI: 10.1039/c5cp02969d |
| This journal is © the Owner Societies 2015 |