 Open Access Article
In situ site-selective transition metal K-edge XAS: a powerful probe of the transformation of mixed-valence compounds†
Amélie
Bordage
*a,
Virgile
Trannoy
a,
Olivier
Proux
bc,
Hugo
Vitoux
d,
Robinson
Moulin
a and
Anne
Bleuzen
a
aICMMO, Université Paris-Sud, UMR CNRS 8182, Equipe de Chimie Inorganique, Rue du doyen Georges Poitou, 91405 Orsay Cedex, France. E-mail: amelie.bordage@u-psud.fr
bOSUG, UMR CNRS 832, Université Grenoble-Alpes, F-38041 Grenoble Cedex 9, France
cBM30B/FAME, ESRF, Polygone scientifique Louis Néel, 71 avenue des Martyrs, 38000 Grenoble, France
dEuropean Synchrotron Radiation Faciliy, Sample Environment Service, 71 avenue des Martyrs, 38043 Grenoble, France
First published on 28th May 2015
Abstract
We present herein the first in situ site-selective XAS experiment performed on a proof-of-principle transformation of a mixed-valence compound: the calcination of the K0.1CoII4[CoIII(CN)6]2.7·20H2O Prussian Blue analogue (containing Co2+ and Co3+ ions in two different Oh sites) into Co3O4 (containing Co2+ ions in a Td site and Co3+ in an Oh site). By recording the Co K-edge X-ray absorption spectra using a spectrometer aligned at the Co Kβ1,3 emission line, the evolution of each species was singly monitored from 20 °C up to the oxide formation. The experimental spectrum of the Co2+(Td) and Co3+ (Oh) species in Co3O4 is reported for the first time. Our results demonstrate the possibilities offered by site-selective XAS for the investigation of chemical transformations and the study of materials under working conditions whenever the chemical element of interest is present in several states and/or sites.
Introduction
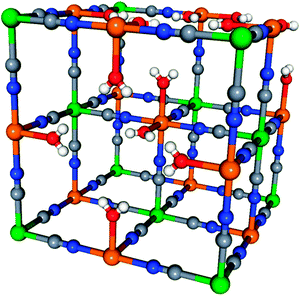
X-ray absorption spectroscopy (XAS) is a well-known powerful tool to characterize the electronic and crystallographic structure of an element in a compound. In the hard X-ray range, XAS is now routinely performed under extreme conditions (pressure, temperature, and irradiation); in situ XAS1–7 is also a mature technique widely used to study chemical processes. However, the classical detection modes (transmission, total fluorescence and total electron yield) average over all species of the absorbing atom in the sample, which hinders the investigation of compounds with the absorbing atom present under different oxidation/spin states and/or in different sites. Site-selective XAS has recently brought new opportunities since it can overcome this limitation8–10 by taking advantage of the high sensitivity of the Kβ1,3 emission line of one element to the spin and oxidation states as well as to covalency.11–16 The spectra are recorded using a high-resolution Rowland-circle spectrometer with analyzer crystals aligned at the maximum of the Kβ1,3 emission line of a given site. The analyzer selects this particular fluorescence line for each incident energy and reflects it on a detector. This technique has been successfully used for instance to discriminate the Co ions from the core and the shell of nanoparticles17,18 or to investigate in detail the active site in [FeFe] hydrogenase.19,20 Herein, we demonstrate for the first time that this demanding XAS technique can be used for in situ investigations. This opens new perspectives to unravel the mechanisms of chemical processes (redox processes, homogeneous or heterogeneous catalysis,…) and to study materials under working conditions (batteries, catalysts,…), which are everyday challenges for chemists.As a proof-of-principle study, we chose to follow the calcination in air of the monometallic Prussian Blue analogue (PBA) of formula K0.1CoII4[CoIII(CN)6]2.7·20H2O (called Co-PBA) into Co3O4.21 PBAs are well-known for their face-centred cubic structure made of cyanide bridges linking two transition metals in the three directions of space.22,23 In Co-PBA, Co2+ high-spin ions (Fig. 1, orange balls) and Co3+ low-spin ions (Fig. 1, green balls) are both present in an octahedral (Oh) site but surrounded by different neighbours: Co2+ is linked to an average of four cyanide bridges (at the N side) and two water molecules, while Co3+ is linked to six cyanide bridges (at the C side). The Co3O4 oxide crystallizes in a direct spinel structure with the Co3+ ions in the Oh site and the Co2+ ones in the tetrahedral (Td) site; both Co ions are linked to O2− ions. In the case of monometallic PBAs, reference compounds are available for each single site. For instance, in the case of Co-PBA, the Co2+ site is analogous to the Co site in CoII4[FeIII(CN)6]2.7·20H2O PBA, while the Co3+ site resembles that in FeII4[CoIII(CN)6]2.7·20H2O PBA. However, in the case of the Co3O4 spinel or the transient states, such reference compounds are unavailable. The calcination of Co-PBA into Co3O4 is therefore an ideal case to test the opportunities offered by in situ site-selective XAS to follow complex chemical processes since at least four different sites are involved in the transformation (Co3+–CN (Oh), Co2+–NC (Oh), Co3+–O (Oh), Co2+–O (Td)) and the calcination completely redistributes the Co species. In this contribution we concentrate on the XANES (X-ray Absorption Near-Edge Structure) part of the X-ray absorption spectrum.
Experimental
Materials
Co-PBA (K0.1CoII4[CoIII(CN)6]2.7·20H2O) and a reference ex situ sample (obtained by the calcination of Co-PBA in air during 2 h hours at 900 °C, and called exsitu) were synthesized as described in ref. 21. The two Co4[Fe(CN)6]2.7·20H2O (called Co2+–N) and Rb2Co4[Fe(CN)6]3.3·11H2O (called Co3+–N) PBAs used as references were prepared as described in ref. 24. The other two reference compounds, [Co(OH2)6](NO3)2 (called Co2+–O) and K3[Co(CN)6] (called Co3+–C), were supplied by Sigma-Aldrich.X-ray spectroscopy
Co K-edge XANES spectra were recorded on the CRG-FAME (BM30B) beamline of the ESRF (Grenoble, France) using their five-crystal spectrometer.25 The energy of the incident radiation was selected using a pair of Si(220) crystals (flux of ca. 5.1011 photons s−1). Co Kβ site-selectivity was performed by recording the XANES spectra with spherically bent Ge(444) crystals in a Rowland geometry. The detector was a Silicon Drift Detector (energy resolution: 250 eV) in order to discriminate the signal diffracted by the crystals from the scattered one and so to improve the signal-to-noise ratio. Self-absorption effects were ruled out by diluting Co-PBA in BN and we checked that no radiation damage occurred by recording fast spectra as a function of time. The combined resolution of the incident beam and the spectrometer was ΔE = 0.6 eV, measured from the pseudo-elastic peak full-width at half-maximum. Spectra were simultaneously recorded in the transmission mode. The in situ calcination was achieved using a Cyberstar gas-blower furnace. Calibration of the furnace was performed prior to measurements and the temperature stability was checked during measurements. This setup is illustrated in Fig. 2.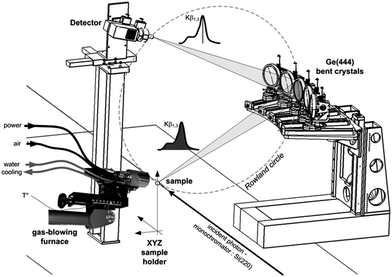 | ||
| Fig. 2 Experimental setup on the FAME beamline (BM30B, ESRF) for in situ site-selective XAS measurements. | ||
The X-ray emission spectrum of Co2+–O (resp. Co3+–C) was recorded at room temperature and was used to align the spectrometer for the +II (resp. +III) oxidation state. Data were acquired at seven temperatures from room temperature up to 400 °C. In the following text, only the spectra corresponding to the most relevant temperatures for the discussion (20 °C, 145 °C and 400 °C) are presented; for better clarity, the temperature is now specified next to the Co-PBA name (Co-PBA@temperature). For each temperature at which Co-PBA was investigated, a Co Kβ1,3 X-ray emission spectrum and Co K- edge X-ray absorption spectra for the two positions of the spectrometer were recorded. The X-ray absorption spectra of Co-PBA and of the references were also recorded in transmission mode at each investigated temperature.
Results and discussion
Formation of the targeted phase
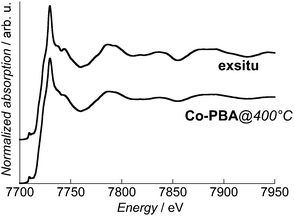
In order to attest the formation of the targeted Co3O4 phase during the in situ calcination process, the Co K-edge spectrum of exsitu was recorded. It is compared to the transmission spectrum of Co-PBA@400 °C in Fig. 3. A very good agreement is observed both between them and the Co3O4 spectra reported in the literature and in particular the maximum of the white line at 7729.4 eV.18,26,27 This agreement attests that the targeted Co3O4 phase was produced during the in situ chemical transformation of Co-PBA; this is also confirmed by X-ray diffraction (see ESI†). Therefore, the information obtained from the spectra recorded at the different temperatures actually reflects the processes involved in the calcination described in ref. 21. The slight differences in the relative intensities can be explained by a lower crystallinity for the in situ sample due to the lower temperature of calcination.In situ X-ray emission spectroscopy
A high-resolution spectrometer such as the one on FAME25 also enables us to perform X-ray emission spectroscopy (XES). This technique is well-known for its high-sensitivity to the spin state of transition metal ions11–16 and can be performed in situ.1,2,28–30 The Co Kβ1,3 X-ray emission spectra of Co-PBA as a function of temperature are displayed in Fig. 4, as well as the spectrum of exsitu. A shift of the maximum towards higher energy is observed upon heating and reveals a change in the Co species during the calcination process. However, it becomes clear that XES reaches a limit for the study of transformations in multisite compounds. The changes observed with the temperature are indeed (i) too small to enable a precise determination of the changes in the Co environment and (ii) averaged over the different species.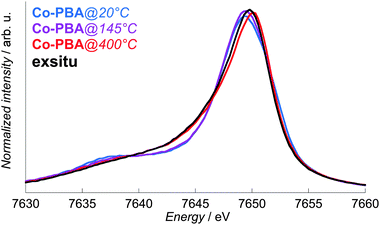 | ||
| Fig. 4 In situ normalized Co Kβ1,3 X-ray emission spectra of Co-PBA@20 °C, Co-PBA@145 °C and Co-PBA@400 °C, presented with the spectrum of exsitu. | ||
Extraction of the Co2+ and Co3+ pure contributions
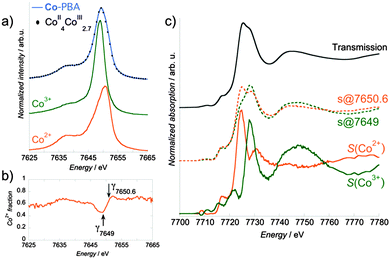
The Co Kβ1,3 X-ray emission spectrum of Co-PBA@20 °C is shown in Fig. 5a, along with those of the Co2+–O and Co3+–C references for the two sites of Co (called simply as Co2+ and Co3+ sites in the following text) in this compound. The important feature here is the shift in energy of the Kβ1,3 line maximum from 7650.6 eV for Co2+–O down to 7649 eV for Co3+–C. XANES spectra were therefore successively recorded using a spectrometer aligned at these two energies. However, it is clear from Fig. 5a that experimentally, one cannot record a pure site-selective X-ray absorption spectrum: whatever the energy chosen for the spectrometer, the spectrum includes a contribution from both sites. The pure Co2+ and Co3+ contributions for each temperature must consequently be extracted from the measured spectra at the two energies of the spectrometer. We describe now this procedure, which is illustrated in Fig. 5 for the 20 °C measurement. In the following text, the term ‘Kβ-HERFD X-ray absorption spectrum’ refers to the spectrum measured using the spectrometer, while the term ‘site-selective spectrum’ refers to the ‘pure’ Co2+ and Co3+ extracted contribution. The reader should keep in mind that the pure term is used here with the understanding that the spectra it refers to are obtained after deconvolution of two experimental spectra and were not directly measured as real pure spectra.First, from a linear combination of the normalized X-ray emission spectra of Co2+–O and Co3+–C wherein the Co2+![[thin space (1/6-em)]](https://www.rsc.org/images/entities/char_2009.gif) :
:![[thin space (1/6-em)]](https://www.rsc.org/images/entities/char_2009.gif) Co3+ ratio of the integrated intensity is 4
Co3+ ratio of the integrated intensity is 4![[thin space (1/6-em)]](https://www.rsc.org/images/entities/char_2009.gif) :
:![[thin space (1/6-em)]](https://www.rsc.org/images/entities/char_2009.gif) 2.7, we obtain the expected Kβ1,3 spectrum for a CoII4CoIII2.7 PBA; an excellent agreement is observed with the experimental spectrum of Co-PBA@20 °C (Fig. 5a). The Co2+ fraction is then determined as the ratio of the normalized spectrum of Co2+–O to the expected Kβ1,3 X-ray emission spectrum of CoII4CoIII2.7 PBA or of Co-PBA@20 °C (Fig. 5b). For the two positions of the spectrometer chosen to record the Kβ-HERFD X-ray emission spectra (at 7649 eV and 7650.6 eV), the value of the Co2+ fraction (γ7649 and γ7650.6; Fig. 5b) is determined. They are then used to extract the pure Co2+ and Co3+ site-selective spectra (S(Co2+) and S(Co3+)) by a linear combination of the measured Kβ-HERFD X-ray emission spectra (s@7649 and s@7650.6) (Fig. 5c):
2.7, we obtain the expected Kβ1,3 spectrum for a CoII4CoIII2.7 PBA; an excellent agreement is observed with the experimental spectrum of Co-PBA@20 °C (Fig. 5a). The Co2+ fraction is then determined as the ratio of the normalized spectrum of Co2+–O to the expected Kβ1,3 X-ray emission spectrum of CoII4CoIII2.7 PBA or of Co-PBA@20 °C (Fig. 5b). For the two positions of the spectrometer chosen to record the Kβ-HERFD X-ray emission spectra (at 7649 eV and 7650.6 eV), the value of the Co2+ fraction (γ7649 and γ7650.6; Fig. 5b) is determined. They are then used to extract the pure Co2+ and Co3+ site-selective spectra (S(Co2+) and S(Co3+)) by a linear combination of the measured Kβ-HERFD X-ray emission spectra (s@7649 and s@7650.6) (Fig. 5c):
This equation corresponds to a standard deconvolution of a multi-component system and was already used in previous site-selective XAS investigations.8,11,17
In order to assess the reliability of this extraction procedure, additional XANES spectra in the transmission mode were recorded for two references: Co3+–C and Co2+–N, where the Co ions are present in the same Oh Co3+ and Co2+ sites as those in Co-PBA@20 °C. An excellent agreement is observed between the site-selective spectra of Co-PBA@20 °C and the related references in transmission mode (Fig. 6). This indicates that the extraction procedure is reliable and it was therefore applied to all measured temperatures.
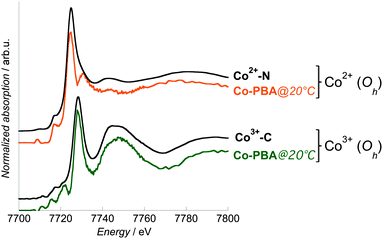 | ||
| Fig. 6 Co K-edge Co2+ and Co3+ site-selective spectra of Co-PBA@20 °C (orange line: Co2+ pure spectrum; green line: Co3+ pure spectrum) and transmission spectra of Co2+–N and Co3+–C (black lines). | ||
Evolution of the Co2+ and Co3+ contributions with temperature
In the following text, we do not discuss the pre-edge features of the site-selective spectra since the selection of the Co Kβ1,3 emission line to record the XANES spectrum may result in the modification of some spectral features in the pre-edge.18,31,32 The pre-edge measured using HERFD indeed corresponds to a constant emission energy cut in the resonant XES (RXES) plane11,33,34 and it was shown that such a scan may show features that are not actual absorption features.35 The reliable interpretation of the HERFD pre-edge thus requires the measurement and careful analysis of the full RXES plane,11,35 which was beyond the scope of this study. However, it is to be noted that the main edge region of the spectrum (above the pre-edge features) should mainly be affected by sharpening as compared to a conventional XANES spectrum. This is due to the resolution that has the order of magnitude of the core hole lifetime. Detailed discussion about this point can be found in ref. 11 and 33–35.The Co2+ and Co3+ site-selective XANES spectra of Co-PBA as a function of temperature and of exsitu are displayed in Fig. 7. At 20 °C, the shape of the spectra is the signature of the Co3+ (Fig. 6 and 7a) or Co2+ (Fig. 6 and 7b) ions in the two Oh sites of the PBA structure. Both Co-PBA@400 °C and exsitu consists of Co3O4; their site-selective Co3+ (Fig. 7a) and Co2+ (Fig. 7b) spectra are the first experimental signature of the single Co2+(Td) and Co3+(Oh) sites in the spinel structure. These experimental spectra of Co-PBA@400 °C and exsitu are also in quite good agreement with multiple-scattering calculations performed on Co3O4 by Jiang and Ellis.36
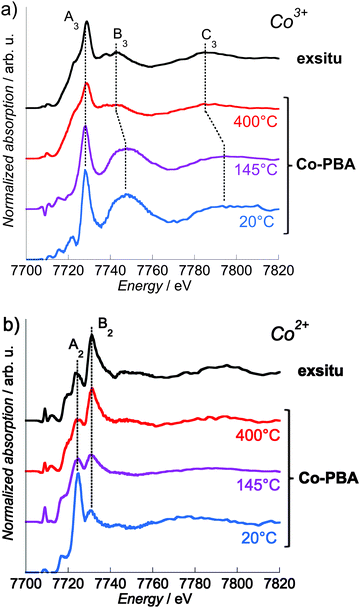 | ||
| Fig. 7 Co K-edge Co3+ (a) and Co2+ (b) pure site-selective XANES spectra of exsitu and Co-PBA (measured in situ at 20 °C, 145 °C and 400 °C). | ||
The pure Co2+ and Co3+ site-selective XANES spectra display significant changes with temperature (Fig. 7). In the case of Co3+ (Fig. 7a), the spectra at 20 °C and 145 °C are very close, indicating that this site of the PBA is not modified and that the Co3+ ion remains sixfold-coordinated to CN− ligands. At 400 °C the spectrum displays some modification, in particular for the B3 and C3 features. On the contrary the energy of the white line (7728.2 eV; peak A3) remains nearly constant. In Co3O4, the Co3+ cation is known to sit in the octahedral site, which is consistent with these spectral features observed at 400 °C and for exsitu. The high intensity of the B3 feature at 20 °C results from the significant multiple scattering (MS) in the Co3+–CN linkages.37–40 Its strong and abrupt intensity-decrease above 200 °C reveals the decomposition of the cyanide bridges already observed by previous thermodifferential and thermogravimetric analyses21 and is consistent with the lower MS in Co3O4. The shift towards the lower energy of the B3 and C3 features at 400 °C also reflects the lengthening of the Co-to-ligand bond expected for the Co3+–CN → Co3+–O transformation,41,42 according to Natoli's rule.43 These observations indicate that the Co3+ site mainly undergoes a change in the chemical nature of the neighbours, i.e. the abrupt replacement of the six C neighbours by the six O neighbours above 200 °C following the cyanide bridge decomposition.21 In contrast, in the case of Co2+ (Fig. 7b), a continuous evolution of the spectra is observed upon heating: at 145 °C, the relative intensity of the A2 and B2 features is almost 1![[thin space (1/6-em)]](https://www.rsc.org/images/entities/char_2009.gif) :
:![[thin space (1/6-em)]](https://www.rsc.org/images/entities/char_2009.gif) 1, and at 400 °C it is inverted with respect to the spectrum at 20 °C. These spectral changes upon heating are consistent with the progressive transformation from Co(NC)4(OH2)2 (20 °C) to Co3O4 (400 °C), probably via a Co(NC)4 transient state (145 °C). This transient state is supported by our previous thermogravimetric analyses, which showed the loss of water molecules above 90 °C.21 In addition to the determination of the steps of the transformation, this clearly different behavior of the two sites also shows that it is possible with site-selective XAS (i) to discriminate between active and inert species and (ii) to monitor the active species during the transformation.
1, and at 400 °C it is inverted with respect to the spectrum at 20 °C. These spectral changes upon heating are consistent with the progressive transformation from Co(NC)4(OH2)2 (20 °C) to Co3O4 (400 °C), probably via a Co(NC)4 transient state (145 °C). This transient state is supported by our previous thermogravimetric analyses, which showed the loss of water molecules above 90 °C.21 In addition to the determination of the steps of the transformation, this clearly different behavior of the two sites also shows that it is possible with site-selective XAS (i) to discriminate between active and inert species and (ii) to monitor the active species during the transformation.
Effect of the ligands
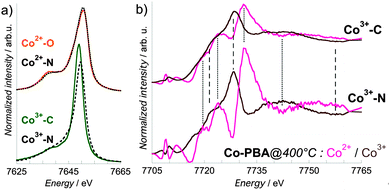
In this proof-of-principle in situ study, the successful extraction of the pure Co2+ and Co3+ site-selective spectra justifies a posteriori the use of only two references and consequently the recording of the spectra for only two energies (positions) of the spectrometer. It is known that for a given oxidation and spin state, the Kβ1,3 lines are also sensitive to the nature of the ligand,11,12,19 as illustrated in Fig. 8, where in addition to Co2+–O (Co2+(HS)–OH2 bond) and Co3+–C (Co3+(LS)–CN bond), two more references are displayed: Co2+–N for an average of four Co2+(HS)–NC and two Co2+(HS)–OH2 bonds, and Co3+–N24 for an average of five Co3+(LS)–NC and one Co3+(LS)–OH2 bonds. In the case of Co2+ (Fig. 7a, upper curves), the two Kβ1,3 X-ray emission spectra are almost superimposed, as expected by the close covalency of the Co2+(HS)–O and Co2+(HS)–N bonds. On the contrary, the Kβ1,3 X-ray emission spectra of Co3+–N and Co3+–C (Fig. 8a, lower curves) display significant differences, both in the spectral shape and in the energy of the maximum. This ligand-dependence of the Kβ1,3 X-ray emission spectrum makes preferable the choice of references with a covalency of the Co-to-ligand bond as close as possible as in the chemical species under study. Nevertheless, we observed here that whatever the choice of the reference compound, the position of the features of the site-selective spectra is not modified and that only their relative intensity varies (Fig. 8b). Measurements for as many spectrometer positions as required by the different oxidation state – spin state – covalency sites possibly found in the compound under investigation should strengthen the results. However, even if references are chosen only from the known states of the material under investigation, reliable results are still obtained from the site-selective XANES spectra. This point has to be noted, since the transient (and possibly the final) species are usually unknown.Conclusions
We present herein the first in situ site-selective XAS study, with an emphasis on the XANES part of the spectrum. We successfully managed to singly resolve the evolution of the Co2+ and Co3+ sites during the calcination of Co-PBA into Co3O4. The spectra of Co2+(Td) and Co3+(Oh) ions in Co3O4 were also singly recorded for the first time. Obtaining pure spectra for all the sites demonstrates again the power of site-selective XANES to investigate very complex samples such as the spinel family, which presents direct and inverse spinels as well as solid solutions. In addition, herein we showed that site-selective XANES experiments can innovatively be trustfully performed in situ, which opens new perspectives for the study of chemical transformation or materials under working conditions (catalytic systems, biological systems, materials used for data storage, battery, renewable energies, etc.).Acknowledgements
The authors warmly thank the ID26 beamline of the ESRF for the loan of their Ge(111) crystals, E. Lahera and I. Kieffer (OSUG and FAME beamline, Grenoble, France) for technical support and fruitful discussion. The gas-blowing furnace was borrowed to the Sample Environment Support Service of the ESRF. This work was supported by the C’Nano network via contract AF2012-a1-12 EPIMAGE. The adaptation of the spectrometer at 1 m was supported by a grant from Labex OSUG@2020 (Investissement d'avenir – ANR10 LABX56).Notes and references
- C. Garino, E. Borfecchia, R. Gobetto, J. van Bokhoven and C. Lamberti, Coord. Chem. Rev., 2014, 277–278, 130–186 CrossRef CAS.
- A. Boubnov, H. W. P. Carvalho, D. E. Doronkin, T. Günter, E. Gallo, A. J. Atkins, C. R. Jacob and J.-D. Grunwaldt, J. Am. Chem. Soc., 2014, 136, 13006–13015 CrossRef CAS PubMed.
- A. Gorczyca, V. Moizan, C. Chizallet, O. Proux, W. Del Net, E. Lahera, J.-L. Hazemann, P. Raybaud and Y. Joly, Angew. Chem., Int. Ed., 2014, 53, 1–5 CrossRef.
- F. F. Amalraj and D. Aurbasch, J. Solid State Electrochem., 2011, 15, 877–890 CrossRef.
- J. Singh, C. Lamberti and J. A. van Bokhoven, Chem. Soc. Rev., 2010, 39, 4754–4766 RSC.
- M. W. Kanan, J. Yano, Y. Surendranath, M. Dinca, V. K. Yachandra and D. G. Nocera, J. Am. Chem. Soc., 2010, 132, 13692–13701 CrossRef CAS PubMed.
- J. B. Leriche, S. Hamelet, J. Shu, M. Morcrette, C. Masquelier, G. Ouvrard, M. Zerrouki, P. Soudan, S. Bellin, E. Elkaïm and F. Baudelet, J. Electrochem. Soc., 2010, 157, A606–A610 CrossRef CAS.
- P. Glatzel, L. Jacquamet, U. Bergmann, F. de groot and S. Cramer, Inorg. Chem., 2002, 41, 3121–3127 CrossRef CAS PubMed.
- F. de Groot, Top. Catal., 2000, 10, 179–186 CrossRef CAS.
- M. Grush, G. Christou, K. Hämäläinen and S. Cramer, J. Am. Chem. Soc., 1995, 117, 5895–5896 CrossRef CAS.
- P. Glatzel and U. Bergmann, Coord. Chem. Rev., 2005, 249, 65–95 CrossRef CAS.
- U. Bergmann, C. R. Thorne, T. J. Collins, J. M. Workman and S. P. Cramer, Chem. Phys. Lett., 1999, 30, 119–124 CrossRef.
- N. Lee, T. Petrenko, U. Bergmann, F. Neese and S. DeBeer, J. Am. Chem. Soc., 2010, 132, 9715–9727 CrossRef CAS PubMed.
- R. Alonso-Mori, E. Paris, G. Giuli, S. G. Eeckhout, M. Kavcic, M. Zitnik, K. Bucar, L. G. M. Pettersson and P. Glatzel, Inorg. Chem., 2010, 49, 6468–6473 CrossRef PubMed.
- U. Bergmann and P. Glatzel, Photosynth. Res., 2009, 102, 255–266 CrossRef CAS PubMed.
- G. Vanko, T. Neisius, G. Molnar, F. Renz, S. Karpati, A. Shukla and F. de Groot, J. Phys. Chem. B, 2006, 110, 11647–11653 CrossRef CAS PubMed.
- T.-J. Kühn, J. Hormes, N. Matoussevitch, H. Bönnemann and P. Glatzel, Inorg. Chem., 2014, 53, 8367–8375 CrossRef PubMed.
- T.-J. Kühn, W. Caliebe, N. Matoussevitch, H. Bönnemann and J. Hormes, Appl. Organomet. Chem., 2011, 25, 577–584 CrossRef.
- C. Lambertz, P. Chernev, K. Klingan, N. Leidel, K. Sigfridsson, T. Happe and M. Haumann, Chem. Sci., 2014, 5, 1187–1203 RSC.
- N. Leidel, P. Chernec, K. Havelius, S. Ezzaher, S. Ott and M. Haumann, Inorg. Chem., 2012, 51, 4546–4559 CrossRef CAS PubMed.
- V. Trannoy, E. Delahaye, G. Fornasieri, P. Beaunier and A. Bleuzen, C. R. Chim., 2014, 17, 512–520 CrossRef CAS.
- H. J. Buser, D. Schwarzenbach, W. Peter and A. Lüdi, Inorg. Chem., 1977, 16, 2704–2710 CrossRef CAS.
- A. Lüdi and H. U. Güdel, Structure and Bonding, Spinger, Berlin, 1973, vol. 1, p. 21 Search PubMed.
- A. Bleuzen, C. Lomenech, V. Escax, F. Villain, F. Varret, Ch. Cartier dit Moulin and M. Verdaguer, J. Am. Chem. Soc., 2000, 122, 6648–6652 CrossRef CAS.
- I. Llorens, E. Lahera, W. Del Net, O. Proux, A. Braillard, J.-L. Hazemann, A. Prat, D. Testemale, Q. Dermigny, F. Gelebart, M. Morand, A. Shulkla, N. Bardou, O. Ulrich, S. Arnaud, J.-F. Bérar, N. Boudet, B. Caillot, P. Chaurand, J. Rose, E. Doelsch, Ph. Martin and P. L. Solari, Rev. Sci. Instrum., 2012, 83, 063104 CrossRef PubMed.
- Nanoparticles from the gas phase: Formation, Structure, Properties, ed. A. Lorke, M. Winterer, R. Schmechel and C. Schulz, Springer-Verlag, Berlin Heidelberg, 2012, p. 69 Search PubMed.
- J. T. Thienprasert, S. Klaithong, A. Niltharach, A. Worayingyong, S. Na-Phattalung and S. Limpijumnong, Curr. Appl. Phys., 2011, 11, S279–S284 CrossRef.
- G. Vanko, A. Bordage, P. Glatzel, E. Gallo, M. Rovezzi, W. Gawelda, A. Galler, Ch. Bressler, G. Doumy, A.-M. March, E. P. Kanter, L. Young, S. H. Southworth, S. E. Canton, J. Uhlig, G. Smolentsev, V. Sundström, K. Haldrup, T. B. van Driel, M. M. Nielsen, K. S. Kjaer and H. T. Lemke, J. Electron Spectrosc. Relat. Phenom., 2013, 188, 166–171 CrossRef CAS.
- G. Vanko, P. Glatzel, V.-T. Pham, R. Abela, D. Grolimund, C. N. Borca, S. L. Johnson, C. J. Milne and Ch. Bressler, Angew. Chem., Int. Ed., 2010, 49, 5910–5912 CrossRef CAS PubMed.
- J. Badro, J.-P. Rueff, G. Vanko, G. Monaco, G. Fiquet and F. Guyot, Science, 2004, 305, 383–386 CrossRef CAS PubMed.
- G. Vanko, F. M. F. de Groot, S. Huotari, R. J. Cava, T. Lorenz and M. Reuther, 2008, arXiv:0802.2744v1.
- D. Friebel, M. Bajdich, B. S. Yeo, M. W. Louie, D. J. Miller, H. Sanchez Casalongue, F. Mbuga, T.-C. Weng, D. Nordlund, D. Sokaras, R. Alonso-Mori, A. T. Bell and A. Nilsson, Phys. Chem. Chem. Phys., 2013, 14, 17460–17467 RSC.
- P. Glatzel, T.-C. Weng, K. Kvashnina, J. Swarbrick, M. Sikora, E. Gallo, N. Smolentsev and R. Alonso-Mori, J. Electron Spectrosc. Relat. Phenom., 2013, 188, 17–25 CrossRef CAS.
- M. Rovezzi and P. Glatzel, Semicond. Sci. Technol., 2014, 29, 023002 CrossRef.
- P. Glatzel, M. Sikora, G. Smolentsev and M. Fernandez-Garcia, Catal. Today, 2009, 145, 294–299 CrossRef CAS.
- T. Jiang and D. E. Ellis, J. Mater. Res., 1996, 11, 2242–2256 CrossRef CAS.
- A. Kuzmin and J. Purans, J. Phys.: Condens. Matter, 1993, 5, 267–282 CrossRef CAS.
- M. Giorgetti, M. Berrettoni, A. Filipponi, P. J. Kulesza and R. Marassi, Chem. Phys. Lett., 1997, 275, 108–112 CrossRef CAS.
- T. Yokoyama, T. Ohta, O. Sato and K. Hashimoto, Phys. Rev. B: Condens. Matter Mater. Phys., 1998, 58, 8257–8266 CrossRef CAS.
- Ch. Cartier dit Moulin, F. Villain, A. Bleuzen, M.-A. Arrio, Ph. Sainctavit, C. Lomenech, V. Escax, F. Baudelet, E. Dartyge, J.-J. Gallet and M. Verdaguer, J. Am. Chem. Soc., 2000, 122, 6653–6658 CrossRef CAS.
- P. G. Radaelli and S.-W. Cheong, Phys. Rev. B: Condens. Matter Mater. Phys., 2002, 66, 094408 CrossRef.
- N. A. Curry and W. A. Runciman, Acta Crystallogr., 1959, 12, 674–677 CrossRef CAS.
- C. Natoli, in EXAFS and Near-Edge Structure III, Springer proceedings in physics 2, ed. B. H. K. O. Hodgson and J. Penner-Hahn, Springer-Verlag, 1984, pp. 38–42 Search PubMed.
Footnote |
| † Electronic supplementary information (ESI) available: The X-ray diffraction pattern of the final phase. See DOI: 10.1039/c5cp02591e |
| This journal is © the Owner Societies 2015 |

