
 Open Access Article
 This Open Access Article is licensed under a
 Creative Commons Attribution 3.0 Unported Licence
The use of carbon monoxide as a probe molecule in spectroscopic studies for determination of exposed gold sites on TiO2†
Giacomo M.
Lari‡
,
Ewa
Nowicka
,
David J.
Morgan
 ,
Simon A.
Kondrat
and
Graham J.
Hutchings
*
,
Simon A.
Kondrat
and
Graham J.
Hutchings
*
Cardiff Catalysis Institute, School of Chemistry, Cardiff University, Main Building, Park Place, Cardiff, CF10 3AT, UK. E-mail: hutch@cardiff.ac.uk; Fax: +44 2920-874-030; Tel: +44 29 2087 4059
First published on 5th August 2015
Abstract
The sol immobilisation technique, in which a stabilising ligand (such as polyvinyl alcohol or polyvinyl pyridine) can be used to tune metal particle size and composition, has become a valuable method of making supported nanoparticle catalysts. An unfortunate consequence of the stabilising ligand is that often access of reactant molecules to the metal nanoparticle surface is impeded. Several methods have been proposed for the removal of these ligands, though determination of the degree of their success is difficult. Here, we demonstrate the use of in situ infrared and UV-Vis spectroscopy to elucidate the access of carbon monoxide to the surface of Au/TiO2 catalysts before and after various ligand removal treatments. These were contrasted with a catalyst prepared by deposition precipitation prepared in the absence of stabilising ligand as a control. Changes were observed in the infrared spectrum, with the wavenumber of carbon monoxide linearly bonded to Au for catalysts shifting before and after ligand removal, which correlated well with the activity of the catalyst for carbon monoxide oxidation. Also the extent of shifting of the Au surface resonance plasmon band on the addition of carbon monoxide, observed by UV-Vis, also correlated well with catalyst activity. These simple methods can be used to determine the quantity of exposed metal sites after a ligand removal treatment and so determine the treatments effectiveness.
Introduction
Supported gold catalysts have received considerable attention in the last decade, with the number of related publications increasing significantly since the seminal work by Haruta on sub-ambient CO oxidation and Hutchings on acetylene hydrochlorination.1,2 Supported gold catalysts have since been reported for many reactions, such as epoxidation,3 hydrogen peroxide synthesis,4 selective oxidation of hydrocarbons5 and alcohols.6 Catalytic activity of gold nanoparticles is known to be affected by a number of parameters, including metal support interactions and particle size. Therefore many methods, such as wet impregnation,7 incipient wetness,8 deposition precipitation,9 sol immobilization,10 colloidal deposition11 and physical grinding of acetate salts,12 have been developed. All of these methods have their significant advantages as well as disadvantages; for example the wet impregnation method is relatively simple method, but results in broad nanoparticle size distributions with some particles being >20 nm. On the other hand, the sol immobilization technique, which uses stabilising ligands (e.g.: polyvinyl alcohol (PVA) or polyvinyl pyridine (PVP)) to control particle size and distribution with great accuracy, has a different set of problems and challenges. Frequently the stabilizer ligands block the active sites and act as a physical barrier to the diffusion of reactants to the catalytically active metal surface. Though these catalysts have high activity, their full potential is often not realised until ligands have been removed by thermal decomposition, solvo-thermal treatments or electrochemical cleaning.13–15Thermal decomposition methods are effective for the removal of any stabilizing agent, though an inevitable side effect would be metal particle agglomeration. Hutchings and co-workers demonstrated the effective removal of PVA from titania-supported gold catalysts using a reflux method with water.16 However, the method was unsuccessful for the removal of PVP.16 An alternative approach reported by Ansar et al., who used treatment with NaBH4, successfully removed PVP and organothiols from gold sols as evidenced by surface enhanced Raman scattering and UV-Vis spectroscopy.17 This PVP removal process has, however, yet to be successfully demonstrated with supported stabilised nanoparticles.
The removal of capping molecules by various treatments and the subsequent accessibility of the metal surfaces is frequently determined by performing test catalytic reactions.18 Comparison of reaction results before and after treatment of catalysts is used to demonstrate the efficiency of the ligand removal procedure. Though this process is perhaps the most practical, as it focuses on the catalytic benefit of the treatment, it provides no direct information on ligand removal or ligand–metal interaction. Alternatively, spectroscopic techniques can be used to determine ligand concentration before and after treatment, with Hutchings and co-workers16 demonstrating a decrease in the intensity of Raman bands associated with PVA after the reflux treatment of catalysts in water.16 UV-Vis has also been used to monitor the desorption of PVP and organothiols from colloidal Au nanoparticles, induced by NaBH4 washing.17 Detailed spectroscopic analysis of the capping molecules is, however, often difficult, due to the relatively low concentrations of ligand within the catalyst. In addition, quantification of species adsorbed on surfaces, as is the case with capping agents, is challenging due to the effect of surface-capping agent interactions. A simpler method to determine changes in capping molecule concentration is the use of temperature programmed techniques, which is informative in providing evidence for absence of capping agent after treatment.19 However, temperature programmed techniques do not provide direct information on surface exposure or molecular access to the active site.
A third possibility in elucidating the effect of ligand removal treatment could be to selectively probe the metal nanoparticle itself with a suitable molecule. A recent study by Wu et al. noted in an in situ IR study that CO did not adsorb on Au thiolate clusters until the thiolate complexing agent was removed.20 The adsorption of CO on metal surfaces is very well known and has been well-studied with both infrared and ultraviolet-visible spectroscopy, and many studies correlate the adsorption spectra of CO/gold with the activity of the catalyst for CO oxidation. Yates et al., in the late 1960s, noted that a band associated with CO adsorbed on Au/SiO2 shifted to lower wavenumbers at higher CO partial pressures.21 Dumas et al. then showed, in pioneering vibrational spectroscopic studies, that the shift observed at higher coverage was formed from two components: a chemical one, due to adsorbate![[thin space (1/6-em)]](https://www.rsc.org/images/entities/char_2009.gif) :adsorbant interaction and a coupling component.22 A total shift of −13 cm−1 was observed from 2125 cm−1 at low coverage to 2112 cm−1 at higher coverages, with the chemical contribution accounting for −30 cm−1 and the coupling for +17 cm−1. Further studies in this field have investigated wider CO partial pressure ranges,23 a range of catalysts prepared by different techniques,24–26 CO adsorption on different Au surfaces,27 the effect of positively polarised sites on CO band position (shifts band to high 2128–2135 cm−1 range)28,29
:adsorbant interaction and a coupling component.22 A total shift of −13 cm−1 was observed from 2125 cm−1 at low coverage to 2112 cm−1 at higher coverages, with the chemical contribution accounting for −30 cm−1 and the coupling for +17 cm−1. Further studies in this field have investigated wider CO partial pressure ranges,23 a range of catalysts prepared by different techniques,24–26 CO adsorption on different Au surfaces,27 the effect of positively polarised sites on CO band position (shifts band to high 2128–2135 cm−1 range)28,29
Another technique which can be applied for studies of gold supported nanoparticles is UV-Vis spectroscopy, which can take advantage of the surface plasmon resonance (SPR) effect observed with gold. As a surface effect, the SPR frequency is very sensitive to changes in the environment and material structure making it very well suited for applications in gas sensing.30 Haruta and co-workers applied supported gold nanoparticles (Au/CuO and Au/Co2O3) as gas sensors for CO and H2.31–33 A linear relationship between CO concentration and variation in absorbance associated with SPR was established, with a small red shift of the band being observed on CuO. Sirinakis et al. also demonstrated the possibility of sensing CO at high temperature (above 400 °C) using gold on yttrium stabilised zirconia by monitoring the shift in frequency of the SPR.34
Here we report on the use of infra red and UV-Vis spectroscopy alone and also with CO as a probe molecule to determine the exposed Au coverage of 1 wt% Au/TiO2 catalysts, prepared by sol-immobilisation, before and after reflux or thermal treatment. The study extends the work of Wu et al.20 by correlating the IR CO band position to surface coverage as opposed to discrete data that notes only the presence or absence of CO adsorption. This will be coupled with in situ UV studies that correlate SPR band shifts, associated with CO surface concentration, to the exposed Au coverage. The initial work shows the limitation of IR and UV-Vis studies alone in determining changes on catalyst treatment. This is followed by in situ CO probe studies, which provide much more information on the exposure of Au sites after catalyst treatment.
Experimental
Materials
TiO2 (Degussa P25), was obtained from Evonik. PVA (MW 10000, 80% hydrolysed), PVP (MW 10000), NaBH4 were purchased from Sigma Aldrich, HAuCl4 was received from Johnson Matthey. Ammonium hydroxide (30 wt%) was purchased from Fisher Scientific. CO (5000 ppm in N2, 99.9%) was purchased from BOC. All chemicals were used as received.
Catalyst preparation: 1% Au/TiO2
Deposition precipitation catalysts were prepared using a method detailed in the literature.35 First, the required amount of gold solution (HAuCl4·3H2O, 6 mg ml−1) was added to 120 ml of deionized water and stirrer for 10 min. Then required amount of support (TiO2, 1.98 g) was added to the solution to form a slurry. The pH was adjusted to 9 with dropwise addition of 0.5 M NH4OH and the suspension was aged for 1 h at room temperature. After filtering and drying at 110 °C overnight, the catalysts were calcined at 300 °C for 4 h (ramp rate 20 °C min−1) in nitrogen.Sol immobilization catalysts were prepared following the well-established procedure reported previously.36 In a typical catalyst synthesis (1% Au/TiO2) aqueous solutions of HAuCl4·3H2O of the desired concentrations, stabilizing agent (PVA/PVP) (1 wt% aqueous solution) and an aqueous solution of NaBH4 (0.1 M) were prepared. To an aqueous HAuCl4 solution of the desired concentration, the required amount of a PVA solution (1 wt%) was added, followed by further addition of NaBH4 solution (0.1 M) to form a dark purple sol. After 30 min of sol generation, the colloid was immobilized by addition of the support material (TiO2, Degussa P25). After 1 h of stirring, 2 drops of concentrated H2SO4 was added to bring the solution to pH 2–3. After 2 h, the slurry was filtered, and the catalyst was washed thoroughly with 2 l of distilled water (until the mother liquor was neutral pH), followed by drying step at 120 °C overnight.
Catalyst treatment
For standard solvent treatment the following protocol was used: catalyst (250 mg) was placed in a round bottomed flask (250 ml) equipped with magnetic stirrer, condenser and water (125 ml). The mixture was heated to 90 °C in an oil bath and the treatment performed for 30, 60, 120, 240 min. The powder was recovered by filtration and dried at 110 °C for 16 h. If calcination was carried out, the catalyst was calcined in static air for 4 h at different temperatures (20 °C min−1 ramp rate).Catalyst testing
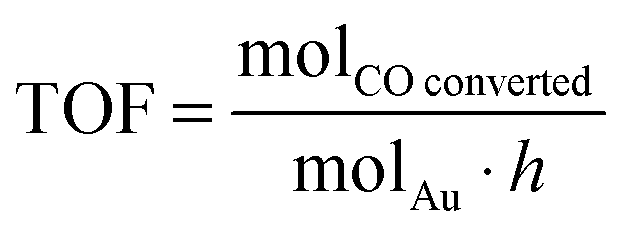
Catalysts were investigated for CO oxidation using a fixed bed glass reactor with 3 mm internal diameter placed in a thermostatic bath (25 °C). 5000 ppm CO in air was fed to the reactor at rate controlled by electronic mass flow controllers and passed over the catalyst (35 mg). CO oxidation product were analysed using a GC (1.5 m packed carbosieve column) equipped with an automated injection valve and a thermo conductivity detector (TCD).TOF (turnover frequency) is expressed as:
Diffuse reflectance infrared Fourier transform spectroscopy (DRIFT)
All DRIFT spectra were recorded on a Bruker Tensor 27 spectrometer fitted with a HgCdTe (MCT) detector and a Harrick Praying Mantis HVC-DRP-4 cell equipped with KBr windows with the following settings: 64 scans, resolution 2 cm−1, aperture 4 mm in the 600 to 4000 cm−1 range. Spectra were compensated for gas phase water. Typically, the catalyst was placed in the cell in a nitrogen flow (50 ml min−1) and the background recorded. The flow composition was changed to 1% CO/N2 or 1% CO/air and a spectrum recorded after 10 min stabilization time. The resultant spectra were obtained through subtraction with a spectrum obtained from flowing 1% CO/N2 over KBr. This was done to remove gas phase CO bands from the spectra.Diffuse reflectance UV-Vis spectroscopy
Reflectance UV-Vis spectra were recorded on a Varian Cary 4000 spectrophotometer equipped with a Harrick Praying Mantis HVC-DRP-4 cell. The catalyst was placed in the cell and spectra were recorded in N2, air, 1% CO/N2 or 1% CO/air (50 ml min−1).X ray photoelectron spectrscopy (XPS)
XPS measurements were made on a Kratos Axis Ultra DLD spectrometer using monochromatic Al Kα radiation (120 W source power). An analyser pass energy of 160 eV was used for survey scans, while 40 eV was employed for detailed regional scans. Samples were mounted using double-sided adhesive tape, and binding energies were referenced as discussed in the text.Transmission electron microscopic (TEM)
Analysis was performed in a JEOL 2100 TEM instrument. The powdered samples were dispersed in deionised water before being added to holey carbon film on copper grids. EDX analysis was performed using Oxford Instruments SDD detector XmaxN 80T and analysed using Aztec software. Particle size distributions were determined using ImageJ software and min 350 particles for one sample were counted.Results and discussion
To illustrate the effective use of CO as a probe to elucidate the effectiveness of capping agent removal treatments, we have reproduced the methodology for removal of PVA from sol immobilised Au/TiO2, under reflux conditions using water, as reported by Hutchings and co-workers.16 In addition we applied the same protocol for Au/TiO2 catalysts prepared with PVP capping agent. Therefore 1 wt% Au/TiO2 made by sol immobilization and stabilised by PVA (SI-PVA) or PVP (SI-PVP) were both treated with water at 90 °C for a range of times. As a control experiment to investigate the effect of reflux treatment on “naked” supported Au particles (i.e. supported gold nanoparticles formed in the absence of any stabiliser ligands), Au/TiO2 was also prepared by deposition precipitation (DP) and subjected to the same reflux treatment.Fig. 1 shows the effect of the reflux treatment time on the subsequent catalysts capability to oxidise CO at ambient temperature. This provides an indication to the effectiveness of the reflux treatment and provides a point of correlation with pre-existing literature on PVA removal.16 The substantial improvement in activity with 30 min reflux treatment observed for SI-PVA correlates well to previous studies. Interestingly, increasing reflux time to greater than 2 h resulted in a decrease in activity of the SI-PVA catalyst. The catalyst prepared by DP also showed deactivation upon prolonged treatment in water, demonstrating that the reflux treatment slowly changes the nature of Au particles. When SI-PVP catalyst was treated with water, no activity for CO oxidation was observed, implying that the treatment was ineffective at removing the capping agent. One of the reasons for the inefficiency of the water treatment on the PVP-stabilized catalyst is the higher degree of interaction between polymer and the gold nanoparticles. This can be explained by the ‘softer’, i.e. more polarizable, behaviour of the nitrogen lone pair, that determines its higher affinity with gold.
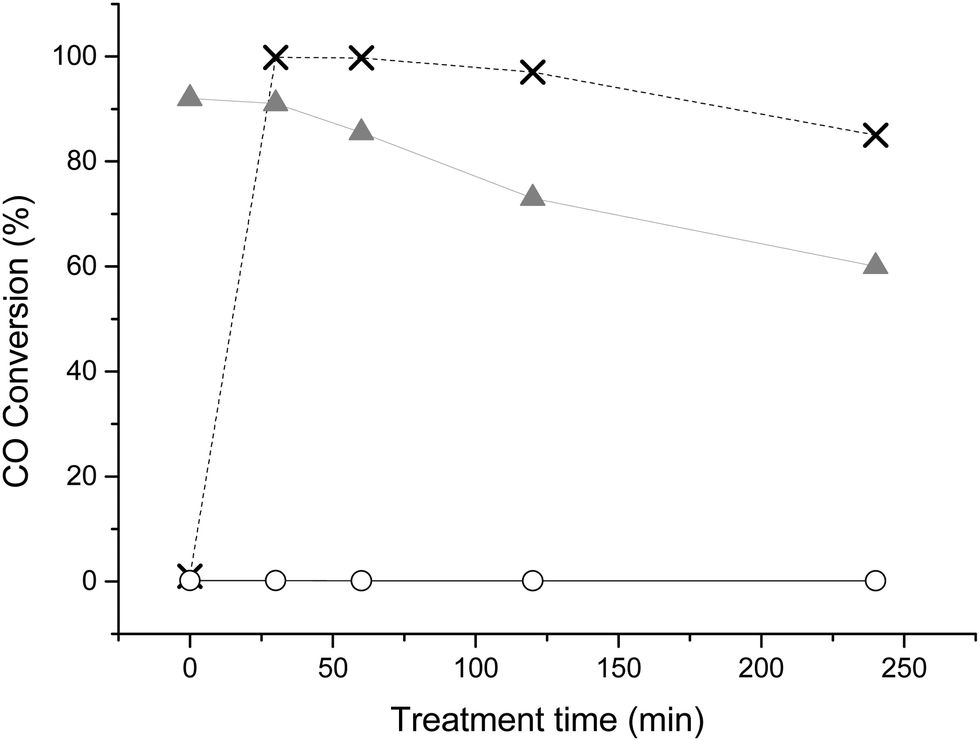 | ||
Fig. 1 TOF as a function of catalyst treatment time under reflux conditions (GHSV = 12000 h−1, catalyst (35 mg), t = 30 min, treatment performed at 90 °C). SI-PVA: ×, SI-PVP: ○, DP:  . . | ||
One of the most effective methods of capping agent removal is catalyst calcination. However, elevated temperatures will result in metal migration and consequently particle sintering, negating the effect of capping agent removal.37 Thermal treatment in air has been reported to enhances the performance of PVA-stabilised Au nanoparticles (AuNPs) in the oxidation of CO and also the removal of PVP from PVP-stabilised Pt nanoparticles using calcination at 500 °C, though it was demonstrated that decomposition products were still present on the nanoparticles.38 The Au/TiO2 catalysts prepared in this study were subjected to calcination performed at different temperatures, with the results for CO oxidation reported in Fig. 2. The results show that the calcination treatment is partially effective in activating the 1 wt% Au/TiO2 catalyst for CO oxidation. In the case of polymer-stabilized catalysts a minimum temperature of 500 °C calcination is required to activate them for CO oxidation. The effect of calcination on the activity of the DP catalyst is immediately apparent, with activity dropping significantly after 300 °C calcination. It is well known that increasing the calcination temperature of Au/TiO2 leads to an increase in particle size, resulting in a lower amount of active sites and inactive gold particles.25,39 It is interesting to note that SI-PVP showed higher activity when calcined at 500 °C than the DP or SI-PVA catalyst. This is possibly due two factors, the first being the higher decomposition temperature of PVP, i.e. an increased stabilising effect of the metal particles, and the second the presence of different decomposition products on the metal, leading to a higher degree of poisoning in the case of the PVA stabilised catalyst.38,40
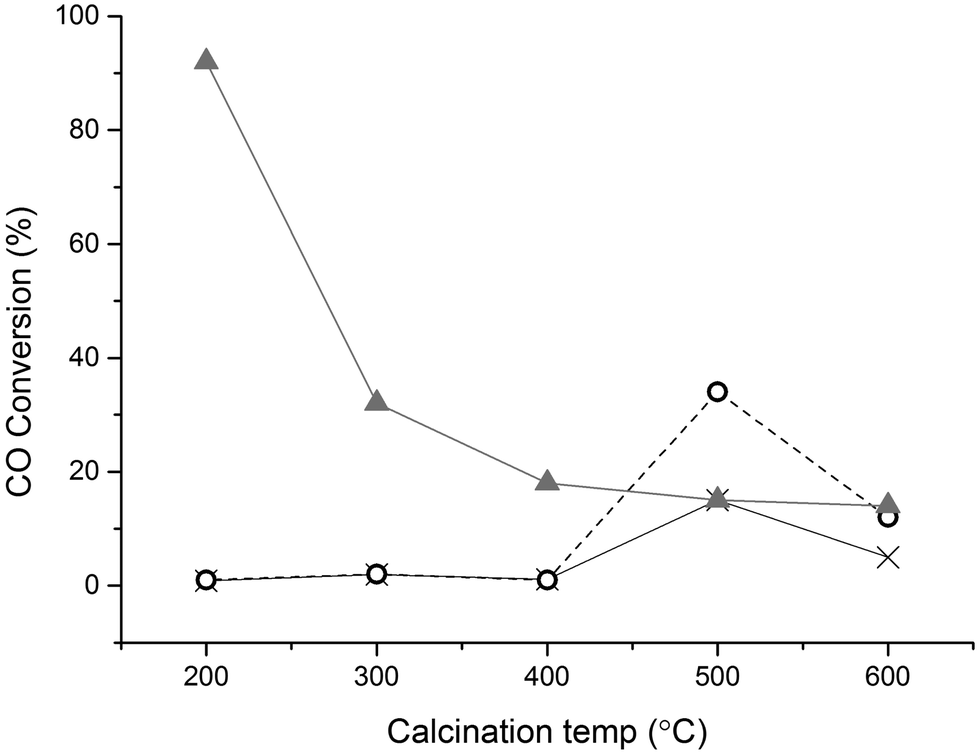 | ||
Fig. 2 Influence of the calcination temperature on catalyst activity in CO oxidation reaction; NC: not calcined, SI-PVP: ○, SI-PVA: ×, DP:  Reaction conditions: T = 294 K, GHSV = 12000. Calcination time 4 h, ramp rate 20 °C min−1, t = 30 min. Reaction conditions: T = 294 K, GHSV = 12000. Calcination time 4 h, ramp rate 20 °C min−1, t = 30 min. | ||
TEM analysis (Table 1) of the freshly prepared catalysts, refluxed for 1 h and calcined at 500 °C was performed to gain an insight into changes in particle size with respect to treatment and catalyst type. Both PVA and PVP sol-immobilisation preparations and the deposition precipitation preparation gave the expected small Au particle size and narrow size distributions, observed previously.41,42 Refluxed catalysts were all found to have a slightly increased mean particle size, though the degree of agglomeration was not consistent between preparation techniques. SI-PVA Au particle size increased by a marginal 4% after reflux treatment, the SI-PVP a more significant 23% particle size increase and the DP a greater increase of 49%. Even greater particle size increases were observed on 500 °C calcination with all catalysts having mean particle sizes of ca. 4 nm. XPS analysis of all catalysts before and after treatments showed that the surface Au species where consistently metallic Au0 (Au 4f binding energies of 83.4 eV ± 0.2 eV) (ESI,† Fig. S1)
| Catalyst preparation | Treatment | Mean (nm) | IR CO banda (cm−1) | UV SPR shifta (Δ nm) |
|---|---|---|---|---|
| a Data is an average of 3 experiments with the associated error being the standard deviation. SI-PVA (sol immobilization-PVA), SI-PVP (sol Immobilization-PVP), DP (deposition precipitation), refluxed for 1 h at 90 °C, calcined at 500 °C, 4 h. | ||||
| SI-PVA | Fresh | 1.9 | 2122 (±1.0) | 3.6 (±0.6) |
| Refluxed | 2.0 | 2106 (±1.0) | 9.8 (±2.1) | |
| Calcined | 3.9 | 2116 (±0.3) | 7.5 (±1.0) | |
| SI-PVP | Fresh | 2.1 | n/a | 0.4 (±0.6) |
| Refluxed | 2.6 | 2122 (±3.8) | 2.1 (±0.9) | |
| Calcined | 4.3 | 2113 (±2.1) | 5.9 (±2.1) | |
| DP | Fresh | 2.0 | 2106 (±0.8) | 10.3 (±0.7) |
| Refluxed | 2.9 | 2107 (±1.7) | 8.1 (±0.8) | |
| Calcined | 3.9 | 2112 (±1.5) | 5.9 (±1.3) | |
DRIFTS of all catalysts primarily showed bands associated with TiO2 and physisorbed water. In addition bands associated with PVA and PVP (C–N, O–H and C–H modes) can be detected in the 1500–1430 cm−1 region (ESI,† Fig. S2). These weak bands were found to disappear after heat treatment at 500 °C, which correlates with the improved CO oxidation activity. The effect of the reflux treatments were much harder to determine with very little change being observed for the SI-PVA catalyst before and after treatment. From the CO oxidation data it is evident that the reflux treatment is successful in exposing Au sites. This demonstrates the insensitivity of this technique in determining subtler changes in ligand concentration.
Information about the local environment of the gold particles could be determined from the SPR band using diffuse reflectance UV-Vis. The wavelength range between 500 to 600 nm, where the SPR band of Au nanoparticles is frequently observed,43 was monitored for the fresh and treated catalysts (Fig. 3). The plasmon band position arises from the interaction of an electromagnetic wave whose frequency matches that of the surface electrons. As discussed in the introduction, its position is influenced by many parameters such as polarization of the metal, adsorption of molecules and size/shape of the metal nanoparticles.30 SPR positions in the three untreated catalysts are similar with only small (5 nm) variance between samples. It is known that both sol-immobilization and deposition precipitation techniques provide particles with a low aspect ratio and with similar particle size distributions.41,42,44 The similar particle sizes observed by TEM (Table 1) for these catalysts correlate well with the literature and also the relative invariance of SPR position observed by UV-Vis.
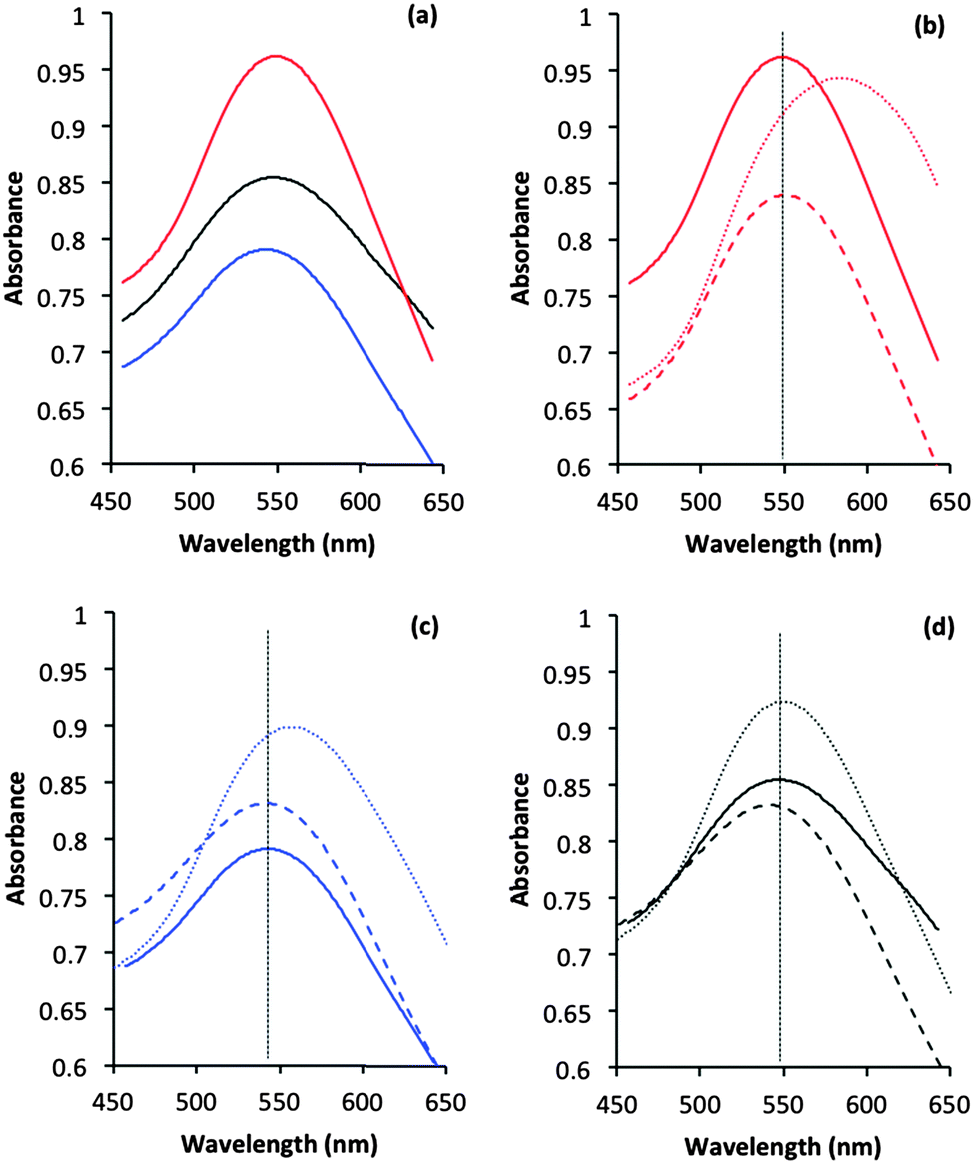 | ||
| Fig. 3 Diffuse reflectance UV-Vis spectra of the Au/TiO2 catalysts before and after thermal and reflux treatments. (a) Comparison of Au plasmon bands from SI-PVP (red), SI-PVA (blue) and DP (black) catalysts before treatment. (b–d) Comparison of original Au plasmon band (solid line), the plasmon band after reflux (dashed line) and calcination (dotted line) treatments for SI-PVA (b), SI-PVA (c) and DP (d) catalysts. Vertical black dotted lines in (b–d) highlight original band positions before treatments. | ||
The position of the SPR band for all catalysts did not change position (within error) after the water treatment (Fig. 3). The catalytic data (Fig. 1) demonstrated that PVA was removed from the SI-PVA catalyst after water reflux treatment, while the strongly bound PVP was not. Taking this into account the SPR position has been shown to be relatively insensitive to changes in capping agent concentration. Substantive changes in SPR band position were observed in the case of the calcined sol-immobilisation catalysts, with an evident red shift after calcination. Intriguingly there was no comparable change in SPR band position on calcination of the DP catalyst. The relatively small observed increase in particle sizes from TEM of ca. 2 nm to 4 nm would not be expected to result in a significant red shift, as previous studies that correlated the particle size effect on SPR noted changes over differences of 10–40 nm Au particle size, which are much more significant increase than we observe.43 The significant SPR shift seen with the sol-immobilised catalysts could be associated with residual species from the decomposition of the PVA or PVP protecting ligands on calcination. It is clear that shifts in SPR are not sufficiently sensitive to detect changes in ligand concentration after reflux treatments and are also complicated by other factors, as observed for the SPR band shifts with the calcined catalysts.
Information obtained from direct measurements of the catalysts by DRIFT and UV-Vis spectroscopy did not provide direct evidence of changes in Au coverage by capping agents. The only evidence for effective capping agent removal was from the CO oxidation data, which as previously discussed cannot be unequivocally attributed to capping agent removal. Therefore, we investigated the effect of capping agent removal treatments on the adsorption of the probe molecule CO onto Au.
Exposure of the Si-PVA, SI-PVA and DP Au/TiO2 catalysts to a 1% CO/N2 was monitored by DRIFTS, with band positions associated with CO adsorbed on the Au nanoparticles being shown in Table 1 (the spectra are shown in Fig. S3 (ESI†)). The DP catalyst provides an effective model system with which to correlate potential changes in the Au-CO IR bands before and after treatment by factors unrelated to capping agents. Such as changes due to growth in Au particle size, enhanced metal support interactions and the formation of polarised Au sites.22 The latter can mostly be discounted as XPS showed no change in Au binding energy for DP Au/TiO2 or the other catalysts after ligand removal treatments.
No change in CO band position was observed between the untreated and refluxed DP catalysts. However, calcination of the DP Au/TiO2 catalyst at 500 °C, resulted in a discernible (greater than the determined error of measurements (ca. ±1.5)) +5.5 cm−1 change in CO band position in relation to the untreated catalyst. This could be attributed to enhanced metal-support interaction on 500 °C heat treatment or the increase in particle size.
It is interesting to note that the fresh untreated SI-PVA material adsorbed CO, while showing no activity for CO oxidation. This is plausible as the gold surface is not completely covered by the polymer, and that CO could interact with the surface. However, access is clearly hindered as demonstrated by lower values of activity in the CO oxidation reaction and that the band for adsorbed CO is located at a much higher wavenumber (2116 cm−1) than for the untreated DP catalyst (2106 cm−1). This high wavenumber absorbance for CO on SI-PVA indicates a low CO coverage of the metal surface, i.e. a smaller active surface. Water reflux treatment of the SI-PVA catalyst results in a clear and sharp CO band at a lower wavenumber relative to untreated SI-PVA, equivalent to that seen for CO on the DP catalyst. This indicates a higher coverage of the surface with most of the surface is available for CO adsorption and oxidation, when in the presence of oxygen. Calcination of the SI-PVA catalyst resulted in a CO band wavenumber slightly lower than the untreated SI-PVA, indicating increased chemical interaction between bound CO due to an increase in exposed Au sites. However, this blue shift was mediated by the increase in Au particle size as observed on calcination of the DP catalyst.
The SI-PVP catalyst does not show any bands for adsorbed CO in the case of the untreated catalyst. The coverage of the surface by PVP seems more complete, and that is possibly due to the stronger polymer–gold interaction. Treatment in water does have a slight influence on the layer of polymer, with a weak CO band at high a wavenumber of 2122 cm−1. The very high wavenumber position of this band suggests a very low surface coverage of CO. This is in good agreement with the catalytic data (Fig. 1). The only treatment that significantly modifies the adsorption properties of the SI-PVP catalyst is the calcination. CO binds to surface of gold with the band located at 2113 cm−1, a wavenumber similar to all the calcined catalysts.
It is possible to correlate the wavenumber of adsorbed CO, indicative of the coverage of the Au particle by CO, with the catalytic data for CO oxidation (Fig. 4). This shows that only the catalysts where the adsorbed CO band is present at wavenumbers lower than 2116 cm−1 are active for the oxidation of CO. Below this threshold a strong relationship between activity and CO band wavenumber is observed, with the most active catalyst having the lowest frequency CO band. According to the results reported by Boccuzzi et al. this trend could be explained by the different coverage of CO within the 2102–2115 cm−1 region (13 cm−1) shift, while more blue shifted bands seen for untreated SI-PVA are to be attributed to partially positive Auδ+ sites.25 Of note is that such Auδ+ sites have been reported to be present in catalysts that have very low activity for CO oxidation.29,45 Therefore, while there is a compelling case to associate increases in activity with only an increase in Au exposure (i.e. increased CO coverage and corresponding chemical shift) changes in the charge of Au sites cannot be ignored. XPS suggests that there is no significant charged Au species on any of the catalysts and that the changes in Au exposure are the predominant reason for the CO band positions.
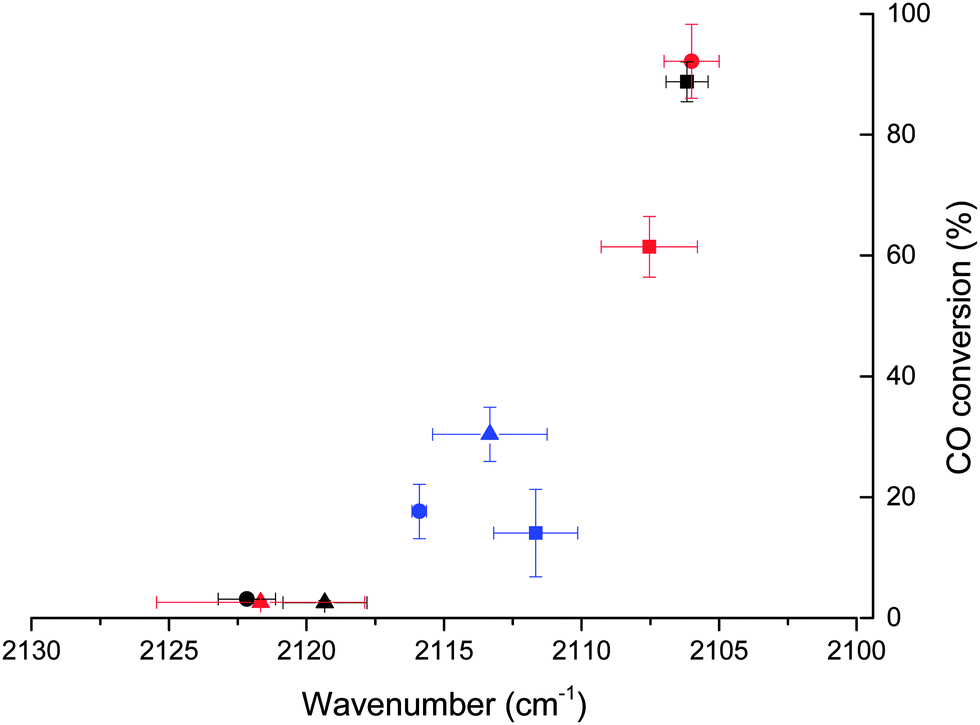 | ||
| Fig. 4 CO conversion plotted against position of the adsorbed CO-band in DRIFT. Key: ■ DP, ● SI-PVA and Δ SI-PVP catalysts. Black symbols denote as prepared catalysts, red symbols after 1 h reflux and blue symbols after 500 °C heat treatment. | ||
CO as a probe molecule: a UV-Vis study
As discussed in the introduction an alternative method of elucidating CO concentration has been to monitor the shift in the Au SPR after exposure. Therefore we explored the possibility of using this effect to monitor the accessibility of CO on the Au surface. As with the studies for CO probe in situ IR spectroscopy, we initially investigated the DP catalyst as a control sample. The UV-Vis spectra of the DP catalyst was first taken under an atmosphere of flowing N2 before the gas was switched to 1% CO/N2 and the UV-Vis spectra taken again (Fig. 5 and Table 1). A noticeable blue shift of 10.3 nm was observed upon addition of CO, which shown to be reversible when the atmosphere reverted back to pure N2. This is similar to observations by Sirinakis et al. for Au supported on yttrium stabilised zirconia, but interestingly the current shift was observed at room temperature, while the previous paper used a temperature of 400 °C.34 Hypotheses about the causes of this shift are an injection of charge into the nanoparticle by carbon monoxide or a change in the dielectric constant and of the refractive index of the nanoparticle's environment. After similar experiments on the refluxed and calcined DP samples it was observed that the blue shift, on the addition of CO to the system, was less significant with these samples. A shift of 8.1 and 5.9 nm was observed for the refluxed and calcined DP samples respectively. The observed blue SPR shifts correlated well with the observed particle sizes from TEM analysis, with a linear decrease in SPR shift with particle size (Fig. 6).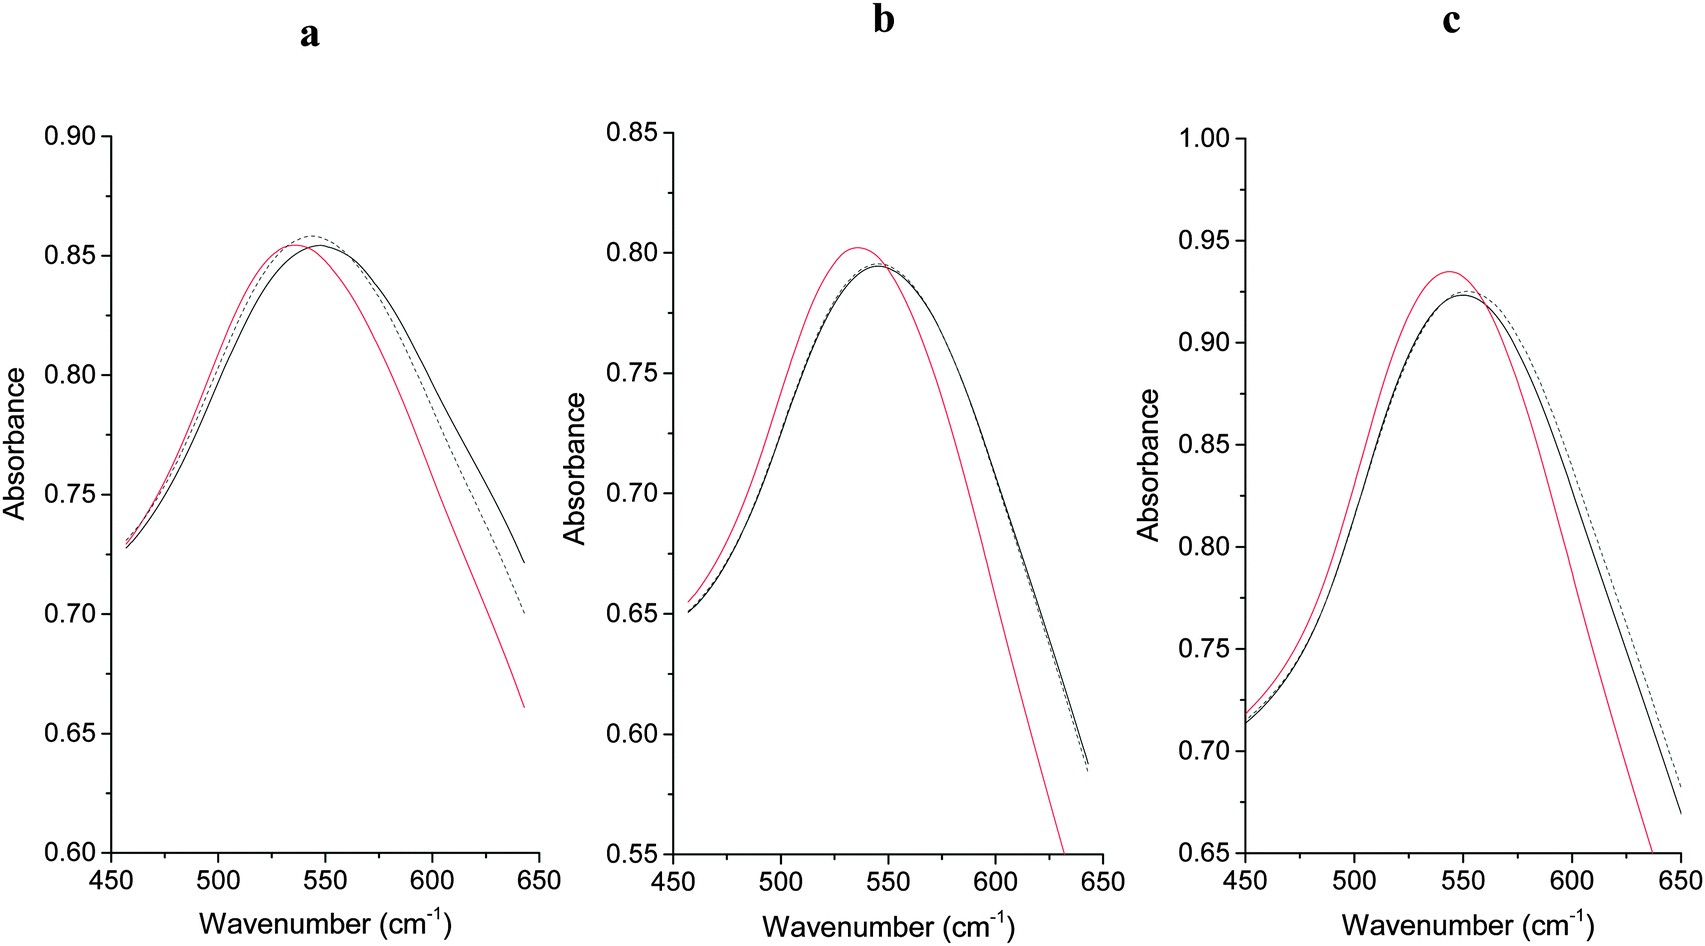 | ||
| Fig. 5 UV-Vis analysis of catalyst under N2 (black), 0.5% CO/N2 (red) and returning to a N2 (black dots) environment: 1 wt% Au/TiO2 catalysts before treatment (a), after 1 h reflux (b) and calcination at 500 °C (c). | ||
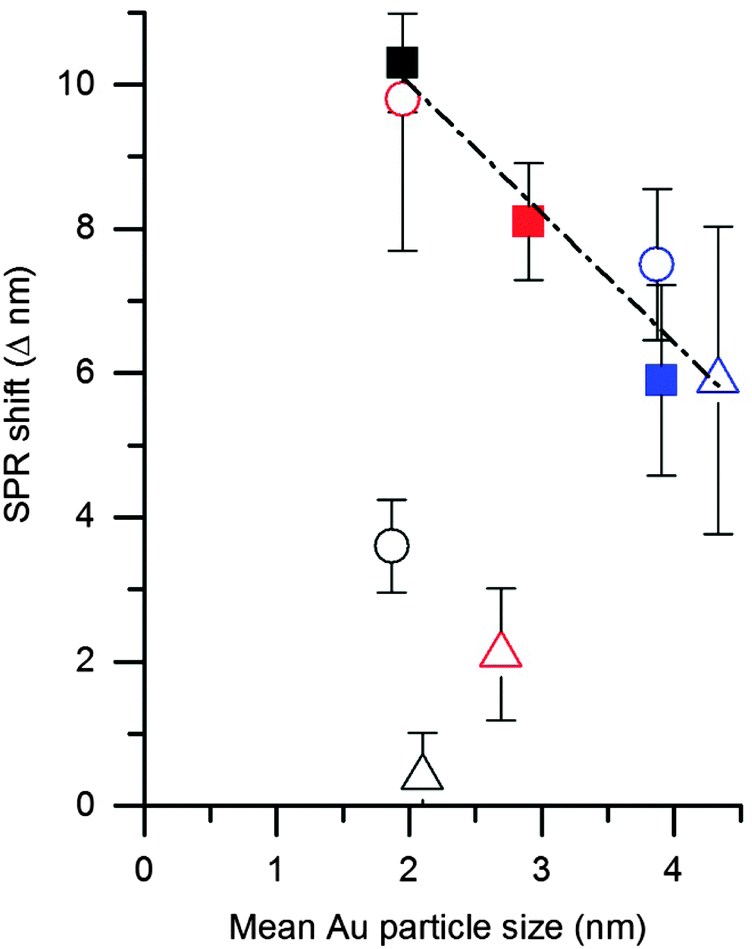 | ||
| Fig. 6 Correlation of change in Au SPR on addition of 1% CO/N2 with Au mean particle size (determined by TEM). Key: ■ DP, ● SI-PVA and Δ SI-PVP catalysts. Black symbols denote as prepared catalysts, red symbols after 1 h reflux and blue symbols after 500 °C heat treatment. | ||
The blue SPR shift observed for the SI-PVA catalysts (Table 1 and Fig. S4, ESI†) did not show the same correlation with particle size as observed with the DP catalysts, with the untreated SI-PVA showing the lowest SPR shift despite having the smallest particle size. This is not surprising, as CO has limited interaction with the Au surface due to the PVA ligand hindering access. As with the DRIFTS study the slight SPR shift indicates that the Au surface is not totally inaccessible, though it is significantly obstructed. After reflux treatment the SPR shift increases to a value comparable with the untreated DP catalyst, providing direct evidence that the reflux treatment on SI-PVA increases accessibility of Au sites. Calcination of the SI-PVA resulted in an increased Au surface exposure to CO, relative to the untreated sample, but this is limited by the increase in particle size.
As with SI-PVA the SPR shift observed for the SI-PVP catalyst (Table 1 and Fig. S4, ESI†) did not show the same trend with particle size (as seen for the DP catalyst) due to a similar blocking of CO access to Au by the PVP ligand. As noted with the DRIFTS study the PVP Au sites appear to be almost entirely inaccessible on the untreated sample, with almost no SPR shift observed. Reflux treatment did result in a small SPR shift being observed, though this was still smaller than that seen for untreated SI-PVA. This corresponds to previous observations that reflux treatments on PVP stabilised Au nanoparticles is ineffectual. Only after the ligand has been removed by calcination did the SPR shift become discernible.
Taking the above observations into account it can be seen that all catalysts with effective CO access to the Au surface lie on the same trend line when plotting ΔSPR vs. mean Au particle size (Fig. 7), while those with poor CO accessibility do not follow the same correlation. The plasmon shift observed upon addition of CO can also be correlated with the activity of the catalyst for ambient CO oxidation (Fig. 7). The relationship between greater SPR shift and higher CO oxidation activity corroborates with the relationship between IR band position and activity, showing that accessibility of Au sites can be determined by UV-Vis and IR studies with CO as a probe molecule.
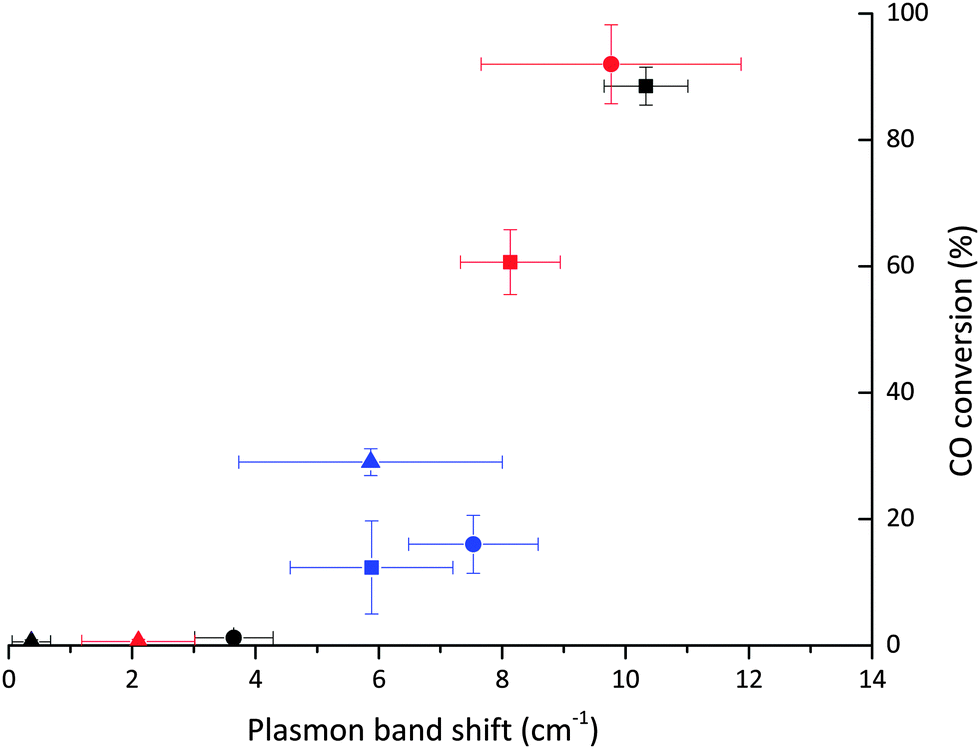 | ||
| Fig. 7 CO conversion as a function of the plasmon shift for 1% Au/TiO2 catalysts between N2 and CO/N2. Key: ■ DP, ● SI-PVA and Δ SI-PVP catalysts. Black symbols denote as prepared catalysts, red symbols after 1 h reflux and blue symbols after 500 °C heat treatment. | ||
Conclusions
A range of 1 wt% Au/TiO2 catalysts prepared by sol-immobilisation with PVA and PVP stabilising ligands and a control deposition precipitation prepared 1 wt% Au/TiO2 catalyst were subjected to reflux and thermal treatments. The fresh and treated catalysts were tested for CO oxidation. As expected the DP catalyst was most active before any treatment while the PVA catalyst became active after the reflux treatment but the PVP catalyst remained inactive, until a calcination treatment. Ex situ DRIFTS and UV-Vis spectroscopic analysis provided limited information on the effect of ligand removal treatments. DRIFTS showed a loss of bands associated with the polymer after calcination but the subtler effects of reflux treatment could not be followed, due to the weak nature of the original polymer bands. Ex situ UV-Vis spectroscopy showed changes in the position of the Au surface plasmon band after treatment but a number of complicated factors, such as residual carbon deposition after calcination, made association with ligand removal unfeasible. In situ DRIFTS with CO as a probe molecule, showed that the band position of CO adsorbed on Au shifted between 2106 and 2122 cm−1 depending on the catalyst and the ligand removal treatment. Shifts were attributed to changes in CO interaction in relation to surface coverage, with lower wavenumber bands being associated with higher CO coverage. In situ UV-Vis spectroscopy showed that a reversible shift in the SPR occurred on the addition of CO gas to the Au/TiO2 catalysts. Here the CO surface coverage could be correlated to the size of the SPR shift on CO addition, greater SPR shift correlating with increased CO coverage. Both techniques can therefore be applied to determining the success of ligand removal treatments by monitoring the change in accessible Au sites for CO adsorption. Correlation of SPR shift or CO band position in IR with activity for CO oxidation showed that increased CO surface coverage corresponded with higher CO conversion, validating the methods as a way of monitoring the effectiveness of ligand removal.Acknowledgements
We would like to acknowledge the support of the UK Catalysis Hub. Also we would like to acknowledge Dr Georgi Lalev (Cardiff University, School of Optometry and Vision Sciences) for the transmission electron microscopy.References
- M. Haruta, T. Kobayashi, H. Sano and N. Yamada, Chem. Lett., 1987, 405–408, DOI:10.1246/cl.1987.405
.
- G. J. Hutchings, J. Catal., 1985, 96, 292–295 CrossRef CAS
- T. Hayashi, K. Tanaka and M. Haruta, J. Catal., 1998, 178, 566–575 CrossRef CAS
- J. K. Edwards, B. Solsona, E. N. N, A. F. Carley, A. A. Herzing, C. J. Kiely and G. J. Hutchings, Science, 2009, 323, 1037–1041 CrossRef CAS PubMed
- M. D. Hughes, Y. J. Xu, P. Jenkins, P. McMorn, P. Landon, D. I. Enache, A. F. Carley, G. A. Attard, G. J. Hutchings, F. King, E. H. Stitt, P. Johnston, K. Griffin and C. J. Kiely, Nature, 2005, 437, 1132–1135 CrossRef CAS PubMed
- A. Abad, P. Concepcion, A. Corma and H. Garcia, Angew. Chem., Int. Ed., 2005, 44, 4066–4069 CrossRef CAS PubMed
- D. I. Enache, J. K. Edwards, P. Landon, B. Solsona-Espriu, A. F. Carley, A. A. Herzing, M. Watanabe, C. J. Kiely, D. W. Knight and G. J. Hutchings, Science, 2006, 311, 362–365 CrossRef CAS PubMed
- C. Baatz and U. Pruesse, J. Catal., 2007, 249, 34–40 CrossRef CAS PubMed
- R. Zanella, S. Giorgio, C. R. Henry and C. Louis, J. Phys. Chem. B, 2002, 106, 7634–7642 CrossRef CAS
- N. Dimitratos, A. Villa, C. L. Bianchi, L. Prati and M. Makkee, Appl. Catal., A, 2006, 311, 185–192 CrossRef CAS PubMed
- N. Dimitratos, F. Porta and L. Prati, Appl. Catal., A, 2005, 291, 210–214 CrossRef CAS PubMed
- S. A. Kondrat, G. Shaw, S. J. Freakley, Q. He, J. Hampton, J. K. Edwards, P. J. Miedziak, T. E. Davies, A. F. Carley, S. H. Taylor, C. J. Kiely and G. J. Hutchings, Chem. Sci., 2012, 3, 2965–2971 RSC
- M. Comotti, C. Della Pina, R. Matarrese and M. Rossi, Angew. Chem., Int. Ed., 2004, 43, 5812–5815 CrossRef CAS PubMed
- M. Comotti, C. Della Pina, E. Falletta and M. Rossi, Adv. Synth. Catal., 2006, 348, 313–316 CrossRef CAS PubMed
- Z. Niu and Y. Li, Chem. Mater., 2014, 26, 72–83 CrossRef CAS
- J. A. Lopez-Sanchez, N. Dimitratos, C. Hammond, G. L. Brett, L. Kesavan, S. White, P. Miedziak, R. Tiruvalam, R. L. Jenkins, A. F. Carley, D. Knight, C. J. Kiely and G. J. Hutchings, Nat. Chem., 2011, 3, 551–556 CrossRef CAS PubMed
- S. M. Ansar, F. S. Ameer, W. Hu, S. Zou, C. U. Pittman Jr and D. Zhang, Nano Lett., 2013, 13, 1226–1229 CrossRef CAS PubMed
- S. O. Blavo, E. Qayyum, L. M. Baldyga, V. A. Castillo, M. D. Sanchez, K. Warrington, M. A. Barakat and J. N. Kuhn, Top. Catal., 2012, 1–8 Search PubMed
- S. Albonetti, A. Lolli, V. Morandi, A. Migliori, C. Lucarelli and F. Cavani, Appl. Catal., B, 2015, 163, 520–530 CrossRef CAS PubMed
- Z. Wu, D.-e. Jiang, A. K. P. Mann, D. R. Mullins, Z.-A. Qiao, L. F. Allard, C. Zeng, R. Jin and S. H. Overbury, J. Am. Chem. Soc., 2014, 136, 6111–6122 CrossRef CAS PubMed
- D. Yates, J. Colloid Interface Sci., 1969, 29, 194–204 CrossRef CAS
- P. Dumas, R. Tobin and P. Richards, J. Electron. Spectrosc. Relat. Phenom., 1986, 39, 183–189 CrossRef CAS
- J. France and P. Hollins, J. Electron. Spectrosc. Relat. Phenom., 1993, 64, 251–258 CrossRef
- F. Boccuzzi, A. Chiorino, S. Tsubota and M. Haruta, J. Phys. Chem., 1996, 100, 3625–3631 CrossRef CAS
- F. Boccuzzi, A. Chiorino, M. Manzoli, P. Lu, T. Akita, S. Ichikawa and M. Haruta, J. Catal., 2001, 202, 256–267 CrossRef CAS
- F. Boccuzzi, S. Tsubota and M. Haruta, J. Electron. Spectrosc. Relat. Phenom., 1993, 64, 241–250 CrossRef
- C. Ruggiero and P. Hollins, J. Chem. Soc., Faraday Trans., 1996, 92, 4829 RSC
- M. A. Bollinger and M. A. Vannice, Appl. Catal., B, 1996, 8, 417–443 CAS
- J.-D. Grunwaldt, M. Maciejewski, O. S. Becker, P. Fabrizioli and A. Baiker, J. Catal., 1999, 186, 458–469 CrossRef CAS
- P. Mulvaney, Langmuir, 1996, 12, 788–800 CrossRef CAS
- M. Ando, T. Kobayashi, S. Iijima and M. Haruta, J. Mater. Chem., 1997, 7, 1779–1783 RSC
- M. Ando, T. Kobayashi, S. Iijima and M. Haruta, Sens. Actuators, B, 2003, 96, 589–595 CrossRef CAS
- M. Ando, T. Kobayashi and M. Haruta, Catal. Today, 1997, 36, 135–141 CrossRef CAS
- G. Sirinakis, R. Siddique, I. Manning, P. H. Rogers and M. A. Carpenter, J. Phys. Chem. B, 2006, 110, 13508–13511 CrossRef CAS PubMed
- P. J. Miedziak, Q. He, J. K. Edwards, S. H. Taylor, D. W. Knight, B. Tarbit, C. J. Kiely and G. J. Hutchings, Catal. Today, 2011, 163, 47–54 CrossRef CAS PubMed
- S. Meenakshisundaram, E. Nowicka, P. J. Miedziak, G. L. Brett, R. L. Jenkins, N. Dimitratos, S. H. Taylor, D. W. Knight, D. Bethell and G. J. Hutchings, Faraday Discuss., 2010, 145, 341–356 RSC
- S. Albonetti, T. Pasini, A. Lolli, M. Blosi, M. Piccinini, N. Dimitratos, J. A. Lopez-Sanchez, D. J. Morgan, A. F. Carley, G. J. Hutchings and F. Cavani, Catal. Today, 2012, 195, 120–126 CrossRef CAS PubMed
- Y. Du, P. Yang, Z. Mou, N. Hua and L. Jiang, J. Appl. Polym. Sci., 2006, 99, 23–26 CrossRef CAS PubMed
- E. D. Park and J. S. Lee, J. Catal., 1999, 186, 1–11 CrossRef CAS
- O. W. Guirguis and M. T. Moselhey, Nat. Sci., 2012, 4, 57–67 CAS
- M. Haruta, Catal. Today, 1997, 36, 153–166 CrossRef CAS
- N. Dimitratos, J. A. Lopez-Sanchez, D. Morgan, A. Carley, L. Prati and G. J. Hutchings, Catal. Today, 2007, 122, 317–324 CrossRef CAS PubMed
- S. Eustis and M. A. El-Sayed, Chem. Soc. Rev., 2006, 35, 209–217 RSC
- M. Haruta, S. Tsubota, T. Kobayashi, H. Kageyama, M. J. Genet and B. Delmon, J. Catal., 1993, 144, 175–192 CrossRef CAS
- S. Daniells, A. Overweg, M. Makkee and J. Moulijn, J. Catal., 2005, 230, 52–65 CrossRef CAS PubMed
Footnotes |
| † Electronic supplementary information (ESI) available. See DOI: 10.1039/c5cp02512e |
| ‡ Present address: Institute for Chemical and Bioengineering, ETH Zurich, Vladimir-Prelog-Weg 1, CH-8093 Zurich, Switzerland. |
| This journal is © the Owner Societies 2015 |