Development and applications of the LFDFT: the non-empirical account of ligand field and the simulation of the f–d transitions by density functional theory†‡
Received
22nd April 2015
, Accepted 11th June 2015
First published on 15th June 2015
Abstract
Ligand field density functional theory (LFDFT) is a methodology consisting of non-standard handling of DFT calculations and post-computation analysis, emulating the ligand field parameters in a non-empirical way. Recently, the procedure was extended for two-open-shell systems, with relevance for inter-shell transitions in lanthanides, of utmost importance in understanding the optical and magnetic properties of rare-earth materials. Here, we expand the model to the calculation of intensities of f → d transitions, enabling the simulation of spectral profiles. We focus on Eu2+-based systems: this lanthanide ion undergoes many dipole-allowed transitions from the initial 4f7(8S7/2) state to the final 4f65d1 ones, considering the free ion and doped materials. The relativistic calculations showed a good agreement with experimental data for a gaseous Eu2+ ion, producing reliable Slater–Condon and spin–orbit coupling parameters. The Eu2+ ion-doped fluorite-type lattices, CaF2:Eu2+ and SrCl2:Eu2+, in sites with octahedral symmetry, are studied in detail. The related Slater–Condon and spin–orbit coupling parameters from the doped materials are compared to those for the free ion, revealing small changes for the 4f shell side and relatively important shifts for those associated with the 5d shell. The ligand field scheme, in Wybourne parameterization, shows a good agreement with the phenomenological interpretation of the experiment. The non-empirical computed parameters are used to calculate the energy and intensity of the 4f7–4f65d1 transitions, rendering a realistic convoluted spectrum.
Introduction
The concept of the ligand field, very fruitful in the effective account of bonding and properties in coordination chemistry, is equivalent to the crystal field theory in condensed matter science. Both terminologies refer to the same phenomenological model, operated with adjustable parameters.
Born more than eighty years ago, from the work of H. Bethe1 and J. H. van Vleck2 it still keeps the position of the most transparent way to describe the optical and magnetic properties of metal ion-based systems (lattices or molecular complexes). As long as quantum chemical methods can compute reliable energy level schemes, the subsequent ligand field analysis of the raw results is the way to illuminate in depth the underlying mechanism.3–5Stricto sensu, the ligand field refers to effective one-electron parameters accounting for the effect of the environment on a metal ion, but the complete frame includes the inter-electron effects, describing the electronic correlation in the active space of dn or fn configurations, and also the spin–orbit coupling, namely the relativistic effects. Besides the standard theory, one must note the paradigm shift due to C. E. Schäffer and C. K. Jørgensen, who revisited the ligand field theory to ensure more chemical insight within their Angular Overlap Model (AOM), initially devoted to the d-type transition metal systems.6 W. Urland pioneered this model for the f-type ligand field, in lanthanide compounds, with convincing applications in spectroscopy and magnetism.7
About two decades ago, given the important growth of computational techniques, the demand for a predictive theory compatible with the classical formalism of the ligand field theory emerged. In particular, this is not a trivial task in the frame of density functional theory (DFT), limited to non-degenerate ground states, while ligand field concerns the full multiplets originating from dn or fn configurations. In the consistent solving of this problem, C. Daul erat primus. He and co-workers (noting the contribution of M. Atanasov) designed a pioneering approach by non-routine handling of DFT numeric experiments, to extract ligand field parameters, in a post-computational algorithm named LFDFT.8–10 The procedure treats the near degeneracy correlation explicitly within the model space of the Kohn–Sham orbitals possessing dominant d and f characters.
In LFDFT, the basic start is a DFT calculation performed in average of configuration (AOC) conditions. Namely, for a given dn (or fn) configuration of the metal ion in the complex, the occupation of five (or, respectively, seven) Kohn–Sham orbitals carrying main d (or f) character is fixed to the general fractional n/5 (or n/7, respectively) numbers. This corresponds to the barycentre conceived in formal ligand field theories. Subsequently, with the converged AOC orbitals, a series of numeric experiments are done, producing the configurations related to the distribution of n electrons in the five (or seven) orbitals identified as the ligand field sequence (this time with corresponding integer populations). These determinant configurations are not real states, but useful computational experiments, able to render ligand field parameters. The situation is somewhat similar to broken symmetry treatments,11–14 where the spin-polarized configurations cannot be claimed as physical states, but artificial constructions relevant for the emulation of the exchange coupling parameters.15 Then, the LFDFT run of different configurations based on AOC orbitals yields ligand field parameters, altogether with inter-electron Coulomb and exchange effective integrals. Thus, the Slater determinants are used as the basis in the computational model. In the advanced background of the theory, a canonical number of configurations needed to reproduce the desired parameters can be defined as a function of the symmetry of the problem (Slater determinant wavefunctions of spin–orbitals weighted by symmetry coefficients).10 In practice, the full set of configurations can be generated, performing the least square fit relating the computed energy expectation values against the ligand field model formulas. The obtained parameters are further used in setting configuration interaction (CI) matrices, in the spirit of the ligand field formalism, sustained in a non-empirical manner. Therefore C. Daul et al. have realized the parameter-free ligand field theory, which became a valuable tool for any consideration of multiplet states in DFT.
We recognize herein the impact of the LFDFT in solving various electronic structure problems. This computational gadget has revolutionized many fields of chemical science, being applied in theoretical investigations16–20 as well as in experimental works.21,22
A priori, LFDFT has determined the multiplet energy levels within an accuracy of a few hundred wavenumbers.23 The model has given satisfactory results for the molecular properties arising from a single-open-shell system, such as zero-field splitting (ZFS),24,25 magnetic exchange coupling,26–29 Zeeman interaction,30 hyper-fine splitting,30 shielding constants,31,32 d–d and f–f transitions.10,17,33,34
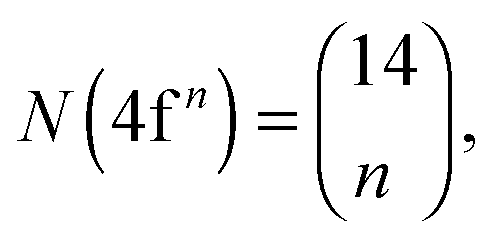
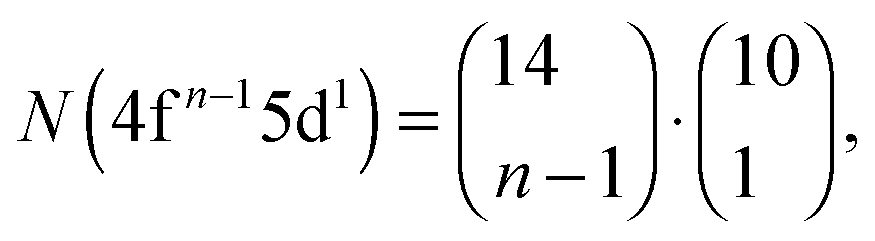
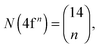
Recently, the LFDFT algorithm has been updated to handle the electronic structure of two-open-shell systems, as it is important in the understanding of the optical manifestation of lanthanide phosphors.35,36 Lanthanide compounds are agents in light-emitting diode (LED) technology, used in domestic lighting.37 In the case of a two-open-shell inter-configuration of f and d electrons, the size of the ligand field CI matrices is collected in Table 1, calculated with the following combinatorial formulas:
| |  | (1) |
| |  | (2) |
as a function of the number of active electrons (
n). We can confine to a single f–d orbital promotion, since the energy of two and further electron processes is too high. It is seen from
Table 1 that the size of the CI matrices increases drastically, for some cases (
n = 7 or 8) a parallelized algorithm having been required to achieve calculations.
Table 1 Total number of generated Slater determinants corresponding to the 4fn and 4fn−15d1 electron configurations of lanthanide ions with n valence electrons
|
n
|
1 |
2 |
3 |
4 |
5 |
6 |
7 |
8 |
9 |
10 |
11 |
12 |
13 |
14 |
|
∑ represents the cumulative sum of N(4fn) and N(4fn−15d1).
|
|
N(4fn) |
14 |
91 |
364 |
1001 |
2002 |
3003 |
3432 |
3003 |
2002 |
1001 |
364 |
91 |
14 |
1 |
|
N(4fn−15d1) |
10 |
140 |
910 |
3640 |
10![[thin space (1/6-em)]](https://www.rsc.org/images/entities/char_2009.gif) 010 010 |
20020 |
30030 |
34320 |
30030 |
20020 |
10010 |
3640 |
910 |
140 |
| ∑a |
24 |
231 |
1274 |
4641 |
12012 |
23023 |
33462 |
37323 |
32032 |
21021 |
10374 |
3731 |
924 |
141 |
In this paper, we present new development and applications of the LFDFT algorithm, previously validated for the two-open-shell 4f15d1 electronic structure of Pr3+.35,38–40 Special attention will be paid to Eu2+ systems, i.e. for n = 7 (Table 1), taking as examples divalent europium doped in the fluorite-type lattices CaF2 and SrCl2, comparing the first principles results with the available experimental data.41,42
Methodology
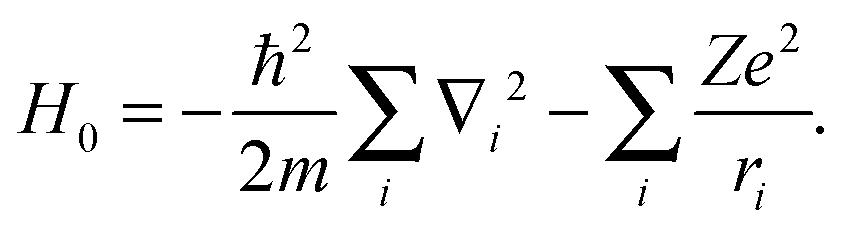
The two-open-shell ligand field-based CI Hamiltonian in eqn (3) combines quantum effects due to the inter-electron repulsion and exchange (HEE), the spin–orbit coupling (HSO) and the ligand field effective one-electron (HLF):35| | | H = H0 + HEE + HSO + HLF, | (3) |
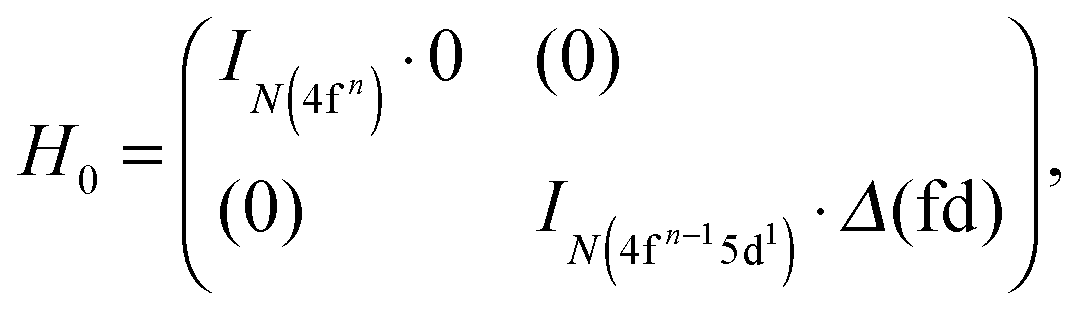
where H0 is a diagonal matrix, which gathers contributions of zeroth-order interactions, such as the kinetic energy background and the nuclear–electron attraction of the AOC configuration:| | 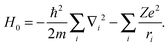 | (4) |
This term acts only on the diagonal of the full ligand field CI matrix:| | 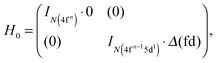 | (5) |
where IN is an identity matrix of dimension N (see Table 1) and Δ(fd) is the gap parameter, which determines the energy difference between the barycentre of the multiplet levels of the excited 4fn−15d1 and of those of the ground 4fn electron configuration. Therefore, in further consideration, the HEE, HSO and HLF matrices are simply traceless blocks, their possible diagonal elements already engulfed in Δ(fd).
The matrix elements of HEE are constructed from the two-electron integrals:
| | 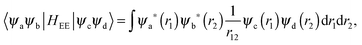 | (6) |
where
ψ denotes the atomic orbital wavefunctions:
| | | ψ(r) = Rnl(r)Ylm(θ,ϕ), | (7) |
Rnl is the radial wavefunction of the atomic shell and
Ylm is the spherical harmonic component. It is a basic assumption of the ligand field framework that the two-electron part can be treated like in the free atom.
35
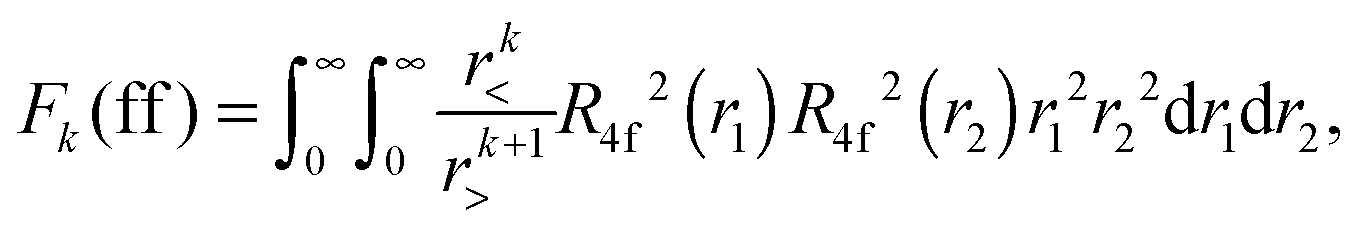
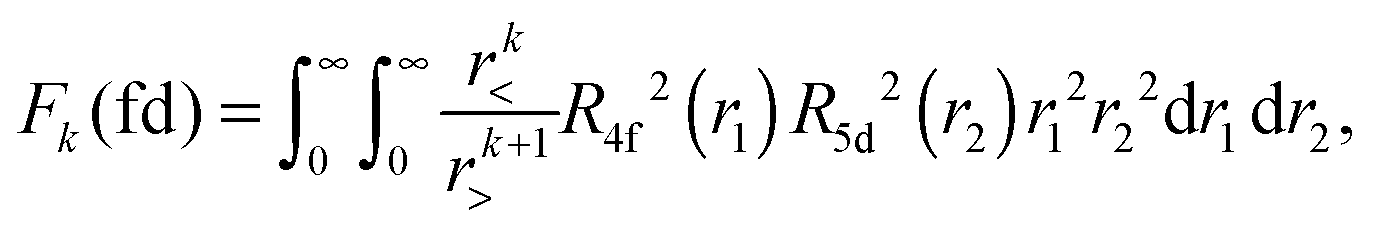
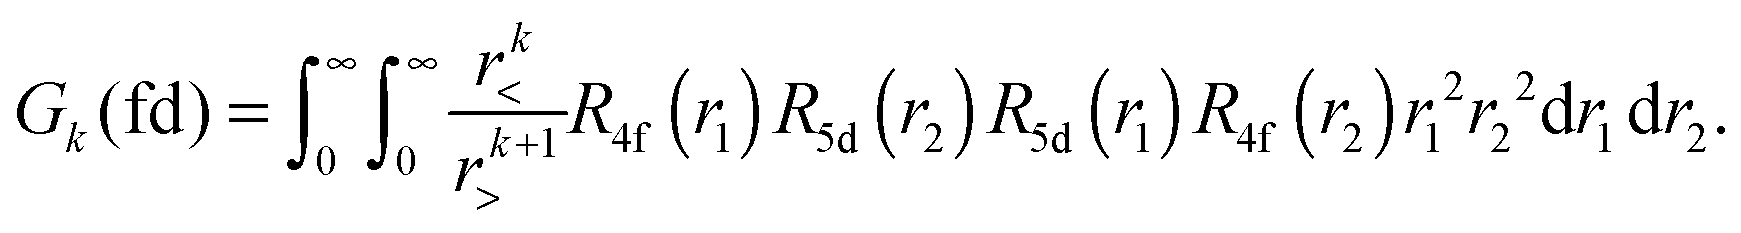
Within mathematical operations, eqn (6) is reducible into the product of two integrals of angular and radial components. Once the angular part is explicitly resolved, the whole variety of the eqn (6) integrals can be represented by a few radial Slater–Condon parameters, Fk (eqn (8) and (9)) and Gk (eqn (10)), with intra- or inter-shell nature. In the two-open-shell problem of 4f and 5d electrons, one obtains:
| |  | (8) |
| | 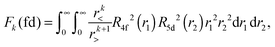 | (9) |
| | 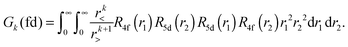 | (10) |
The matrix elements of
HSO express the spin–orbit structure of the electronic multiplets. The formulation of
HSO has been the subject of numerous investigations
3,43–45 where its matrix elements have been reasonably well approximated in atomic-like integrals:
| | 〈nlsmlms|HSO|nls′ml′ms′〉 = ζnl〈lsmlms|![[l with combining circumflex]](https://www.rsc.org/images/entities/i_char_006c_0302.gif) .ŝ|ls′ml′ms′〉, .ŝ|ls′ml′ms′〉, | (11) |
where
ζnl is the effective one-electron spin–orbit coupling constants for one electron in a
nl atomic shell. It can be analytically evaluated using the radial wavefunction
Rnl of the atomic shell:
| | 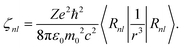 | (12) |
The matrix elements of
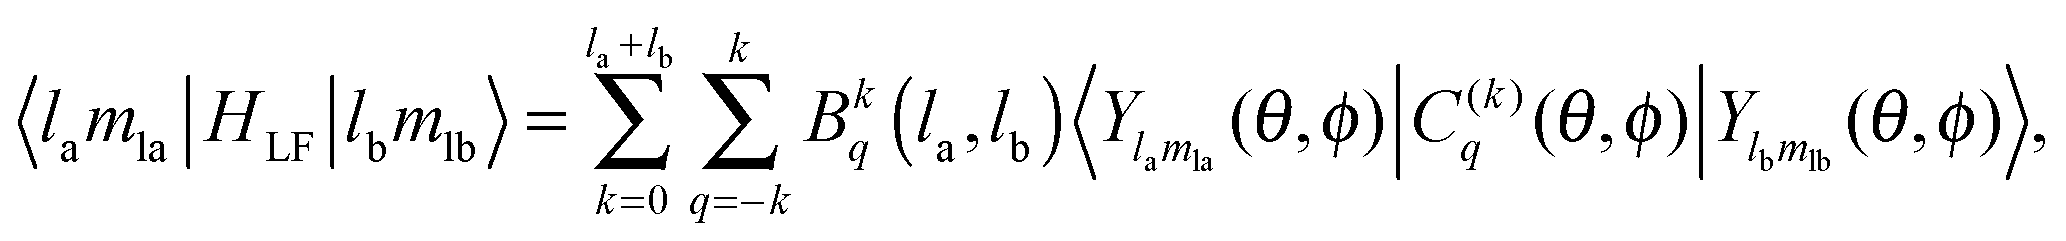
HLF play the role of the chemical environment of the lanthanide ion. The general formulation of the ligand field potential follows Wybourne:
46| | 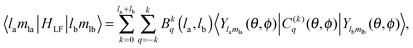 | (13) |
where
C(k)q represent the solid spherical harmonic tensor operators (
eqn (11)) and
Bkq are the Wybourne-normalized crystal field parameters;
| | 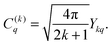 | (14) |
The collection of non-vanishing Wybourne parameters depends on the coordination symmetry of the lanthanide centre, their total number in a two-open-shell f–d ligand field problem being 64 in the case of the
C1 point group.
47 Here, they cannot be reduced to having a simple electrostatic origin, since the DFT calculation takes into consideration different effects including orbital overlap and covalence.
35
Besides the Hamiltonian setting, other specific construction regards the matrix element of the dipole moment operator, important to the computation of the intensity of transitions:
| |  | (15) |
where, in the right hand side of
eqn (15), the term carrying the radial component is simple overlap integrals, while the angular term is proportional to Clebsch–Gordan coefficients.
39 Actually, only the f–d elements are non-vanishing, their mutual mixing by ligand field rendering the intensity, in an approximate, but apparently satisfactory manner.
In summary, several series of parameters have to be determined non-empirically in order to perform LFDFT calculations of two-open-shell f and d electrons:
(1) Δ(fd), which represents the energy shift of the multiplets of the 4fn−15d1 configuration with respect to those of the 4fn configuration.
(2) Fk(ff), Fk(fd) and Gk(fd), which represent the static electron correlation within the 4fn and 4fn−15d1 configurations.
(3) ζnl, which represents the relativistic spin–orbit interaction in the 4f and 5d shells.
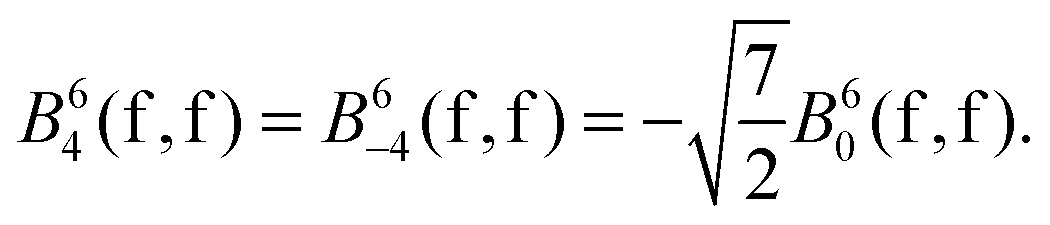
(4) Bkq(f,f), Bkq(d,d) and Bkq(f,d), which describe the interaction due to the presence of the ligands onto the electrons of the metal centre.
The DFT calculations have been carried out by means of the Amsterdam density functional (ADF) program package (ADF2013.01).48–50 We must point out that the ADF is one of the few DFT codes that has the set of keywords facilitating the AOC calculations and Slater determinant emulation, needed by the LFDFT procedure.35,36 The hybrid B3LYP functional51 was used to compute the electronic structure and the related optical properties, in line with previous works.35,36,39 The molecular orbitals were expanded using triple-zeta plus two polarization Slater-type orbital (STO) functions (TZ2P+) for the Eu atom and triple-zeta plus one polarization STO function (TZP) for the Ca, Sr, F and Cl atoms.
The geometrical structures due to the doping of the Eu2+ ion into CaF2 and SrCl2 lattices were approached via periodical calculations by means of the VASP program package.52 The local density approximation (LDA) defined in the Vosko-Wilk-Nusair (VWN)53 and the generalized gradient approximation (GGA) outlined in the Perdew-Burke-Ernzerhof (PBE)54 were used for the exchange–correlation functional. The interaction between valence and core electrons was emulated with the projected augmented wave method.55,56 External as well as semi-core states were included in the valence. A plane-waves basis set with a cut-off energy of 400 eV was used. Super-cells representing a 2 by 2 by 2 expansion of the unit cells of CaF2 and SrCl2 were simulated, which were found to be large enough to lead to negligible interactions between the periodic images of the Eu2+ impurity. 4 k-points were included in each direction of the lattice. The atomic positions were allowed to relax until all forces were smaller than 0.005 eV Å−1.
Results and discussion
The determination of Δ(fd)
We must discuss at the very beginning the calculation of the Δ(fd) gap, which is important in the problem of two-open-shell systems because it sets the origin of the energy of the two electron configurations, conventionally 0 for the 4fn and Δ(fd) for the 4fn−15d1. In a first description, we work with the free ion, considering the gaseous Eu2+ case. Estimating by DFT the energy difference between the 4f65d1 and 4f7 configurations, we must work under the AOC references. This is because the Δ(fd) is not the difference between the specific energy levels, but rather a gap of the averaged energy values common for all multiplets of 4fn and 4fn−15d1 kinds.
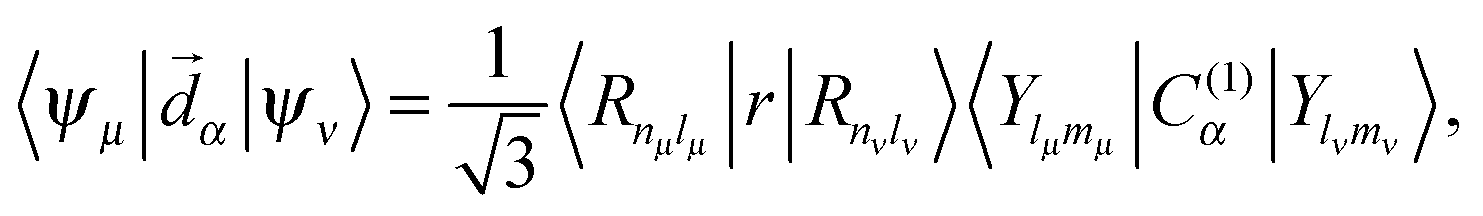
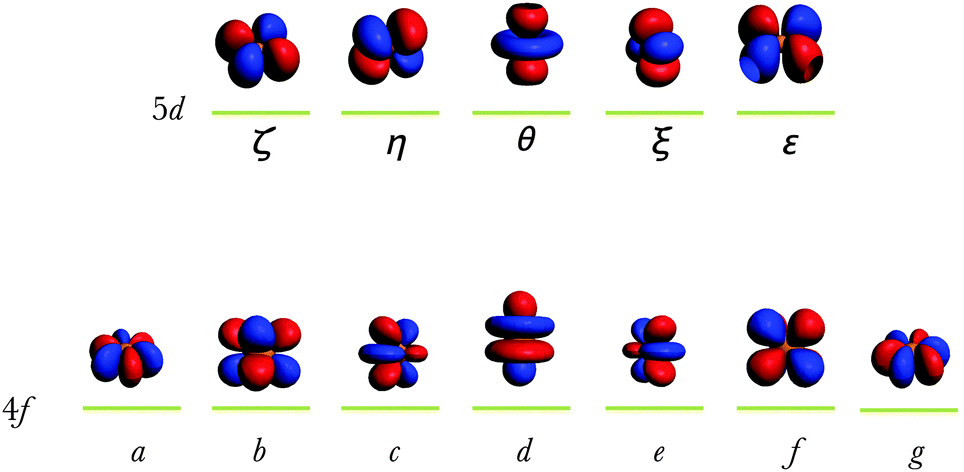
T. Ziegler et al. clarified early that the occupation-averaged configurations, called transition states, carry in DFT the meaning of statistically-averaged spectral terms.57 We prepare the wavefunctions ψ4f and ψ5d by AOC where six and one electrons are evenly distributed in the 4f and 5d orbitals of Eu2+, respectively (Fig. 1). This will generate the reference totally symmetric density, which will be used to compute the DFT energy associated with the series of Slater determinants. Thus all the Slater determinant energies are successively computed permuting seven electrons in the 4f wavefunction (Fig. 1) for the 4f7 manifold, and permuting six electrons in the 4f wavefunction plus one electron in the 5d for the 4f65d1 manifold. The results obtained at the B3LYP level of theory are graphically represented in Fig. 2 showing the Δ(fd) gap. Note that Δ(fd) can occasionally have a negative value, indicating that the ground electron configuration of the lanthanide ion is 4fn−15d1 instead of 4fn. Such a situation may appear in the case of lanthanide Gd2+ (n = 8, see Table 1) and La2+ (n = 1, see Table 1) ions.
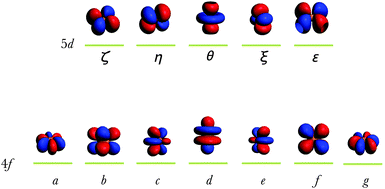 |
| | Fig. 1 Representation of the ψ4f and ψ5d orbitals of Eu2+, obtained from an AOC calculation of Eu2+ within the 4f65d1 electron configuration. The components of the 4f orbitals are listed from left to right according to: fx(x2−3y2), fxyz, fz2x, fz3, fz2y, fz(x2−y2) and fy(3x2−y2), i.e. a, b, c, d, e, f and g. The components of the 5d orbitals are listed from left to right according to: dxy, dxz, dz2, dyz and dx2−y2, i.e. ζ, η, θ, ξ and ε. | |
 |
| | Fig. 2 Representation of the calculated DFT energy values associated with the 3432 Slater determinants (in red) arising from the 4f7 and the 30030 Slater determinants (in blue) arising from the 4f65d1 configurations of Eu2+. The two dashed lines represent the barycentre of the 4f7 manifold (set to the zero of energy), and that of the 4f65d1 manifold. | |
The lowest energies corresponding to the 4f7 manifold (Fig. 2) are associated with the Slater determinants:
| |a+b+c+d+e+f+g+| and |a−b−c−d−e−f−g−|, |
where the signs + and − represent the spin of one electron, up or down, respectively. The highest energies corresponding to the 4f
65d
1 manifold (
Fig. 2) are associated with the Slater determinants:
| |c±d±e±θ+| and |c±d±e±θ−|, |
where the sign ± represents a restricted occupation of two electrons in one orbital. The calculated value of the
Δ(fd) parameter is 3.10 eV at the B3LYP level of theory.
The DFT Slater determinant energies (Fig. 2) can also provide information about the two-electron Fk(ff), Fk(fd) and Gk(fd) parameters using Slater's rule3 and least mean square fitting.10 However, this procedure might undergo uncertainty caused by the important number of linear equations versus variables. In the case of two-open-shell 4f7 and 4f65d1 of Eu2+, for instance, it returns to solve 33462 linear equations with nine variables, leading to some misrepresentations of the parameters.58 Therefore, we calculate the Fk(ff), Fk(fd) and Gk(fd) parameters from the radial wavefunctions Rnl of the 4f and 5d Kohn–Sham orbitals of the lanthanide ions following eqn (8)–(10), which is the subject of the next section.
The calculation of the Fk, Gk, and ζnl parameters
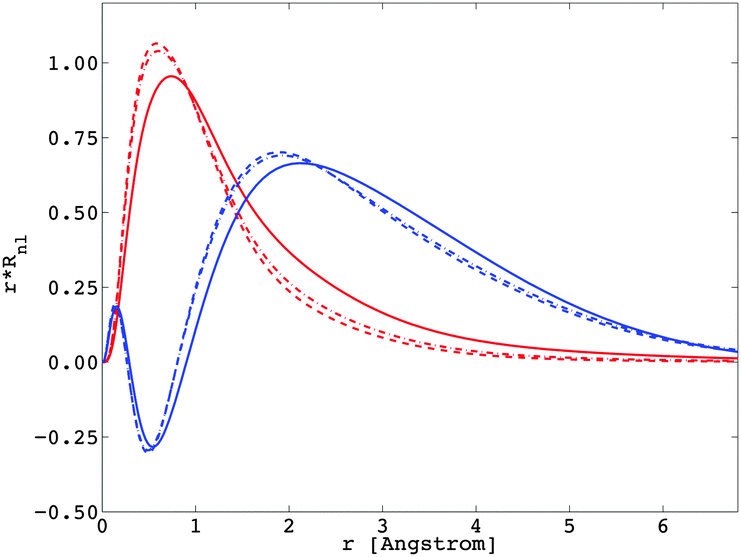
The importance of relativity in the physics of lanthanide elements is not negligible.59–63 There are different approaches dedicated to the implementation of relativistic corrections in DFT. Besides the spin–orbit interaction HSO (eqn (11)), which has itself a relativistic origin; the physics behind the Dirac equation in quantum chemistry is reasonably well characterized by the scalar-relativistic equations.64 We can perform scalar-relativistic calculations at the zeroth-order regular approximation (ZORA) to the Dirac equation65–69 or the first-order relativistic Pauli Hamiltonian70–74 in DFT. In Fig. 3, the solutions of the radial wavefunctions of the 4f and 5d Kohn–Sham orbitals obtained for a gaseous Eu2+ ion are graphically represented, where the influence of the relativistic correction is evaluated. A noticeable expansion of the Rnl is observed when relativistic corrections are implemented in the computational details (Fig. 3), in line with the definition of relativity acting on f and d orbitals.64,75 This expansion is severely pronounced for the Pauli-relativistic calculation (Fig. 3), because of the explicit insertion of the Darwin and mass-velocity terms in the master equation.70–74 The calculated Fk(ff), Fk(fd), Gk(fd) and ζnl parameters using R4f and R5d (Fig. 3) are collected in Table 2. In total, there are:35
| three Fk(ff) parameters: F2(ff), F4(ff) and F6(ff); plus |
| two Fk(fd) parameters: F2(fd) and F4(fd); plus |
| three Gk(fd) parameters: G1(fd), G3(fd) and G5(fd); plus |
| two spin–orbit coupling constants: ζ4f and ζ5d.35 |
The parameters in Table 2 were determined from the wavefunctions ψ4f and ψ5d, prepared in the same manner as was done for Fig. 1.
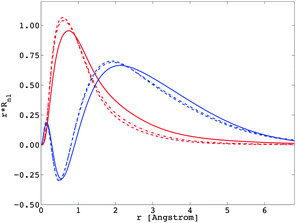 |
| | Fig. 3 Representation of the radial wavefunctions Rnl corresponding to the 4f (in red) and 5d (in blue) Kohn–Sham orbitals of a gaseous Eu2+ ion, obtained at the Pauli-relativistic (solid curve), the ZORA-relativistic (dotted-and-dashed curve) and the non-relativistic (dashed curve) levels of theory. | |
Table 2 Calculated Slater–Condon parameters and spin–orbit coupling constants (in cm−1) obtained at the non-relativistic (a), the ZORA-relativistic (b) and the Pauli-relativistic (c) levels of theory, corresponding to the two-open-shell 4f7 and 4f65d1 electron configurations of a gaseous Eu2+ ion
| |
Slater–Condon parameters and spin–orbit coupling constants |
| (a) |
(b) |
(c) |
|
F
2(ff) |
500.19 |
475.60 |
388.47 |
|
F
4(ff) |
64.66 |
61.32 |
49.92 |
|
F
6(ff) |
6.87 |
6.51 |
5.30 |
|
F
2(fd) |
245.32 |
245.36 |
244.72 |
|
F
4(fd) |
17.86 |
18.12 |
18.82 |
|
G
1(fd) |
338.38 |
369.81 |
431.92 |
|
G
3(fd) |
29.97 |
31.66 |
35.34 |
|
G
5(fd) |
4.70 |
4.91 |
5.40 |
|
ζ
4f
|
2133.90 |
1980.90 |
1246.50 |
|
ζ
5d
|
1279.31 |
1245.93 |
987.25 |
Note that the parameters F2(ff), F4(ff) and F6(ff) are acting principally on the single-open-shell 4fn configuration, but they are also present in the diagonal block of the 4fn−15d1 interaction matrix. Experimentally known spectral terms of the 4f7 configuration of Eu2+ concern only the ground state 8S and the two excited states 6P and 6I,76 although there are 119 levels arising from the multi-electron configuration.77 The calculated energy values of these 8S, 6P and 6I spectral terms are given in Table 3, obtained using the parameters in Table 2. They are also compared with the available experimental data taken from the framework of the NIST atomic spectra database.76
Table 3 Calculated multiplet energy levels (calc.) of a gaseous Eu2+ ion (in cm−1) at non-relativistic (a), ZORA-relativistic (b) and Pauli-relativistic (c) levels of theory, compared with the experimentally-known spectral terms (exp.) corresponding to the 4f7 electron configuration
| |
Calc. |
Exp.a |
| (a) |
(b) |
(c) |
|
Taken from ref. 76 where the energy value of 6P3/2 is not known.
|
|
8S7/2 |
0.00 |
0.00 |
0.00 |
0.00 |
|
6P7/2 |
36379.05 |
34596.14 |
28854.94 |
28200.06 |
|
6P5/2 |
37400.88 |
35526.15 |
29317.04 |
28628.54 |
|
6P3/2 |
38339.68 |
36381.98 |
29758.39 |
—a |
|
6I7/2 |
40277.33 |
38282.44 |
31591.89 |
31745.99 |
|
6I9/2 |
40978.41 |
38917.65 |
31888.23 |
31954.21 |
|
6I17/2 |
41370.71 |
39274.11 |
32060.93 |
32073.30 |
|
6I11/2 |
41542.51 |
39430.07 |
32135.09 |
32179.55 |
|
6I15/2 |
41901.08 |
39756.07 |
32293.32 |
32307.78 |
|
6I13/2 |
41881.85 |
39739.21 |
32287.83 |
32314.14 |
We determined the deviations between the calculated and the experimental spectral terms (Table 3) using eqn (16):
| |  | (16) |
For the three computational methods under consideration, we obtained a maximum deviation of 30.64%, 24.09% and 2.41% for the non-relativistic, ZORA-relativistic and Pauli-relativistic calculations, respectively. On the other hand, we also obtained a minimum deviation of 26.87%, 20.59% and 0.04%. There is an appropriate agreement between the Pauli-relativistic results and the experimental data. Experimentally-known spectral terms of the 4f
65d
1 configuration of Eu
2+ in
ref. 76 assemble some states of octet and sextet spin multiplicity, which in tensor operator techniques represent the direct product: 4f
6(
7F) ⊗
2D, giving rise to the following terms:
8P,
6P,
8D,
6D,
8F,
6F,
8G,
6G,
8H and
6H. Note that the whole manifold of the 4f
65d
1 configuration allows the consideration of 906 spectral terms, including not only the high octet spin multiplicity but also the lower sextet, quartet and doublet, the energies of which are obtained from the DFT calculation using the
Fk(ff),
Fk(fd),
Gk(fd),
ζ4f and
ζ5d parameters (
Table 2) and the
Δ(fd) parameter discussed in the previous section.
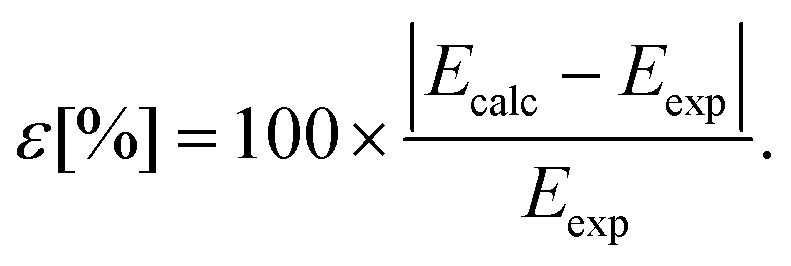
The calculated deviations ε (eqn (16)) from the experimentally-known spectral terms76 are represented in Fig. 4 for the three theoretical methods under consideration. Here also the Pauli-relativistic calculation leads to the best reproduction of the experimental data, its mean deviation being 6.17% (Fig. 4), which is far smaller than those obtained at the non-relativistic and ZORA-relativistic levels of theory.
 |
| | Fig. 4 Representation of the error distribution ε (in %) with respect to the experimental data76 of the calculated multiplet energy levels corresponding to the 4f65d1 configuration of a gaseous Eu2+ ion, at the non-relativistic (in red, (a)), ZORA-relativistic (in green, (b)) and Pauli-relativistic (in blue, (c)) levels of theory. The calculated mean deviations from the experimental data are also given. | |
In this section, the impact of the relativistic correction on the spectroscopy of lanthanide ions is clearly justified; an appropriate description of the radial R4f and R5d wavefunctions is a prerequisite, enabling a good reproduction of the experimental data.
Structural analysis of the doped systems
The doping of lanthanide ions into solid state materials is nowadays a topic of significant interest due to the optical effects.37 There are several instrumental methods to probe the local structure around the impurity ions in solid state compounds, such as nuclear magnetic resonance (NMR),78 extended X-ray absorption fine structure (EXAFS),79,80 as well as electron paramagnetic resonance (EPR).81 However, these methods do not give direct results of the local geometry, offering only data that can be corroborated to it. A clear answer is found in the theoretical side, mimicking the doping of solid state materials by means of band structure methods. In this section, we investigate the local structure around the Eu2+ impurity incorporated in the CaF2 and SrCl2 matrices. Calcium fluoride (CaF2) and strontium chloride (SrCl2) belong to the cubic Fm![[3 with combining macron]](https://www.rsc.org/images/entities/char_0033_0304.gif) m space group (No. 225).41,42 The divalent Eu2+ ion enters in the matrices in the site formally occupied by Ca2+ and Sr2+. It is then coordinated by eight fluoride or chloride ligands, respectively, in the systems CaF2:Eu2+ and SrCl2:Eu2+, within the Oh point group.
m space group (No. 225).41,42 The divalent Eu2+ ion enters in the matrices in the site formally occupied by Ca2+ and Sr2+. It is then coordinated by eight fluoride or chloride ligands, respectively, in the systems CaF2:Eu2+ and SrCl2:Eu2+, within the Oh point group.
For the pristine CaF2 and SrCl2 systems (Fig. 5), the calculated lattice parameters are given in Table 4 in terms of the DFT functional used in the band structure algorithm. It is found that both GGA and LDA calculations yield different lattice equilibrium constants (Table 4), i.e. different local relaxations. In terms of a direct comparison, we consider the GGA calculation most appropriate to simulate the experimental data, although the cells are slightly larger than the experimental ones.
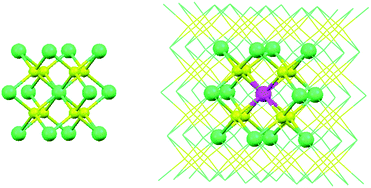 |
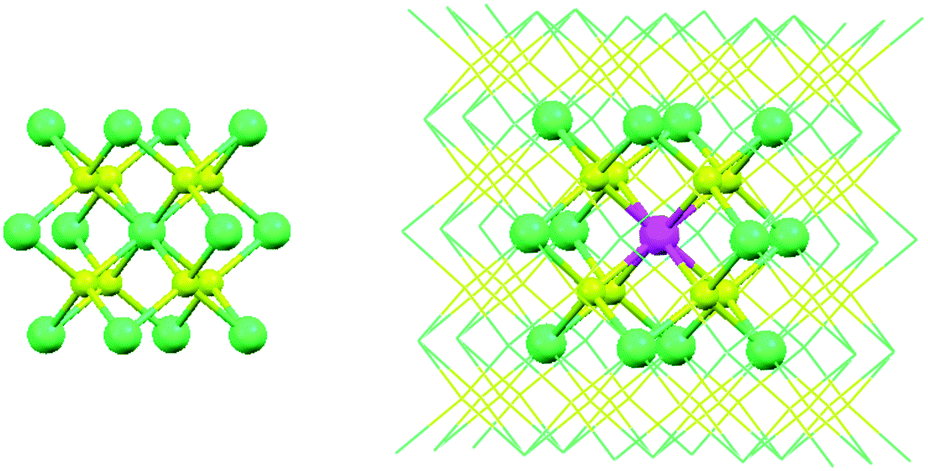
| | Fig. 5 Representation of the crystal structure of CaF2 showing the unit cell (left hand side). The local structure of an Eu2+ centre embedded in a 2 × 2 × 2 unit cell of CaF2 (right hand side). Colour code: Ca2+ in green, F− in yellow and Eu2+ in violet. For clarity, some Ca2+ and F− ions are represented with a wireframe shape. | |
Table 4 Calculated lattice parameters a, b, c (in Å) and α, β, γ (in Å) obtained for CaF2 and SrCl2 crystallizing in the cubic Fmm space group (No. 225), compared with experimental X-ray diffraction data
| |
CaF2 |
SrCl2 |
| LDA |
GGA |
Exp.a |
LDA |
GGA |
Exp.b |
|
Taken from ref. 82.
Taken from ref. 83.
|
|
a, b, c |
5.3342 |
5.5179 |
5.4355 |
6.8088 |
7.0472 |
6.965 |
|
α, β, γ |
90.0 |
90.0 |
90.0 |
90.0 |
90.0 |
90.0 |
For the CaF2:Eu2+ and SrCl2:Eu2+ systems, we constructed super-cells which double the number of the unit cells of CaF2 and SrCl2 in the a, b and c directions. The Eu2+ ion was placed in the position (0,0,0). In these cases, the super-cells are big enough inasmuch as the interactions between two Eu2+ ions are minimized. We relaxed the positions of the atoms, fixing the lattice parameters to the theoretical values obtained for the pure systems. This mimics the resistance of the whole lattice against defect-induced distortions, under the conditions of a lower doping concentration than the 2 × 2 × 2 super-cells actually worked upon have. The optimized Eu–F and Eu–Cl bond lengths are 2.4732 Å and 3.0774 Å, respectively, which represent an elongation with respect to the Ca–F and Sr–Cl bond lengths obtained for the pure systems: 2.3893 Å and 3.0515 Å. The description of the local structure of doped materials is important in the further evaluation of the ligand field Hamiltonian (eqn (13)), the presence of the impurity in the host materials producing distortions due to differences in the ionic radii or electronic structure. We favoured here the band structure algorithms for geometrical purposes, although we can certainly conceive of a cluster geometry optimization approach, which is already popular in computational chemistry, especially while dealing with excited states geometry.36,39
The calculation of Bkq ligand field parameters
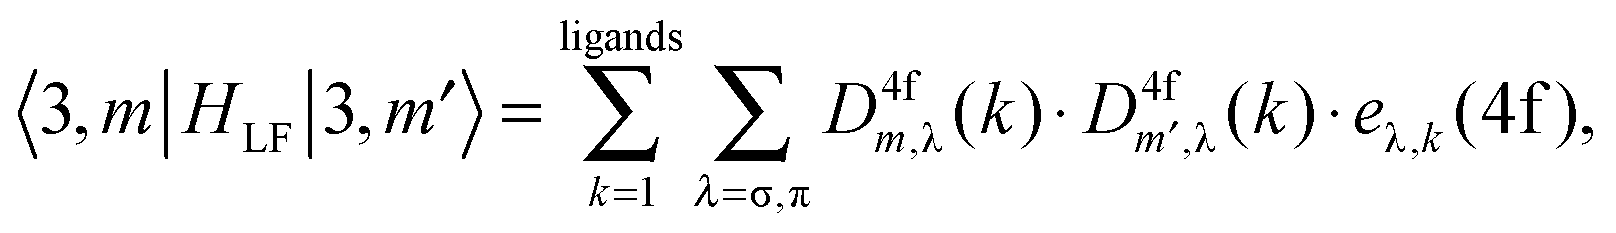
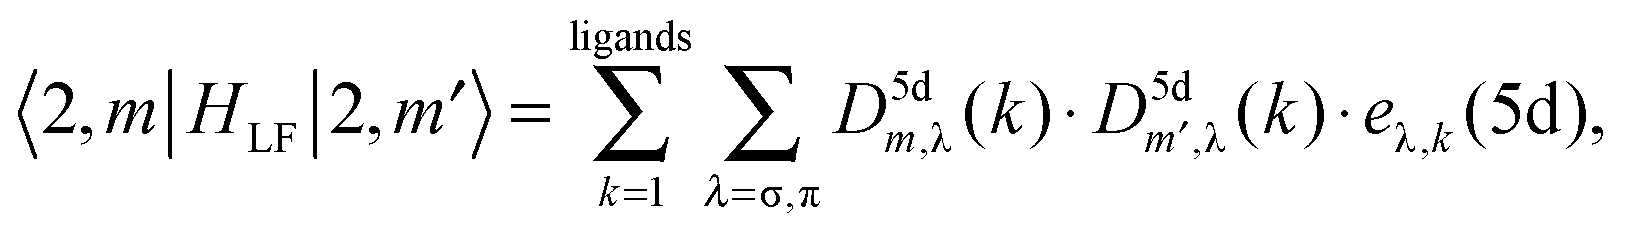
In the CaF2:Eu2+ and SrCl2:Eu2+ systems, the site symmetry of the Eu2+ impurity is Oh and the non-zero Wybourne parameters are as follows:
| B40(f,f), B44(f,f), B4−4(f,f), B60(f,f), B64(f,f) and B6−4(f,f), |
for the sub-matrix corresponding to the 〈f|HLF|f〉 (eqn (13));
| B40(d,d), B44(d,d) and B4−4(d,d), |
for the sub-matrix corresponding to the 〈d|HLF|d〉 (eqn (13)).
The inversion center in the Oh point group allows vanishing of the elements of the sub-matrix 〈f|HLF|d〉.47
The ligand field energy schemes of the 4f and the 5d orbitals of Eu2+ in the CaF2:Eu2+ and SrCl2:Eu2+ systems were calculated taking the cubic clusters (EuF8)6− and (EuCl8)6−, respectively, which have the optimized geometries obtained in the previous section. Point charges were placed at the coordinates of the next-neighbouring Ca2+ and Sr2+ ions, which are also shown as ball-and-sticks in the super-cell in Fig. 5. These were used in order to mimic the long-range interaction of the crystal hosts.
The ligand field energies and wavefunctions were obtained from Kohn–Sham orbitals of restricted DFT calculations within the AOC reference, by evenly placing six electrons in the 4f orbitals and one electron in the 5d. We previously presented the analysis of the ligand field interaction with respect to the change of the DFT functional for the two-open-shell 4f and 5d problem in Pr3+.35 It was found that, in the 5d ligand field, the DFT functional does not play an important role, whereas in the 4f, the hybrid B3LYP functional is required in order to obtain realistic ligand field parameters.35 Therefore we have used B3LYP for the computation of the electronic structure of Eu2+.
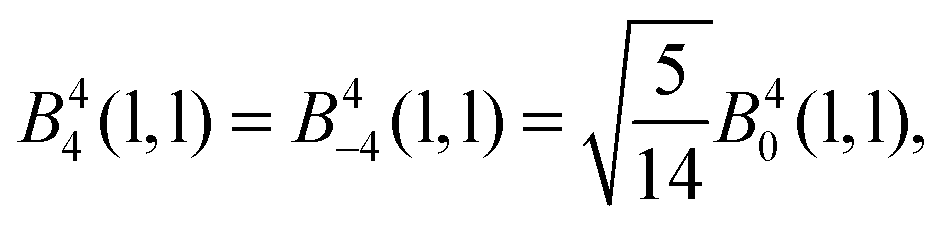
The 4f orbitals form the basis of t1u, t2u and a2u irreducible representations (irreps) of the Oh point group. The 5d orbitals are in the basis of the eg and the t2g irreps. The values of the ligand field Bkq parameters were determined by linear equation fitting using eqn (13), knowing the following ratios for the octahedral symmetry constraint:
| |  | (17) |
with
l standing for d and f, and
| |  | (18) |
The calculated values of the
Bkq parameters for the CaF
2:Eu
2+ and SrCl
2:Eu
2+ systems are presented in
Table 5, together with the experimentally-deduced ones. For
Bkq(d,d), the theoretical values are in good agreement with the experimental data.
41,42 However, for
Bkq(f,f), although the
B40(f,f) and
ipso facto the
B44(f,f) (
eqn (17)) are also in the magnitude of the experimental data, the
B60(f,f) and related parameters (
eqn (18)) are slightly underestimated for both the CaF
2:Eu
2+ and SrCl
2:Eu
2+ systems. This departure between the calculated and the experimental values is reflected primarily in the ordering of the 4f orbitals splitting. The ordering obtained from computation was as follows for both CaF
2:Eu
2+ and SrCl
2:Eu
2+ systems:
while it resulted in the swapped sequence,
for the experimentally-deduced parameters obtained for the SrCl
2:Eu
2+ system.
42
Table 5 Calculated ligand field parameters (calc.) in cm−1 obtained for the systems CaF2:Eu2+ and SrCl2:Eu2+, compared with available experimental data (exp.)
| |
CaF2:Eu2+ |
SrCl2:Eu2+ |
| Calc. |
Exp.a |
Calc. |
Exp.b |
|
Taken from ref. 41.
Taken from ref. 42.
|
|
B
40(f,f) |
−1765 |
−2386 |
−829 |
−1035 |
|
B
44(f,f) |
−1055 |
−1430 |
−496 |
−619 |
|
B
60(f,f) |
120 |
966 |
208 |
−761 |
|
B
64(f,f) |
−225 |
−1807 |
−389 |
1423 |
|
B
40(d,d) |
−34821 |
−33600 |
−21086 |
−21296 |
|
B
44(d,d) |
−20810 |
−20080 |
−12601 |
−12727 |
The change in the orbital ordering may be attributed to the impact of the neighbouring cations, where the symmetry-adapted linear combination of their virtual orbitals may stabilize the a2u irrep. This is not achieved here in the small cluster models of (EuCl8)6−. Nevertheless, a direct comparison between Bkq(f,f) and Bkq(d,d) indicates that the effect of the 4f parameters will be completely superseded by the 5d ones.
AOM analysis of the ligand field interaction
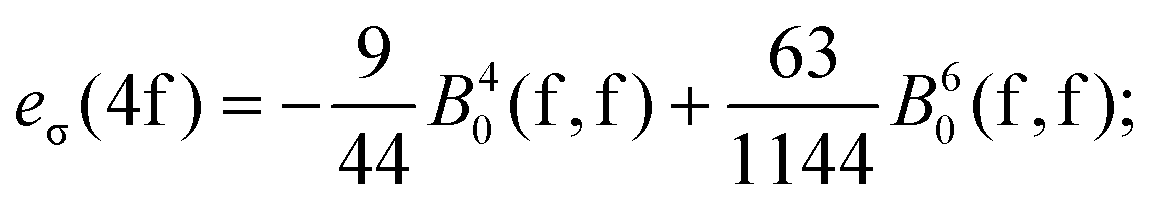
For the sake of more intuitive insight, the Bkq parameters can be converted to the AOM scheme,47 reformulating the ligand field matrix in eqn (13) as follows:| | 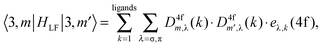 | (19) |
| | 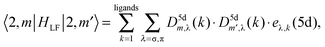 | (20) |
where D4f and D5d are the matrix elements defined in terms of Euler angles (Wigner's Darstellungsmatrizen)6,7,47 and k is the running index for the ligand system. The eλ ≡eσ, eπ parameters have the meaning of perturbation exerted by σ and π sub-components of the density cloud of the ligands (or by corresponding overlap effects, in another heuristic formulation).
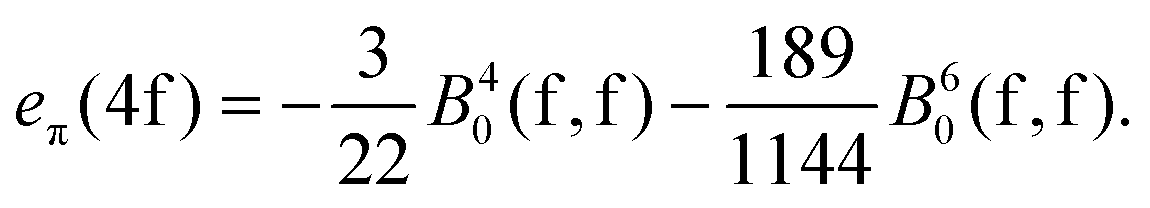
A general problem in establishing the parametric conversion is the fact that the AOM matrix is not traceless, the sum of the diagonal elements for a homoleptic [MLn] complex with linearly ligating ligands (isotropic π effects) being n(eσ + 2eπ), instead of zero, like in the standard ligand field model. In the case of the 4f shell, in octahedral symmetry, the situation does not impinge upon the parametric conversion since we have two independent parameters, B40(f,f) and B60(f,f) in the Wybourne scheme (Table 5), versus two AOM parameters eσ(4f) and eπ(4f), uniquely related to the two relative gaps in the ligand field splitting in Oh symmetry.
The mutual conversion is done by the following formulas:
| |  | (21) |
| |  | (22) |
The comparison of computed
versus experimental fitted Wybourne parameters (
Table 5) can be regarded as semi-quantitative in general, with certain apparent mismatches, as is the opposite sign found for the
B60(f,f) value in the case of the SrCl
2:Eu
2+ system. The same sign mismatch in the case of the computed
versus fitted
B64(f,f) is not an independent feature, given the mentioned
B64(f,f)/
B60(f,f) proportionality (
eqn (18)). The conversion to AOM parameterization allows a certain assessment of the situation. Thus, the calculated AOM parameters for the SrCl
2:Eu
2+ system are as follows (in cm
−1):
eσ(4f) = 181.02 and
eπ(4f) = 78.68, while the conversion of reported fitted
B40(f,f) and
B60(f,f) values
42 yielded the following values:
eσ(4f) = 169.79 and
eπ(4f) = 266.86. One observes that the experimental values lead to the somewhat counterintuitive situation of
eπ(4f) >
eσ(4f) values, with the result then that the numeric experiment may be, in a relative sense, a more reliable source, not for absolute values but with respect to the inter-parametric ratios. The fact is that the ligand field parameters on the 4f shell show small values, in general, being prone to fit uncertainties given the large number of active parameters. The reference work
42 considered a fit with several empirical terms such as Trees and Marvin corrections, while keeping imposed fixed ratios among the more fundamental Slater–Condon parameters, and therefore the full comparability of computed
versus fitted parameters is partly hindered, considering that we worked here only by first-principle leverages: ligand field, Slater–Condon and spin–orbit coupling parameters, without other degrees of freedom.
For the 5d shell, the single gap between eg and t2g does not need the two AOM parameters, so that must impose certain conventions, like the eσ(5d)/eπ(5d) = 3 ratio.35 However, we have not advanced in this direction, given the good match of the computed and fitted 5d-type Bkq parameters, which do not demand the call of AOM as a further moderator in the comparative discussion.
The ligand field interaction, besides lifting the degeneracy of the 4f and 5d orbitals, also has a side effect expanding the radial wavefunctions towards the ligands positions. This is commonly known as the nephelauxetic effect, a concept coined by C. K. Jørgensen84 which is the subject of the next section.
The nephelauxetic effect
The nephelauxetic effect describes the fact that the parameter values of the inter-electron repulsion are usually smaller in complexes than in the corresponding free ions.84 The word nephelauxetic was created by basic translation of “cloud expansion” from Greek. We can quantitatively analyze the changes in the metal wavefunctions with respect to the presence of ligands, underlying the action of the nephelauxetic effect. The 4f shell is shielded from the interaction with the chemical environment inasmuch as independently to the ligand type, the reduction of the free ion inter-electron repulsion Fk(ff) parameters are negligible.47,85 On the other hand, the virtual 5d and 6s shells are able to interact with the neighbourhood, ensuring therefore the bonding of lanthanide ions.86–88 We present in Fig. 6 the radial wavefunction R5d of Eu2+ in the presence of eight fluoride and eight chloride ligands in a cubic arrangement. For comparison purposes, we also present the radial wavefunction obtained for the gaseous Eu2+ free ion (Fig. 3). One observes the pronounced expansion of R5d in the series of fluoride and chloride ligands, highlighting the overlap of ligands by the orbitals from the lanthanide ion. Due to this effect, as explained in previous instances, in the excited states of a 4fn−15d1 lanthanide configuration, the calculated bond lengths are always shorter than those obtained in the ground 4fn configuration.36,39
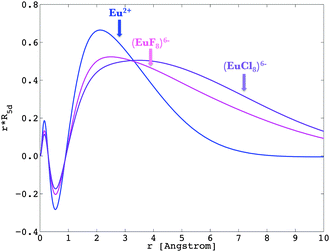 |
| | Fig. 6 Representation of R5d of Eu2+ in the free ion (in blue), in (EuF8)6− (in pink) and (EuCl8)6− (in violet), obtained at the Pauli-relativistic level of theory. | |
Recalling eqn (9) and (10), we calculated the Fk(fd) and Gk(fd) parameters in the complex, based on the radial shapes shown in Fig. 6. Compared with Fig. 3, one notes that R4f remains almost the same, while R5d were shifted by the nephelauxetic effect (see also ref. 47).
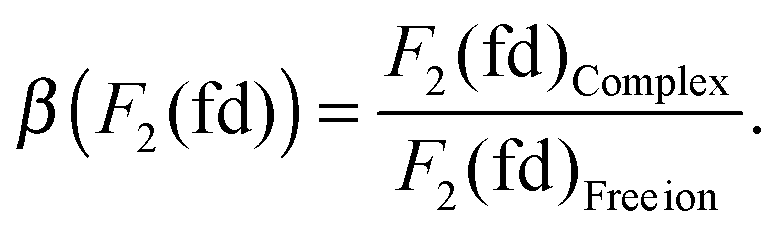
The results are given in Table 6, together with the calculated spin–orbit coupling constant ζ5d, using eqn (12) and the Δ(fd) gap. All the parameters (Table 6) are reduced when compared to the Pauli-relativistic quantities in Table 2. The nephelauxetic ratio β is defined as the fraction made from the inter-electron parameters obtained in the complex and in the free ion, for instance:
| |  | (23) |
The calculated
β values for
Fk(fd),
Gk(fd) and
ζ5d were also given in
Table 5. We calculate mean
β values of 0.53 and 0.37 for CaF
2:Eu
2+ and SrCl
2:Eu
2+, respectively.
Table 6 Calculated values of the Slater–Condon Fk(fd) and Gk(fd), the spin–orbit coupling ζ5d and the Δ(fd) gap (in cm−1) obtained for the systems CaF2:Eu2+ and SrCl2:Eu2+, compared with the experimentally-deduced values
| |
CaF2:Eu2+ |
SrCl2:Eu2+ |
| Calc. |
β
|
Exp.a |
Calc. |
β
|
Exp.a |
|
The Fk(fd) and Gk(fd) are taken from ref. 41 and 42. They are converted to the corresponding Fk(fd) and Gk(fd) parameters using the conversion factor in ref. 43.
|
|
F
2(fd) |
138.42 |
0.57 |
133.33 |
100.56 |
0.41 |
117.43 |
|
F
4(fd) |
9.88 |
0.53 |
10.25 |
6.79 |
0.36 |
8.54 |
|
G
1(fd) |
232.08 |
0.54 |
192.29 |
160.56 |
0.37 |
162.06 |
|
G
3(fd) |
18.22 |
0.52 |
17.30 |
12.31 |
0.35 |
14.41 |
|
G
5(fd) |
2.74 |
0.51 |
2.72 |
1.84 |
0.34 |
2.26 |
|
ζ
5d
|
505.76 |
0.51 |
760 |
371.14 |
0.38 |
844 |
|
Δ(fd) |
18800 |
— |
23500 |
12400 |
— |
— |
We can obtain the Δ(fd) gap for the CaF2:Eu2+ system from ref. 41 which we compare with our calculated value (Table 6). Unfortunately, the experimental value for the same parameter was not specified for the SrCl2:Eu2+ system.42 The difference between the calculated Δ(fd) gap and that obtained in ref. 41 is directly related to the Fk(ff) parameters (Table 2), which is also present in the diagonal elements of the CI matrix of the 4f65d1 configuration of Eu2+. Since the values of our calculated Fk(ff) parameters are larger than that given in ref. 41 our Δ(fd) is accordingly smaller.
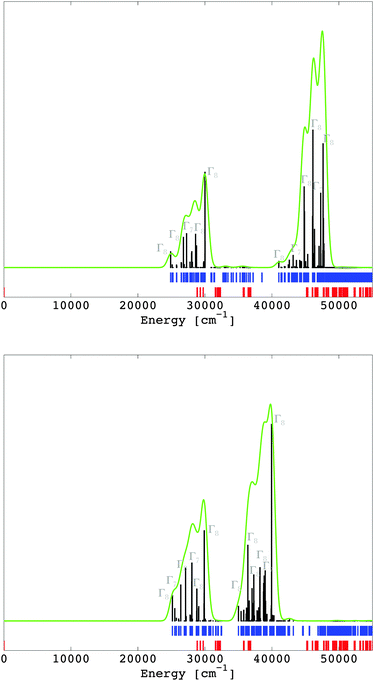
The 4f7–4f65d1 transitions
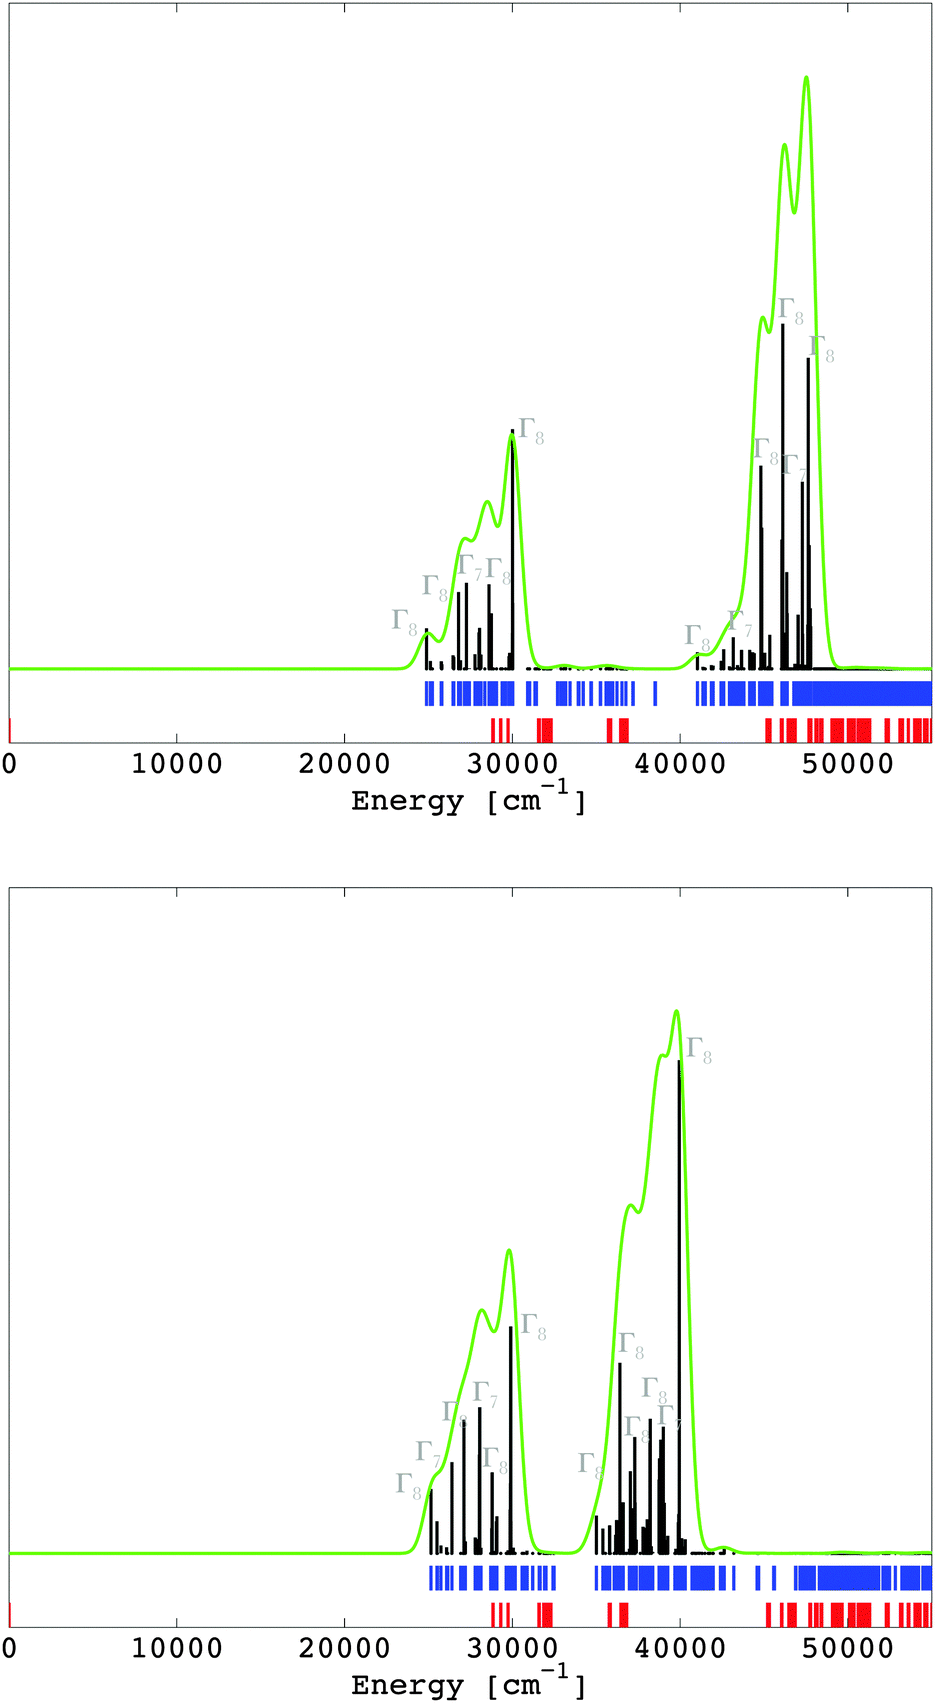
The multiplet energy levels corresponding to the 4f7 and the 4f65d1 configurations of Eu2+ doped into CaF2 and SrCl2 are given in Fig. 7 in the spectral range of 0–55000 cm−1 (those for the entire spectral range are given in the ESI,‡ Fig. S1 and S2). They were computed in the LFDFT algorithm using the following non-empirical parameters: Fk(ff) and ζ4f (Table 2); Fk(fd), Gk(fd), ζ5d and Δ(fd) (Table 6); and Bkq's parameters (Table 5).
 |
| | Fig. 7 Calculated multiplet energy levels from the 4f7 (in red) and 4f65d1 (in blue) configurations of Eu2+ in CaF2 (up) and SrCl2 (down), together with the intensities of the excitation 4f7 → 4f65d1 transitions, i.e. zero phonon lines (in black). The green curve represents a superimposition of a Gaussian band with a width of 500 cm−1 on the zero phonon lines. | |
The transitions from the initial 4f7(8S7/2) state to the final 4f65d1 are electric dipole-allowed, with the calculation of the electric dipole transition moments obtained from eqn (15). The oscillator strength for the zero phonon lines between the ground state 8S7/2 of 4f7 and the final states of 4f65d1 are calculated and represented in Fig. 7. The most intense transitions are given with respect to the irreps of the octahedral double group. In the circumstances of a non-degenerate 8S7/2 state of the 4f7 subsystem, the energies of the 4f7–4f65d1 transitions are practically the same as the position of 4f65d1 spectral terms. The intensities were computed by corresponding handling of the dipole moment represented in the ligand field CI basis, depending all on a single reduced matrix element, ultimately irrelevant as an absolute value, if we consider an arbitrary scale of spectral rendering. The zero-field splitting, which transforms the 8S7/2 state of 4f7 to Γ6 + Γ7 + Γ8 in the actual octahedral symmetry, is in the magnitude of tenths of cm−1. The 4f65d1 transitions are characterized by two dominant bands (Fig. 7), in line with the excitation spectrum seen in ref. 41 and 42 for CaF2:Eu2+ and SrCl2:Eu2+. The correspondence between the theoretical results and the excitation spectrum is seen in the ESI‡, where the excitation spectra of CaF2:Eu2+ (Fig. S1, ESI‡) and SrCl2:Eu2+ (Fig. S2, ESI‡) are reproduced from ref. 41 and 42.
Conclusions
Optical and magnetic effects in lanthanide-based compounds are phenomena intimately understood with the help of ligand field theory. In this work, we have outlined important points for a realistic description of the electronic structure and the optical properties of Eu2+-doped CaF2 and SrCl2 compounds. The treatment of the local distortions due to the presence of the Eu2+ impurity in the fluorite structures of CaF2 and SrCl2 was addressed by periodical band structure calculation. The LFDFT algorithm was used for the calculation of the multiplet energy levels of the 4f7 and 4f65d1 electron configurations of Eu2+. The optical 4f7–4f65d1 transitions were determined, with a good qualitative agreement achieved between the non-empirical investigations and the experimental findings. In particular, the convoluted calculated spectrum can be immediately compared with experimental data, thus showing the usefulness of the approach to experimental scientists. The computational methods and post-computational analyses contained in the LFDFT algorithm are producing reliable ligand field and related parameters, consolidating the academic insight into the structure–property relationships of rare-earth materials and paving the way to the desiderata of property engineering.
There are several advantageous characteristics that this fully non-empirical LFDFT method possesses which should be noted and remembered, besides the predictive capability, very important today for the vast number and kind of rare-earth-based technological materials. The method can be applied to any lanthanide ions, for general 4fn–4fn−15d1 transitions with different coordination symmetries. The LFDFT approach has other advantages against widespread semi-empirical and full ab initio methods, not least the fact that it can be applied to larger-size systems in a relatively short computational time.
Acknowledgements
This work is supported by the Swiss National Science Foundation (SNF) and the Swiss State Secretariat for Innovation and Research. Support from the UEFISCDI Romania research grant PCE 14/2013 from the Romanian Ministry of Research is also acknowledged.
Notes and references
- H. Bethe, Ann. Phys., 1929, 295, 133 CrossRef PubMed.
- J. H. Van Vleck, J. Chem. Phys., 1935, 3, 807 CrossRef CAS PubMed.
-
J. S. Griffith, The Theory of Transition Metal Ions, Cambridge University Press, Cambridge, 1961 Search PubMed.
- M. Gerloch, J. H. Harding and R. G. Woodley, Struct. Bonding, 1981, 46, 1 CrossRef CAS.
-
B. N. Figgis and M. A. Hitchman, Ligand Field Theory and Its Applications, Wiley-VCH, New York, 2000 Search PubMed.
- C. Schäffer and C. Jørgensen, Mol. Phys., 1965, 9, 401 CrossRef PubMed.
- W. Urland, Chem. Phys., 1976, 14, 393 CrossRef CAS.
- C. Daul, Int. J. Quantum Chem., 1994, 52, 867 CrossRef CAS PubMed.
- C. Daul, E. J. Baerends and P. Vernooijs, Inorg. Chem., 1994, 33, 3538 CrossRef CAS.
- M. Atanansov, C. A. Daul and C. Rauzy, Struct. Bonding, 2004, 106, 97 CrossRef.
- L. Noodleman and J. G. Norman, J. Chem. Phys., 1979, 70, 4903 CrossRef CAS PubMed.
- L. Noodleman, J. Chem. Phys., 1981, 74, 5737 CrossRef CAS PubMed.
- M. Mitani, V. Mori, Y. Takano, D. Yamaki, Y. Yoshioka and K. Yamaguchi, Chem. Phys., 2000, 113, 4035 CAS.
- A. Bencini and F. Totti, Int. J. Quantum Chem., 2005, 101, 819 CrossRef CAS PubMed.
- F. Cimpoesu, B. Frescus, C. I. Oprea, H. Ramanantoanina, W. Urland and C. Daul, Mol. Phys., 2015 DOI:10.1080/00268976.2015.1007107.
- M. Atanasov, C. Rauzy, P. Baettig and C. Daul, Int. J. Quantum Chem., 2005, 102, 119 CrossRef CAS PubMed.
- M. Atanasov, C. Daul, H. U. Gudel, T. A. Wesolowski and M. Zbiri, Inorg. Chem., 2005, 44, 2954 CrossRef CAS PubMed.
- D. Reinen, M. Atanasov and W. Massa, Z. Anorg. Allg. Chem., 2006, 632, 1375 CrossRef CAS PubMed.
- M. Atanasov, P. Comba and C. Daul, Inorg. Chem., 2008, 47, 2449 CrossRef CAS PubMed.
- M. Gruden-Pavlovic, M. Peric, M. Zlatar and P. Garcia-Fernandez, Chem. Sci., 2014, 5, 1453 RSC.
- Z. D. Matovic, M. S. Jeremic, R. M. Jelic, M. Zlatar and I. Z. Jakovljevic, Polyhedron, 2013, 55, 131 CrossRef CAS PubMed.
- G. Morrison, H. Ramanantoanina, W. Urland, M. D. Smith and H.-C. zur Loye, Inorg. Chem., 2015, 54, 5504–5511 CrossRef CAS PubMed.
- C. A. Daul, J. Phys.: Conf. Ser., 2013, 428, 012023 CrossRef.
- A. Borel, C. A. Daul and L. Helm, Chem. Phys. Lett., 2004, 383, 584 CrossRef CAS PubMed.
- F. Senn, L. Helm, A. Borel and C. A. Daul, C. R. Chim., 2012, 15, 250 CrossRef CAS PubMed.
- M. Atanasov and C. A. Daul, Chem. Phys. Lett., 2003, 379, 209 CrossRef CAS.
- M. Atanasov, P. Comba and C. Daul, Inorg. Chem., 2006, 110, 13332 CAS.
- I. Ciofini and C. Daul, Coord. Chem. Rev., 2003, 238–239, 187 CrossRef CAS.
- M. Atanasov and C. A. Daul, C. R. Chim., 2005, 8, 1421 CrossRef CAS PubMed.
- M. Atanasov, E. J. Baerends, P. Bruyndonckx, C. Daul, C. Rauzy and M. Zbiri, Chem. Phys. Lett., 2004, 399, 433 CrossRef CAS PubMed.
- F. Senn and C. A. Daul, THEOCHEM, 2010, 954, 105 CrossRef CAS PubMed.
- F. Senn, M. Zlatar, M. Gruden-Pavlovica and C. Daul, Monatsh. Chem., 2011, 142, 593 CrossRef CAS PubMed.
- L. Petit, A. Borel, C. Daul, P. Maldivi and C. Adamo, Inorg. Chem., 2006, 45, 7382 CrossRef CAS PubMed.
- M. Atanasov and C. Daul, Chimia, 2005, 59, 504 CrossRef CAS.
- H. Ramanantoanina, W. Urland, F. Cimpoesu and C. Daul, Phys. Chem. Chem. Phys., 2013, 15, 13902 RSC.
- H. Ramanantoanina, W. Urland, A. Garcia-Fuente, F. Cimpoesu and C. Daul, Chem. Phys. Lett., 2013, 588, 260 CrossRef CAS PubMed.
-
S. Nakamura and G. Fasol, The Blue Laser Diode, Springer, Berlin, 1997 Search PubMed.
- H. Ramanantoanina, W. Urland, A. Garcia-Fuente, F. Cimpoesu and C. Daul, Phys. Chem. Chem. Phys., 2014, 16, 14625 RSC.
- H. Ramanantoanina, W. Urland, B. Herden, F. Cimpoesu and C. Daul, Phys. Chem. Chem. Phys., 2015, 17, 9116 RSC.
- B. Herden, A. Garcia-Fuente, H. Ramanantoanina, T. Jüstel, C. Daul and W. Urland, Chem. Phys. Lett., 2015, 620, 29 CrossRef CAS PubMed.
- G. W. Burdick, A. Burdick, V. Deev, C.-K. Duan and M. F. Reid, J. Lumin., 2006, 118, 205 CrossRef CAS PubMed.
- Z. Pan, L. Ning, B.-M. Cheng and P. A. Tanner, Chem. Phys. Lett., 2006, 428, 78 CrossRef CAS PubMed.
-
R. D. Cowan, The theory of atomic structure and spectra, University of California Press, Berkeley, 1981 Search PubMed.
-
H. Lueken, Magnetochemie, Teubner Studienbücher Chemie, Stuttgart, 1999 Search PubMed.
-
M. Gerloch, Magnetism, ligand-field analysis, Cambridge University Press, Cambridge, 1983 Search PubMed.
-
S. Hüfner, Optical spectra of transparent rare earth compounds, Academic Press, New York, 1978 Search PubMed.
- H. Ramanantoanina, W. Urland, F. Cimpoesu and C. Daul, Phys. Chem. Chem. Phys., 2014, 16, 12282 RSC.
- G. te Velde, F. M. Bickelhaupt, S. J. A. van Gisbergen, C. F. Guerra, E. J. Baerends, J. G. Snijders and T. Ziegler, J. Comput. Chem., 2001, 22, 931 CrossRef CAS PubMed.
- C. F. Guerra, J. G. Snijders, G. te Velde and E. J. Baerends, Theor. Chem. Acc., 1998, 99, 391 CAS.
-
E. J. Baerends, T. Ziegler, J. Autschbach, D. Bashford, A. Berces, F. M. Bickelhaupt, C. Bo, P. M. Boerrigter, L. Cavallo, D. P. Chong, L. Deng, R. M. Dickson, D. E. Ellis, M. van Faassen, L. Fan, T. H. Fischer, C. F. Guerra, A. Ghysels, A. Giammona, S. J. A. van Gisbergen, A. W. Götz, J. A. Groeneveld, O. V. Gritsenko, M. Grüning, S. Gusarov, F. E. Harris, P. van den Hoek, C. R. Jacob, H. Jacobsen, L. Jensen, J. W. Kaminski, G. van Kessel, F. Koostra, A. Kovalenko, M. V. Krykunov, E. van Lenthe, D. A. McCormack, A. Michalak, M. Mitoraj, J. Neugebauer, V. P. Nicu, L. Noodleman, V. P. Osinga, S. Patchkovskii, P. H. T. Philipsen, D. Post, C. C. Pye, W. Ravenek, J. I. Rodriguez, P. Ros, P. R. T. Shipper, G. Schreckenbach, J. S. Seldenthuis, M. Seth, J. G. Snijders, M. Sola, M. Swart, D. Swerhone, G. te Velde, P. Vernooijs, L. Versluis, L. Vissher, O. Visser, F. Wang, T. Wesolowski, E. M. van Wezenbeek, G. Wiesenekker, S. K. Wolff, T. K. Woo, A. L. Yarkolev, ADF2013.01, available at http://www.scm.com Search PubMed.
- P. J. Stephens, F. J. Devlin, C. F. Chabalowski and M. J. Frisch, J. Phys. Chem., 1994, 98, 11623 CrossRef CAS.
-
(a) G. Kresse and J. Hafner, Phys. Rev. B: Condens. Matter Mater. Phys., 1993, 47, 558 CrossRef CAS;
(b) G. Kresse and J. Furthmüller, Phys. Rev. B: Condens. Matter Mater. Phys., 1996, 54, 11169 CrossRef CAS.
- S. H. Vosko, L. Wilk and M. Nussair, Can. J. Phys., 1980, 58, 1200 CrossRef CAS PubMed.
- J. P. Perdew, K. Burke and M. Ernzerhof, Phys. Rev. Lett., 1996, 77, 3865 CrossRef CAS.
- P. E. Blöchl, Phys. Rev. B: Condens. Matter Mater. Phys., 1994, 50, 17953 CrossRef.
- G. Kresse and D. Joubert, Phys. Rev. B: Condens. Matter Mater. Phys., 1999, 59, 1758 CrossRef CAS.
- T. Ziegler, A. Rauk and E. J. Baerends, Theor. Chim. Acta, 1977, 43, 261 CrossRef CAS.
- See also the two different approaches devoted to the calculation of the Slater–Condon parameters in the two-open-shell 4f2 and 4f15d1 configurations of Pr3+ in ref. 35 and 39.
- P. Pyykkö and J. P. Desclaux, Acc. Chem. Res., 1979, 12, 276 CrossRef.
- K. S. Pitzer, Acc. Chem. Res., 1979, 12, 271 CrossRef CAS.
- C. Clavaguera, J.-P. Dognon and P. Pyykkö, Chem. Phys. Lett., 2006, 429, 8 CrossRef CAS PubMed.
- P. Pyykkö, Chem. Rev., 1988, 88, 563 CrossRef.
- P. Pyykkö, Chem. Rev., 2012, 112, 371 CrossRef PubMed.
- D. Cremer, W. Zou and M. Filatov, WIREs Comput. Mol. Sci., 2014, 4, 436 CrossRef CAS PubMed.
- E. van Lenthe, A. E. Ehlers and E. J. Baerends, J. Chem. Phys., 1999, 110, 8943 CrossRef CAS PubMed.
- E. van Lenthe, E. J. Baerends and J. G. Snijders, J. Chem. Phys., 1993, 99, 4597 CrossRef CAS PubMed.
- E. van Lenthe, E. J. Baerends and J. G. Snijders, J. Chem. Phys., 1993, 101, 9783 CrossRef PubMed.
- E. van Lenthe, J. G. Snijders and E. J. Baerends, J. Chem. Phys., 1996, 105, 6505 CrossRef CAS PubMed.
- E. van Lenthe, R. van Leeuwen, E. J. Baerends and J. G. Snijders, Int. J. Quantum Chem., 1996, 57, 281 CrossRef CAS.
- J. G. Snijders and E. J. Baerends, Mol. Phys., 1978, 36, 1789 CrossRef CAS PubMed.
- J. G. Snijders, E. J. Baerends and P. Ros, Mol. Phys., 1979, 38, 1909 CrossRef CAS PubMed.
- T. Ziegler, J. G. Snijders and E. J. Raerends, J. Chem. Phys., 1981, 74, 1271 CrossRef CAS PubMed.
- T. Ziegler, V. Tschinke, E. J. Baerends, J. G. Snijders and W. Ravenek, J. Phys. Chem., 1989, 93, 3050 CrossRef CAS.
- P. M. Boerrigter, M. A. Buijse and J. G. Snijders, Chem. Phys., 1988, 122, 357 CrossRef CAS.
- R. D. Cowan and D. C. Griffin, J. Opt. Soc. Am., 1976, 66, 1010 CrossRef CAS.
-
A. Kramida, Y. Ralchenko, J. Reader and NIST ASD Team, NIST Atomic Spectra Database (ver. 5.2), [Online], National Institute of Standards and Technology, Gaithersburg, MD, 2014, available: http://physics.nist.gov/asd, April 21, 2015 Search PubMed.
-
C. W. Nielson and G. F. Koster, Spectroscopic Coefficients for the pn, dn and fn Configurations, The MIT Press Cambridge, 1963 Search PubMed.
- R. E. Walstedt and L. R. Walker, Phys. Rev. B: Solid State, 1974, 9, 4857 CrossRef CAS.
- P. A. O'Day, J. J. Rehr, S. I. Zabinsky and G. E. Brown, J. Am. Chem. Soc., 1994, 116, 2938 CrossRef.
- P. Ghina, A. Carollo, G. Flor, L. Malavasi and G. S. Peruga, J. Phys. Chem. B, 2005, 109, 4365 CrossRef PubMed.
- B. V. Padlyak, M. Grinberg, T. Lukasiewicz, J. Kisielewski and M. swirkowicz, J. Alloys Compd., 2003, 361, 6 CrossRef CAS.
- D. N. Batchelder and R. O. Simmons, J. Chem. Phys., 1964, 41, 2324 CrossRef CAS PubMed.
- H. Ott, Z. Kristallogr., 1926, 63, 222 CAS.
-
C. K. Jørgensen, Absorption Spectra and Chemical Bonding in Complexes, Pergamon Press, Oxford, 1962 Search PubMed.
- P. A. Tanner and Y. Y. Yeung, J. Phys. Chem. A, 2013, 117, 10726 CrossRef CAS PubMed.
- D. L. Clark, J. C. Gordon, P. J. Hay and R. Poli, Organometallics, 2005, 24, 5747 CrossRef CAS.
- F. Cimpoesu, N. Dragoe, H. Ramanantoanina, W. Urland and C. Daul, Phys. Chem. Chem. Phys., 2014, 16, 11337 RSC.
- M. L. Neidig, D. L. Clark and R. L. Martin, Coord. Chem. Rev., 2013, 257, 394 CrossRef CAS PubMed.
Footnotes |
| † Dedicated to Professor Claude Daul and Professor Werner Urland in the celebration of their seventieth and seventy-first anniversaries. |
| ‡ Electronic supplementary information (ESI) available: The whole range of the spectral energy obtained for CaF2:Eu2+ and SrCl2:Eu2+ together with a direct comparison between the theoretical spectra and the excitation spectra in ref. 41 and 42. See DOI: 10.1039/c5cp02349a |
|
| This journal is © the Owner Societies 2015 |
Click here to see how this site uses Cookies. View our privacy policy here. 
 Open Access Article
 This Open Access Article is licensed under a