
 Open Access Article
 This Open Access Article is licensed under a
 Creative Commons Attribution 3.0 Unported Licence
Direct force measurements between silica particles in aqueous solutions of ionic liquids containing 1-butyl-3-methylimidazolium (BMIM)
Valentina
Valmacco
,
Gregor
Trefalt
,
Plinio
Maroni
and
Michal
Borkovec
*
Department of Inorganic and Analytical Chemistry, University of Geneva, Sciences II, 30 Quai Ernest-Ansermet, 1205 Geneva, Switzerland. E-mail: michal.borkovec@unige.ch
First published on 1st June 2015
Abstract
Direct force measurements between silica particles were carried out using the colloidal probe technique, which is based on an atomic force microscope (AFM). The forces were investigated in aqueous solutions of ionic liquids (ILs) containing 1-butyl-3-methylimidazolium (BMIM) cations and chloride, dicyanamide, and thiocyanate as anions up to concentrations of about 1 M. The results were compared with the simple electrolyte KCl. ILs behave similar to the simple electrolyte at low concentrations, as the ILs dissociate fully into ions, and they lead to repulsive double layer forces. At higher concentrations, attractive van der Waals forces set in, but they are enhanced in the presence of ILs by additional attractive force, whose strength depends on the type of IL. This additional attraction probably originates from the interaction of adsorbed IL layers.
Introduction
Particle suspensions in ionic liquids (ILs) currently attract substantial interest. Such suspensions are obtained during particle synthesis in ILs,1–6 and they are equally highly relevant in catalysis.7–11 An important question concerns their stability over time or whether particle aggregates form. Such aggregates further influence the suspension rheology and control the formation of colloidal glasses or gels.12–14 Recent investigations suggest that particles are often stable in pure ILs, but already a small amount of water can lead to destabilization. Metal, silica, and latex particles were reported to be stable in dry ILs, while small amounts of water induced aggregation.2,3,15,16Particle aggregation is driven by inter-particle forces, and these forces must strongly depend on the type of IL and its water content. Already more than two decades ago, Horn et al.17 measured the forces acting between two mica sheets across mixtures of water and ethyl ammonium nitrate with the surface force apparatus (SFA). At the water side, they found long-ranged repulsive forces due to double layer interactions. In the intermediate concentration range, the forces were attractive, probably due to van der Waals attraction. At the IL side, the forces became oscillatory, which was interpreted as originating from layering of the IL close to the surface. While the pioneering study of Horn et al.17 remained unnoticed for quite a while, its major conclusions were confirmed more recently. In particular, similar patterns were observed in the same IL system involving interactions between a silica particle and a silica substrate, which were studied with the colloidal probe technique.15 Oscillatory forces in pure ILs could also be evidenced using an atomic force microscope (AFM).18–20 The structuring was shown to be more pronounced at lower temperatures and to depend on the size of the IL constituents. SFA studies further suggest that double layer forces are also acting in pure ILs.21–23
Given the fact that the presence of water plays a very important role in determining the interactions between interfaces in ILs, forces in dilute IL solutions in water have been rarely studied. The only exception is the study reported by Horn et al.,17 where it was shown that forces on the water side are compatible with the classical Poisson–Boltzmann (PB) model24,25 by assuming that the IL dissociates fully. While forces in aqueous solutions of ILs have been studied with the colloidal probe15 and optical tweezers techniques,26 rather surprisingly, the resulting force profiles were not analysed quantitatively.
The aim of this study is to fill this gap by accurately measuring forces between surfaces acting in IL–water mixtures, and to analyse the situation on the water side quantitatively. We focus on force measurements between silica particles in various IL–water mixtures, in particular, on ILs containing the 1-butyl-3-methylimidazolium (BMIM) cation and various anions. The results are compared to simple KCl electrolyte solutions.
Experimental and methods
Materials
The experiments were carried out with spherical silica particles purchased from Bangs Laboratories. The manufacturer determined a mean diameter of 5.20 μm and a coefficient of variation 0.1 using a Coulter counter. These values are consistent with our size measurements using an optical microscope.All experiments were carried out in aqueous solutions of the following ILs, namely 1-butyl-3-methylimidazolium chloride, BMIM–Cl, 1-butyl-3-methylimidazolium dicyanamide, BMIM–N(CN)2, 1-butyl-3-methylimidazolium thiocyanate, BMIM–SCN. They were all purchased from Iolitec. Potassium chloride (Sigma Aldrich) was used for comparison. All solutions were adjusted to pH 4.0 by HCl (Sigma Aldrich). Molar concentrations were calculated with the densities of the aqueous solutions known from the literature.16,27,28 The densities of the mixtures were fitted to the ideal mixing law whereby the resulting densities of the pure ILs or KCl are summarized in Table 1. MilliQ water (Milipore) was used throughout. The measurements were carried out at room temperature at 22 ± 2 °C.
| Densitya (g cm−3) | Surface chargeb (mC m−2) | Regulation parameterb | |
|---|---|---|---|
| a Density of the pure IL or KCl obtained from the density measurements of aqueous solutions. b Obtained from direct force measurements. | |||
| KCl | 2.476 ± 0.021 | −2.9 ± 0.1 | 0.56 ± 0.07 |
| BMIM–Cl | 1.087 ± 0.010 | −2.3 ± 0.1 | 0.36 ± 0.04 |
| BMIM–N(CN)2 | 1.060 ± 0.007 | −2.8 ± 0.1 | 0.26 ± 0.06 |
| BMIM–SCN | 1.070 ± 0.008 | −2.4 ± 0.1 | 0.39 ± 0.09 |
Direct force measurements
The colloidal-probe technique was used to measure forces between silica particles using a closed-loop AFM (MFP-3D, Asylum Research) mounted on an inverted optical microscope (Olympus IX70). The particles were attached to a tip-less cantilever (MikroMasch, HQ CSC37, without Al coating), which were cleaned in air plasma for 5 minutes, by placing a few particles on the glass slide. Drops of about 5 μL of glue (Araldite 2000+) were deposited in their proximity. The cantilever was mounted in the AFM, dipped in the glue with the translation stage, and then used to pick up a particle. After the glue was cured, the cantilever was placed in an oven at 1050 °C for 2 hours. This procedure leads to a firm attachment of the particle by sintering of the silica surfaces and results in a complete removal of the glue.The same particles were attached to the glass slide sealing the AFM fluid cell as follows. The slide was cleaned for 20 min with piranha solution, which consists of a mixture of H2SO4 (98%) and H2O2 (30%) in a ratio 3![[thin space (1/6-em)]](https://www.rsc.org/images/entities/char_2009.gif) :1, rinsed with water, and dried under a stream of nitrogen. Subsequently, particles were spread onto square quartz slides of 19 mm (Edmund Optics), cleaned in air-plasma for 10 min, and sintered at 1050 °C for 2 h. The slide was then glued onto a glass slide sealing the AFM cell.
:1, rinsed with water, and dried under a stream of nitrogen. Subsequently, particles were spread onto square quartz slides of 19 mm (Edmund Optics), cleaned in air-plasma for 10 min, and sintered at 1050 °C for 2 h. The slide was then glued onto a glass slide sealing the AFM cell.
Prior to force measurements, the quartz slide and the probes were rinsed with ethanol and water, and after drying treated in air plasma for 20 min. After mounting in the AFM fluid cell, a particle attached to the cantilever was laterally centered with a particle attached to the substrate by means of the fringes observed in the optical microscope to an accuracy of about 100 nm. This step limited the concentration range investigated for the ILs, since accurate centering was no longer possible at concentrations higher than about 1 M. At these concentrations, the particles could be no longer visualized in the microscope due to a too small refractive index difference. Forces between the centered particles were recorded by means of about 150 approach-retraction cycles at a sampling rate of 10 kHz and an approach-retraction velocity of 300 nm s−1. The forces remain repulsive down to contact, no adhesion was observed during the retraction, and all force curves are identical upon approach and retraction within experimental error. The constant compliance region cannot be easily defined. We have assumed the zero separation when the load reaches 5 mN m−1 for the repulsive force curves, and at 1 mN m−1 for the attractive ones. This definition leads to a precision of about 0.3 nm in the separation distance for each individual force curve, and is similar to procedures used earlier.29,30 The forces were obtained from the cantilever deflection in the approach part and the cantilever spring constant in the range of 0.1–0.3 N m−1. The latter was measured using the method proposed by Sader et al.,31 which uses the frequency response of the cantilever and its geometrical dimensions. These values were within 20% with the values obtained analyzing thermal fluctuations in air.32,33 Typically, forces between 5 different pairs of particles were measured, and the results were normally reproducible within 10%.
Roughness determination
The topography of the particle surface was characterized with AFM imaging. Images of the particle surface were recorded in the amplitude modulation with the same AFM, as was used to carry out the force measurements. Before the measurements, the particles were sintered to the quartz slides as described above. Silicon nitride cantilevers (OMCL-AC160TS, Olympus, Japan) with a nominal tip radius below 12 nm and a resonance frequency around 300 kHz were used. The images were acquired in air with a scan rate of 2 μm s−1, a free oscillation amplitude of about 0.2 V, and a set-point around 0.15 V. The root mean square (RMS) roughness was determined over an area of 1 × 1 μm2 and averaged over 15 particles. The mean RMS value was found to be 2.5 nm and the standard deviation was 0.8 nm.Results and discussion
The present study reports on direct force measurements between silica particles in aqueous solutions of imidazolium-based ILs, from the highly dilute regime to the more concentrated ones, up to about a weight fraction of about 20%. Comparison is made with solutions of a simple electrolyte KCl. The particles are about 5 μm in diameter. AFM imaging reveals moderate surface roughness with occasional larger asperities, see Fig. 1. The root mean square (RMS) roughness is about 2.5 nm. | ||
| Fig. 1 AFM image of the silica particle used. (a) Projection of the actual image, and (b) flattened image. | ||
Solutions of a simple electrolyte
Fig. 2 shows the measured normalized forces versus the separation distance in KCl solutions. The forces are normalized to the effective radius Reff, which was taken to be one half of the average particle radius. At low concentrations, the forces are repulsive and approximately exponential. The range of this force corresponds to the Debye length, which is related to the electrolyte concentration, while magnitude of the force reflects the diffuse layer potential ψD. The force profiles were calculated by means of a numerical solution of PB theory, whereby the Derjaguin approximation was used.24,25 The charge regulation characteristic of the surface is treated within the constant regulation (CR) approximation, which introduces the regulation parameter p. For the classical boundary conditions, this parameter assumes simple values for constant charge (CC, p = 1) and for constant potential (CP, p = 0). The regulation parameter can also be determined from the force curves, especially at lower salt concentrations. A least squares fit of the force curve in 1.0 mM KCl down to distances of 3 nm is shown in Fig. 2a. We find a diffuse layer potential of ψD = − 36 mV and a regulation parameter of p = 0.56. The fitted concentration of 0.97 mM agrees well with the analytical concentration of 1.00 mM. The comparison with the shown CC and CP results indicates that regulation effects are important to obtain an accurate description of the force curves. While the sign of the potential cannot be inferred from the force curves, the fact that silica is negatively charged is well established by other techniques.34,35 | ||
| Fig. 2 Forces acting between two silica particles in aqueous KCl solutions at lower (a) and (b) higher concentrations indicated. The left column shows the best fit with DLVO theory within the constant regulation (CR) approximation. The right column uses an additional non-DLVO exponential repulsion. The experimental data are the same in both columns. For the data at lowest concentration of 1.0 mM, the results with the constant charge (CC) and constant potential (CP) boundary conditions are shown. | ||
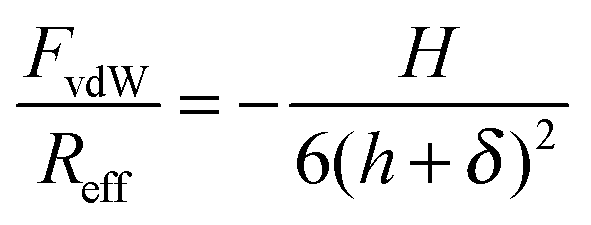
At higher concentrations, the forces become attractive. The double layer force is now fully screened, and the interaction is dominated by the attractive van der Waals force. Within the Derjaguin approximation and by neglecting retardation effects this force can be expressed as36
 | (1) |
The DLVO theory assumes that the overall force can be approximated by the sum of the double layer force Fdl and of the van der Waals force FvdW, namely36
| F = Fdl + FvdW | (2) |
| F = Fdl + FvdW + Fsr | (3) |
 | (4) |
This non-DLVO model described above can fit the entire series of force curves in KCl solutions rather well, see Fig. 2. The parameters for the short-ranged force and for the van der Waals force were fixed to the values reported above, while the regulation parameter was kept constant as p = 0.56 ± 0.07. This value represents the average obtained from fitting of the different repulsive force curves. The remaining fitting parameters are diffuse layer potential ψD and the solution concentration. For concentrations below 10 mM, the fitted concentrations always agreed within 10% with the nominal values. For higher concentrations, the concentrations were fixed to the nominal values, since they could no longer be determined from the force profile accurately.
Fig. 3 summarizes the fitted parameters. The diffuse layer potentials increase with increasing salt concentrations (Fig. 3a). The dependence of the diffuse layer potential ψD on the salt concentration can be rationalized with the charge-potential relationship obtained from the PB model.25,36,39 This relation was fitted to the data, and one obtains a charge density of −2.9 mC m−2 for KCl (Fig. 3a, Table 1). The observed diffuse potentials for the silica surface in the presence of KCl are comparable with previously published values obtained from force measurements pH 4.0 and comparable ionic strengths.40–44 These authors also reported charge densities ranging between −4 and −2 mC m−2, which originate from the dissociation of silanol groups.35,45 The surface charge density typically varies with the type of cation depending on its position within the Hofmeister series, but is basically independent of the type of anion.39,46–49
 | ||
| Fig. 3 Summary of the parameters obtained from the force measurements versus the concentration of the IL or KCl. (a) Diffuse layer potential with calculated dependencies with the PB model. (b) Amplitude of the additional non-DLVO attraction in ILs. Table 1 summarizes the resulting charge densities for (a) and the range of the interaction for (b). This attraction is not present in KCl. The structural formula of the 1-butyl-3-methylimidazolium (BMIM) cation is shown as the inset in (a). | ||
The present Hamaker constants agree well with the values of (2.5 ± 0.5) × 10−22 J reported by Wang et al.30 These values were extracted from direct force measurements in concentrated KCl solutions between silica particles and an oxidized silicon wafer. In a similar system, however, Sivan and coworkers41 reported substantially larger values of 2.2 × 10⁻²¹ J. The latter value agrees reasonably well with the calculated Hamaker constant for two silica surface across water of 1.6 × 10⁻²¹ J, which uses accurate spectra over a wide frequency range.50 Earlier calculations yield larger values (5 ± 3) × 10−21 J, since they were based on too simplified spectra.50,51 We suspect that the reason for the small values of the Hamaker constant measured here and by Wang et al.30 is the substantial surface roughness. The fact that surface roughness reduces the apparent Hamaker constant was recently shown for polystyrene latex particles.39 Alternatively, this low value could also be related to the porosity of the silica particles.34
The present observation of short-ranged repulsive forces is consistent with various earlier studies.29,30,37,44,52–54 Similar forces were reported between surfaces of metal oxides,55,56 and between silica and an air bubble.57 Acuna and Toledo53,54 modeled this short-ranged force with a double-exponential, whereby the decay length of the longer-ranged contribution was reported to be 0.37 nm. This value is in good agreement with the value of qsr−1 = 0.30 nm used here. Since we focus on smaller loads here, the choice of a single exponential is sufficient. Two mechanisms for this force have been proposed. In our view, the more likely origin of this force results from the overlap of hairy or gel layers of polysilicic acid.37,45,58 Other researchers argue, however, that this repulsion is a hydration force, which is related to structuring of water near the surface, or is related to the formation of a hydrogen bonding network.53,59–61 A combination of all these effects should be equally envisaged.
Solutions of ILs
Similar force measurements were carried out in ILs containing 1-butyl-3-methylimidazolium (BMIM+) cations, and different anions, namely Cl−, N(CN)2−, and SCN−. The measured force profiles are summarized in Fig. 4. The profiles resemble the ones measured in KCl, especially at low concentrations. At higher concentrations, however, the forces are more attractive in the ILs, especially in the presence of the SCN− anion. The presence of the additional attraction is best evidenced by the variation of the depth of the minima in the force profile at high IL concentrations (Fig. 4b) with the type of anion, and their larger depth than in the case of KCl (Fig. 2b). | ||
| Fig. 4 Forces acting between two silica particles in aqueous solutions of ILs at lower (a) and (b) higher concentrations. The data are fitted with DLVO theory including additional exponential short-ranged repulsion and a more longer-ranged attraction. The fitted parameters are summarized in Table 1 and Fig. 3. Note the different scales in (b) due to the stronger attraction for BMIM–SCN. | ||
To quantify this additional attraction, we have introduced an additional attractive term in the force, namely
| F = Fdl + FvdW + Fsr + Fatt | (5) |
 | (6) |
The force profiles could be fitted quantitatively with this non-DLVO model by keeping the same parameterization of the short-ranged repulsive force Fsr as was obtained for KCl, namely Asr = 0.20 mN m−1, range of qsr−1 = 0.30 nm, Hamaker constant H = 3.3 × 10⁻²² J, and the shift parameter δ = 0.85 nm. The fitted parameters were the diffuse layer potential ψD, the regulation parameter p, the amplitude of the attractive force Aatt, and its range qatt−1. Fitting of the entire data set leads to relatively constant values of the attractive force range qatt−1 = 1.0 ± 0.2 nm, which is independent of the type of IL, and the regulation parameter p. Their average values depend weakly on the type of IL, and they are reported in Table 1. When these parameters were fixed to these values, the whole data set could be refitted by only allowing for variation in the diffuse layer potential ψD, the solution concentration c, and the amplitude of the attractive force Aatt. For concentrations below 10 mM, the fitted concentrations always agreed within 10% with the nominal values. This finding suggests that the formation of ion pairs is negligible at these concentrations. At higher concentrations, the force profiles were no longer sensitive to the IL concentrations, and these concentrations were fixed to the nominal values. These observations are in line with the reported formation constant 6.2 M−1 for BMIM–Cl in aqueous solution.27 This constant suggests that ion pair formation becomes only important at concentrations above 100 mM. At even higher concentrations, surface tension measurements, neutron scattering experiments, and molecular dynamics simulations suggest that the formation of larger ionic clusters occurs for BMIM, but more extensively for its longer alkyl-chain analogs.62–64 However, the present force measurements provide no evidence concerning the formation of such clusters. The resulting values of these parameters are summarized in Fig. 3 and the corresponding fits are shown in Fig. 4. The description of the data in terms of this model is quite satisfactory. Fig. 3 compares the resulting parameters for ILs with the ones with KCl. Note that the highest concentrations investigated of about 1 M corresponds for the ILs to a weight fraction of about 20%, while for KCl to about 7%.
The diffuse layer potentials ψD in the ILs increase within increasing IL concentrations, similar to KCl. The concentration dependence of this potential can also be fitted with the PB model. The calculated surface charge densities are given in Table 1. One observes that the surface charge densities are similar. However, KCl has the largest magnitude, while it decreases with the sequence N(CN)2−, SCN−, Cl−. This decrease suggests that BMIM+ adsorbs to the silica surface, and that the different anions have a decreasing tendency to form ion pairs within the anion sequence stated. However, the differences between some of the measured values are small, and may not be entirely significant. Along a similar line, the regulation parameters for the ILs are smaller than for KCl, which is again consistent with a stronger adsorption of BMIM+ than of K+.
The anion specificity of the additional attractive forces in the presence of BMIM+ is most obvious by comparing the depth of the minima at high IL concentration shown in Fig. 4b. The strength of this additional attraction increases with the anion sequence Cl−, N(CN)2−, and SCN−. The same trend is reflected by the amplitude of the additional attractive force obtained from the fit as shown in Fig. 3b. The additional attractive non-DLVO interaction is absent in KCl solutions. The scatter in the amplitude of this force is substantial due to experimental inaccuracies, but its magnitude seems to decrease with increasing electrolyte concentration. However, this trend might be reversed by considering the weakening of the van der Waals force in concentrated IL solutions due to refractive index variations. A simplified theory suggests that the Hamaker constant vanishes when the refractive index of the solid is identical to the one of the liquid.36,50 In the ILs investigated, such an optical matching is expected to occur at concentrations around 2–3 M. This effect might in fact lead to a strengthening of the additional non-DLVO force with increasing IL concentration. However, to investigate this effect quantitatively seems to be non-trivial to us, since one would also need to quantify the effects of roughness on the van der Waals forces as well.
Similar, but stronger attractive forces have been observed in ethylammonium nitrate water mixtures.15,17 However, their magnitude was not compared with simple electrolytes, and one cannot easily judge, whether an additional attractive component is present in the ILs or not. We suspect that the origin of these attractive forces is related to the formation of adsorbed layers composed of BMIM–anion pairs at the silica surface, and the interaction results from the overlap of these layers. Extensive layering was reported in pure ILs by direct force measurements15,17,18 or X-ray reflectivity.65 While these studies reported oscillatory profiles, the decay length of these profiles is in good agreement with the attractive force range of 1.0 nm reported here. The present measurements suggest that such layers form already in the presence of substantial amount of water, even though they will be more disordered than at higher IL concentrations.
Conclusions
This study reports on direct force measurements between silica particles in aqueous solutions of ILs, up to a weight fraction of about 20%. The ILs investigated contain 1-butyl-3-methylimidazolium cation (BMIM+) and Cl−, N(CN)2−, SCN− as anions. The results are compared with similar measurements in the simple electrolyte KCl. At low concentrations, ILs behave similar to simple electrolytes and the interactions are dominated by double layer forces. At higher concentrations, however, the van der Waals force attraction is enhanced by an additional non-DLVO attractive force in the ILs. The strength of this additional attraction depends on the type of IL, and increases in the sequence Cl−, N(CN)2−, and SCN−. This additional attraction probably originates from the interaction of BMIM–anion pairs that are adsorbed at the silica surface.Acknowledgements
This work was supported by the Swiss National Science Foundation and the University of Geneva.References
- H. Itoh, K. Naka and Y. Chujo, J. Am. Chem. Soc., 2004, 126, 3026–3027 CrossRef CAS PubMed.
- L. L. Lazarus, C. T. Riche, N. Malmstadt and R. L. Brutchey, Langmuir, 2012, 28, 15987–15993 CrossRef CAS PubMed.
- E. Vanecht, K. Binnemans, S. Patskovsky, M. Meunier, J. W. Seo, L. Stappers and J. Fransaer, Phys. Chem. Chem. Phys., 2012, 14, 5662–5671 RSC.
- Y. Zhou and M. Antonietti, J. Am. Chem. Soc., 2003, 125, 14960–14961 CrossRef CAS PubMed.
- M. Ramalakshmi, P. Shakkthivel, M. Sundrarajan and S. M. Chen, Mater. Res. Bull., 2013, 48, 2758–2765 CrossRef CAS PubMed.
- H. Minami, K. Yoshida and M. Okubo, Macromol. Rapid Commun., 2008, 29, 567–572 CrossRef CAS PubMed.
- M. Ruta, G. Laurenczy, P. J. Dyson and L. Kiwi-Minsker, J. Phys. Chem. C, 2008, 112, 17814–17819 CAS.
- J. D. Scholten, B. C. Leal and J. Dupont, ACS Catal., 2012, 2, 184–200 CrossRef CAS.
- F. T. Li, X. J. Wang, Y. Zhao, J. X. Liu, Y. J. Hao, R. H. Liu and D. S. Zhao, Appl. Catal., B, 2014, 144, 442–453 CrossRef CAS PubMed.
- X. Yang, Z. F. Fei, D. B. Zhao, W. H. Ang, Y. D. Li and P. J. Dyson, Inorg. Chem., 2008, 47, 3292–3297 CrossRef CAS PubMed.
- S. Shylesh, D. Hanna, S. Werner and A. T. Bell, ACS Catal., 2012, 2, 487–493 CrossRef CAS.
- Q. M. Ji, S. Acharya, G. J. Richards, S. L. Zhang, J. Vieaud, J. P. Hill and K. Ariga, Langmuir, 2013, 29, 7186–7194 CrossRef CAS PubMed.
- K. Ueno and M. Watanabe, Langmuir, 2011, 27, 9105–9115 CrossRef CAS PubMed.
- S. S. Moganty, S. Srivastava, Y. Y. Lu, J. L. Schaefer, S. A. Rizvi and L. A. Archer, Chem. Mater., 2012, 24, 1386–1392 CrossRef CAS.
- J. A. Smith, O. Werzer, G. B. Webber, G. G. Warr and R. Atkin, J. Phys. Chem. Lett., 2010, 1, 64–68 CrossRef CAS.
- I. Szilagyi, T. Szabo, A. Desert, G. Trefalt, T. Oncsik and M. Borkovec, Phys. Chem. Chem. Phys., 2014, 16, 9515–9524 RSC.
- R. G. Horn, D. F. Evans and B. W. Ninham, J. Phys. Chem., 1988, 92, 3531–3537 CrossRef CAS.
- R. Atkin and G. G. Warr, J. Phys. Chem. C, 2007, 111, 5162–5168 CAS.
- D. Wakeham, R. Hayes, G. G. Warr and R. Atkin, J. Phys. Chem. B, 2009, 113, 5961–5966 CrossRef CAS PubMed.
- R. Hayes, G. G. Warr and R. Atkin, Phys. Chem. Chem. Phys., 2010, 12, 1709–1723 RSC.
- Y. J. Min, M. Akbulut, J. R. Sangoro, F. Kremer, R. K. Prud'homme and J. Israelachvili, J. Phys. Chem. C, 2009, 113, 16445–16449 CAS.
- M. A. Gebbie, M. Valtiner, X. Banquy, E. T. Fox, W. A. Henderson and J. N. Israelachvili, Proc. Natl. Acad. Sci. U. S. A., 2013, 110, 9674–9679 CrossRef CAS PubMed.
- R. M. Espinosa-Marzal, A. Arcifa, A. Rossi and N. D. Spencer, J. Phys. Chem. Lett., 2014, 5, 179–184 CrossRef CAS.
- S. H. Behrens and M. Borkovec, J. Chem. Phys., 1999, 111, 382–385 CrossRef CAS PubMed.
- R. Pericet-Camara, G. Papastavrou, S. H. Behrens and M. Borkovec, J. Phys. Chem. B, 2004, 108, 19467–19475 CrossRef CAS.
- M. M. Elmahdy, C. Gutsche and F. Kremer, J. Phys. Chem. C, 2010, 114, 19452–19458 CAS.
- M. Bester-Rogac, A. Stoppa, J. Hunger, G. Hefter and R. Buchner, Phys. Chem. Chem. Phys., 2011, 13, 17588–17598 RSC.
- R. C. Weast and M. J. Astle, CRC Handbook of Chemistry and Physics, 60th edn, CRC Press, New York, 1980 Search PubMed.
- B. C. Donose, I. U. Vakarelski and K. Higashitani, Langmuir, 2005, 21, 1834–1839 CrossRef CAS PubMed.
- Y. H. Wang, L. G. Wang, M. A. Hampton and A. V. Nguyen, J. Phys. Chem. C, 2013, 117, 2113–2120 CAS.
- J. E. Sader, J. W. M. Chon and P. Mulvaney, Rev. Sci. Instrum., 1999, 70, 3967–3969 CrossRef CAS PubMed.
- J. L. Hutter and J. Bechhoefer, Rev. Sci. Instrum., 1993, 64, 1868–1873 CrossRef CAS PubMed.
- H. J. Butt and M. Jaschke, Nanotechnology, 1995, 6, 1–7 CrossRef.
- M. Kobayashi, M. Skarba, P. Galletto, D. Cakara and M. Borkovec, J. Colloid Interface Sci., 2005, 292, 139–147 CrossRef CAS PubMed.
- T. Hiemstra, J. C. M. de Wit and W. H. van Riemsdijk, J. Colloid Interface Sci., 1989, 133, 105–117 CrossRef CAS.
- W. B. Russel, D. A. Saville and W. R. Schowalter, Colloidal Dispersions, Cambridge University Press, Cambridge, 1989 Search PubMed.
- G. Vigil, Z. H. Xu, S. Steinberg and J. Israelachvili, J. Colloid Interface Sci., 1994, 165, 367–385 CrossRef CAS.
- M. Dishon, O. Zohar and U. Sivan, Langmuir, 2011, 27, 12977–12984 CrossRef CAS PubMed.
- M. Elzbieciak-Wodka, M. Popescu, F. J. Montes Ruiz-Cabello, G. Trefalt, P. Maroni and M. Borkovec, J. Chem. Phys., 2014, 140, 104906 CrossRef PubMed.
- W. A. Ducker, T. J. Senden and R. M. Pashley, Langmuir, 1992, 8, 1831–1836 CrossRef CAS.
- M. Dishon, O. Zohar and U. Sivan, Langmuir, 2009, 25, 2831–2836 CrossRef CAS PubMed.
- R. F. Considine and C. J. Drummond, Langmuir, 2001, 17, 7777–7783 CrossRef CAS.
- G. Toikka and R. A. Hayes, J. Colloid Interface Sci., 1997, 191, 102–109 CrossRef CAS.
- P. G. Hartley, I. Larson and P. J. Scales, Langmuir, 1997, 13, 2207–2214 CrossRef CAS.
- M. Kobayashi, F. Juillerat, P. Galletto, P. Bowen and M. Borkovec, Langmuir, 2005, 21, 5761–5769 CrossRef CAS PubMed.
- P. M. Dove and C. M. Craven, Geochim. Cosmochim. Acta, 2005, 69, 4963–4970 CrossRef CAS PubMed.
- J. Morag, M. Dishon and U. Sivan, Langmuir, 2013, 29, 6317–6322 CrossRef CAS PubMed.
- T. Isobe, Y. Nakagawa, M. Hayashi, S. Matsushita and A. Nakajima, Colloids Surf., A, 2012, 396, 233–237 CrossRef CAS PubMed.
- T. Oncsik, G. Trefalt, M. Borkovec and I. Szilagyi, Langmuir, 2015, 31, 3799–3807 CrossRef CAS PubMed.
- H. D. Ackler, R. H. French and Y. M. Chiang, J. Colloid Interface Sci., 1996, 179, 460–469 CrossRef CAS.
- L. Bergstrom, Adv. Colloid Interface Sci., 1997, 70, 125–169 CrossRef CAS.
- J. L. Bitter, G. A. Duncan, D. J. Beltran-Villegas, D. H. Fairbrother and M. A. Bevan, Langmuir, 2013, 29, 8835–8844 CrossRef CAS PubMed.
- S. M. Acuna and P. G. Toledo, J. Colloid Interface Sci., 2011, 361, 397–399 CrossRef CAS PubMed.
- S. M. Acuna and P. G. Toledo, Langmuir, 2008, 24, 4881–4887 CrossRef CAS PubMed.
- K. M. Andersson and L. Bergstrom, J. Colloid Interface Sci., 2002, 246, 309–315 CrossRef CAS PubMed.
- H. Yilmaz, K. Sato and K. Watari, J. Colloid Interface Sci., 2007, 307, 116–123 CrossRef CAS PubMed.
- A. H. Englert, M. Krasowska, D. Fornasiero, J. Ralston and J. Rubio, Int. J. Miner. Process., 2009, 92, 121–127 CrossRef CAS PubMed.
- J. J. Adler, Y. I. Rabinovich and B. M. Moudgil, J. Colloid Interface Sci., 2001, 237, 249–258 CrossRef CAS PubMed.
- J. J. Valle-Delgado, J. A. Molina-Bolivar, F. Galisteo-Gonzalez, M. J. Galvez-Ruiz, A. Feiler and M. W. Rutland, J. Chem. Phys., 2005, 123, 034708 CrossRef CAS PubMed.
- A. Grabbe and R. G. Horn, J. Colloid Interface Sci., 1993, 157, 375–383 CrossRef CAS.
- J. P. Chapel, Langmuir, 1994, 10, 4237–4243 CrossRef CAS.
- S. Chen, S. Zhang, X. M. Liu, J. Wang, J. Wang, K. Dong, J. L. Sun and B. Xu, Phys. Chem. Chem. Phys., 2013, 16, 5893–5906 RSC.
- J. Bowers, C. P. Butts, P. J. Martin, M. C. Vergara-Gutierrez and R. K. Heenan, Langmuir, 2004, 20, 2191–2198 CrossRef CAS.
- J. N. A. C. Lopes and A. A. H. Padua, J. Phys. Chem. B, 2006, 110, 3330–3335 CrossRef PubMed.
- M. Mezger, H. Schroder, H. Reichert, S. Schramm, J. S. Okasinski, S. Schoder, V. Honkimaki, M. Deutsch, B. M. Ocko, J. Ralston, M. Rohwerder, M. Stratmann and H. Dosch, Science, 2008, 322, 424–428 CrossRef CAS PubMed.
| This journal is © the Owner Societies 2015 |