
 Open Access Article
 This Open Access Article is licensed under a
 Creative Commons Attribution 3.0 Unported Licence
Scanning electrochemical microscopy of Li-ion batteries
E.
Ventosa
* and
W.
Schuhmann
*
Analytische Chemie – Center for Electrochemical Sciences (CES), Ruhr-Universität Bochum, Universitätstr. 150, D-44780 Bochum, Germany. E-mail: edgar.ventosa@rub.de; wolfgang.schuhmann@rub.de; Fax: +49 234 3214683
First published on 8th June 2015
Abstract
Li-ion batteries (LIBs) are receiving increasing attention over the past decade due to their high energy density. This energy storage technology is expected to continue improving the performance, especially for its large-scale deployment in plug-in hybrid electric vehicles (PHEVs) and full electric vehicles (EVs). Such improvement requires having a large variety of analytical techniques at scientists' disposal in order to understand and address the multiple mechanisms and processes occurring simultaneously in this complex system. This perspective article aims to highlight the strength and potential of scanning electrochemical microscopy (SECM) in this field. After a brief description of a LIB system and the most commonly used techniques in this field, the unique information provided by SECM is illustrated by discussing several recent examples from the literature.
1. Introduction
Li-ion batteries (LIBs) possess the highest energy density among the presently available energy storage technologies, making LIBs the power source of choice for portable electronics. The interest in LIBs has even more increased in recent years due to their potential application in electro-mobility. Currently, LIBs may fulfil the requirement for application in hybrid electric vehicles (HEV), but great improvements are necessary for large-scale deployment in plug-in hybrid electric vehicles (PHEVs) and full electric vehicles (EVs).1 Material scientists are devoting substantial efforts to develop high energy materials for LIBs to achieve the required values of energy density. However, the desired enhancement of the energy density cannot be obtained at the expense of safety, cost or durability, which represents a great challenge since the storage capacity or/and the operating potential of the electrode materials are being brought under extreme conditions.2 Since LIBs are complex multi-component systems with many processes occurring simultaneously, battery scientists (electrochemists, material scientists and battery developers) rely on advanced characterisation techniques for acquiring in-depth understanding of battery processes, which enable improvement in battery performance. Thus, a variety of characterisation techniques are used in the field of LIBs.3–32 Each technique provides different and valuable information on a particular process.Scanning electrochemical microscopy (SECM) has developed into a powerful technique for the study of electrochemical processes since SECM provides spatially resolved information about redox activities. SECM has been employed among others in electrocatalysis, corrosion, elucidation of charge transfer kinetics and mechanisms, heterogeneous processes, biophysical systems, semiconductors or liquid/liquid and liquid/gas interfaces.33–43 Recently, SECM was successfully employed in the field of LIBs, demonstrating to be a unique and powerful analytical tool for the investigation of several processes occurring at battery electrodes.44–56
The aim of this perspective manuscript is to highlight the relevance and usefulness of SECM as an analytical tool for the investigation of battery materials. For this purpose, we first introduce shortly into the context by describing the principles of LIBs as well as the most applied techniques for their characterisation. Then, we explain the working principles of SECM highlighting the unique information which can be acquired about LIBs. Finally, we discuss several cases in which SECM has been employed to study LIBs materials.
2. Li-ion batteries
Li-ion batteries (LIBs) store electrical energy via electrochemical reactions in Li-ion intercalation (or insertion) compounds.57 During the charging process of a battery the electrochemically active centre of the positive electrode is oxidised whereas the active centre of the negative electrode is reduced. The reverse reactions occur during discharge. Li-ions (de-)intercalate from the redox compounds and they shuttle from one electrode to the other to maintain electro-neutrality of the system. Fig. 1 illustrates the operating principle of a Li-ion battery. The positive and negative electrodes operate at highly anodic and cathodic potentials, respectively, to obtain a high battery voltage. Typically, LIBs have a nominal cell voltage of 3.6 to 3.9 V, which requires the use of organic electrolyte solutions with wider electrochemical stability windows than that of water. Standard electrolyte solutions are based on Li salts dissolved in a mixture of carbonate solvents e.g., 1 M LiPF6 in ethylene carbonate/dimethyl carbonate. However, even these organic electrolyte solutions are not stable at the highly cathodic potential at which graphite (the most common negative electrode material) operates (ca. 0.1 V vs. Li/Li+). Fortunately, the products of the reductive decomposition of the electrolyte solution precipitate and lead to the formation of a protective film, which is called a solid electrolyte interphase (SEI).58,59 The electrically insulating character of the SEI prevents continuous decomposition of the electrolyte. The properties of the SEI are very important because they affect key parameters such as safety or life-time of the battery.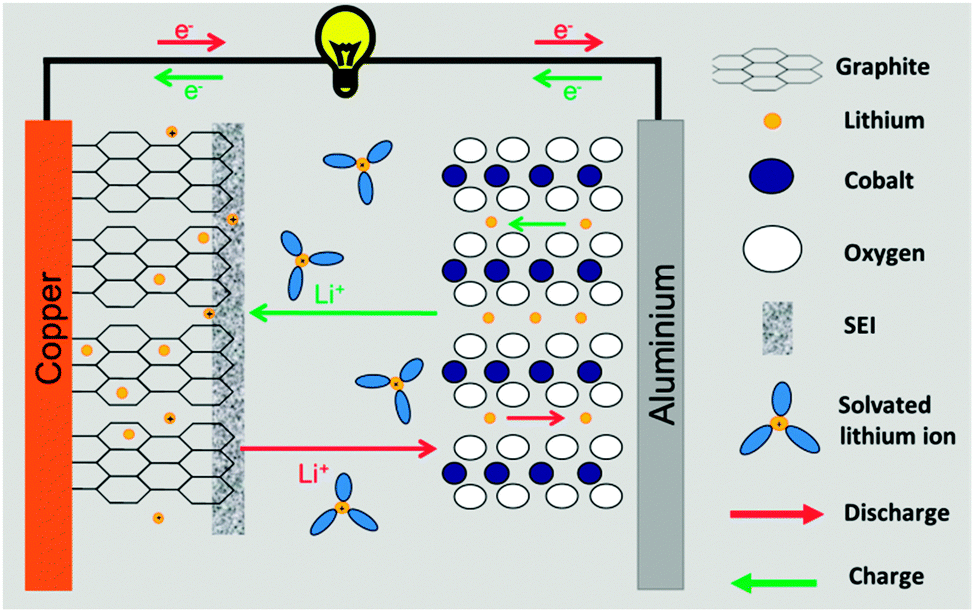 | ||
| Fig. 1 Scheme showing the fundamental parts and reaction in a LIB. | ||
There are many processes involved in an operating LIB. We highlight two of them, which are of prime importance in most of the cases: (i) the solid state electrochemistry of Li-ion insertion materials and (ii) the formation and evolution of the SEI. The former occurs in the bulk of the active materials and governs the reversibility, stability and cyclability of the material as well as the power capability. The latter is a surface reaction determined by the solid–liquid reactivity. Both processes are equally important for a safe and long-lasting battery.
3. Characterisation techniques in Li-ion batteries
A variety of characterisation techniques are used in the field of LIBs. Each technique provides unique information on a particular process. In general, the techniques can be categorised into two groups, namely (i) bulk and (ii) surface techniques, since they provide information about processes occurring in the bulk of the Li-ion storage material or at the electrode–electrolyte solution interface.A. Bulk techniques
Li-ions have to reversibly (de-)insert from/into the active material. The loss in reversibility is often related to irreversible processes occurring in the bulk along with the Li-ion (de-)insertion, e.g. irreversible changes in the electronic or crystalline structure of the material.In order to monitor changes in the crystallinity of the insertion compounds, Raman spectroscopy, X-ray diffraction (XRD), neutron scattering and high resolution transmission electron microscopy (HR-TEM) are usually employed.3–8 With these techniques, understanding of the phase transformation of the active material can be acquired.
X-ray absorption spectroscopy (XAS) is the technique of choice for studying the electronic structure of the active material, which is important to understand the mechanism of the redox reaction in the solid state.9,10
57Fe Mössbauer spectroscopy is a suitable technique for the study of (de-)insertion processes of iron containing active materials such as LiFePO4, FeSn or FeS.11,12
7Li nuclear magnetic resonance (7Li NMR) provides two types of information: (i) structural information of the lithium sites due to different lithium environments and (ii) Li-ion diffusivity within the insertion material.13,14
Differential electrochemical mass spectroscopy (DEMS) provides information about degradation mechanisms of active materials, which involve the evolution of gases, e.g. O2 release from the lattice of the active material.15,16
B. Surface techniques
The formation and evolution of the SEI on the electrode surface is a key parameter in the safety and cyclability of a battery. Novak et al. summarised the available techniques for the analysis of the SEI recently.17 Here, we highlight the most-commonly used techniques.X-ray photoelectron spectroscopy (XPS). Together with infrared spectroscopy, XPS is the most employed technique to determine the chemical composition of the SEI.18,19 Besides the precise composition, XPS can be combined with Ar-sputtering to analyse the SEI at different depths of the film.20
Fourier transform infrared spectroscopy (FTIR). FTIR provides information about the chemical composition of the SEI.21,22 FTIR can be carried out in situ, which is a major advantage over XPS.
Electrochemical impedance spectroscopy (EIS). EIS is a non-destructive and in situ technique that provides information on a variety of processes. EIS is able to differentiate processes occurring at different time constants. The charge transfer kinetics is one of the most studied factors, which is usually employed to shine light on the kinetics of Li-ion transfer across the SEI.23,24
Atomic force microscopy (AFM). AFM can be employed ex situ and in situ and it provides morphological information of the SEI. Besides thickness and topography of the SEI,25,26 the mechanical properties of the SEI can be also determined by nanoindentation with AFM.27,28
Scanning electron and transmission microscopy (SEM and TEM). SEM and TEM provide morphological information of the SEI.29–31 When combined with energy-dispersive X-ray or electron energy loss spectroscopy, compositional information can be derived.32
4. Scanning electrochemical microscopy
Scanning electrochemical microscopy (SECM) employs a microelectrode (so-called “tip”) to scan an area in close proximity to the surface of a sample. Often, the sample acts as a second working electrode. Fig. 2 shows the basic set-up of a SECM system. The tip is immersed into an electrochemical four-electrode cell, together with the counter electrode, reference electrode and the sample. It can be accurately positioned in x-, y-, z-coordinates by step motors and/or piezoelectric elements preferentially having an integrated measuring option for avoiding hysteresis. Chemical changes in close proximity to the sample interface and are detected by the SECM tip. SECM provides spatially resolved information about the electrochemical activity of an area by recording a suitable electrochemical signal at the tip as it scans the selected area in x- and y-directions. Several operating modes of SECM were developed specifically adapted to a variety of applications, which were previously reviewed.60–63 So far, five modes of SECM have been employed for the investigation of Li-ion battery electrodes, namely, the substrate generation/tip collection mode, the redox competition mode, the feedback mode, scanning electrochemical cell microscopy and scanning ion-conductance microscopy. Each of these operating modes is discussed below.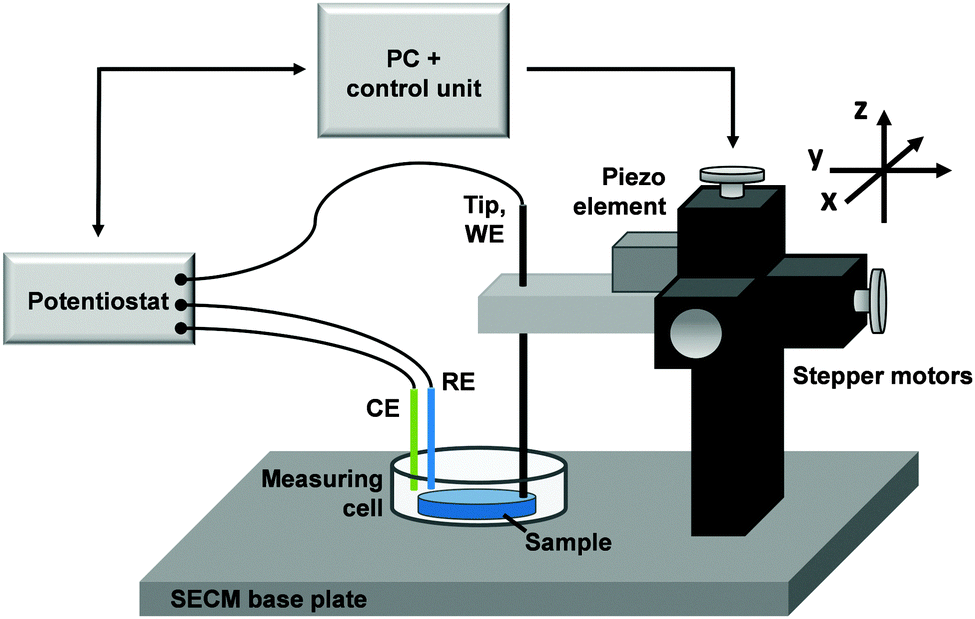 | ||
| Fig. 2 Scheme of a SECM set-up. | ||
The operating potential of the most active materials in LIBs requires rigorous exclusion of oxygen water by means of a dry inert atmosphere. Therefore, it is necessary to install the SECM inside an Ar-filled glovebox, as previously demonstrated for the study of other anhydrous reactions.64–67
Fig. 3a shows a photograph of a SECM placed inside an Ar-filled glovebox. Due to the dry atmosphere inside the glovebox, special positioning motors are employed and the bi-potentiostat is placed outside the glovebox. The electrolyte solution in LIBs becomes very volatile when linear alkylene carbonates, such as dimethyl carbonate (DMC) or diethylcarbonate (DEC), are added to cyclic alkylene carbonates, namely, propylene carbonate (PC) and ethylene carbonate (EC). Since an open electrochemical cell is necessary for SECM measurements, a special lid is required to avoid solvent evaporation.52 Another alternative is to cover the entire SECM head with a bell, as shown in Fig. 3b.56,56
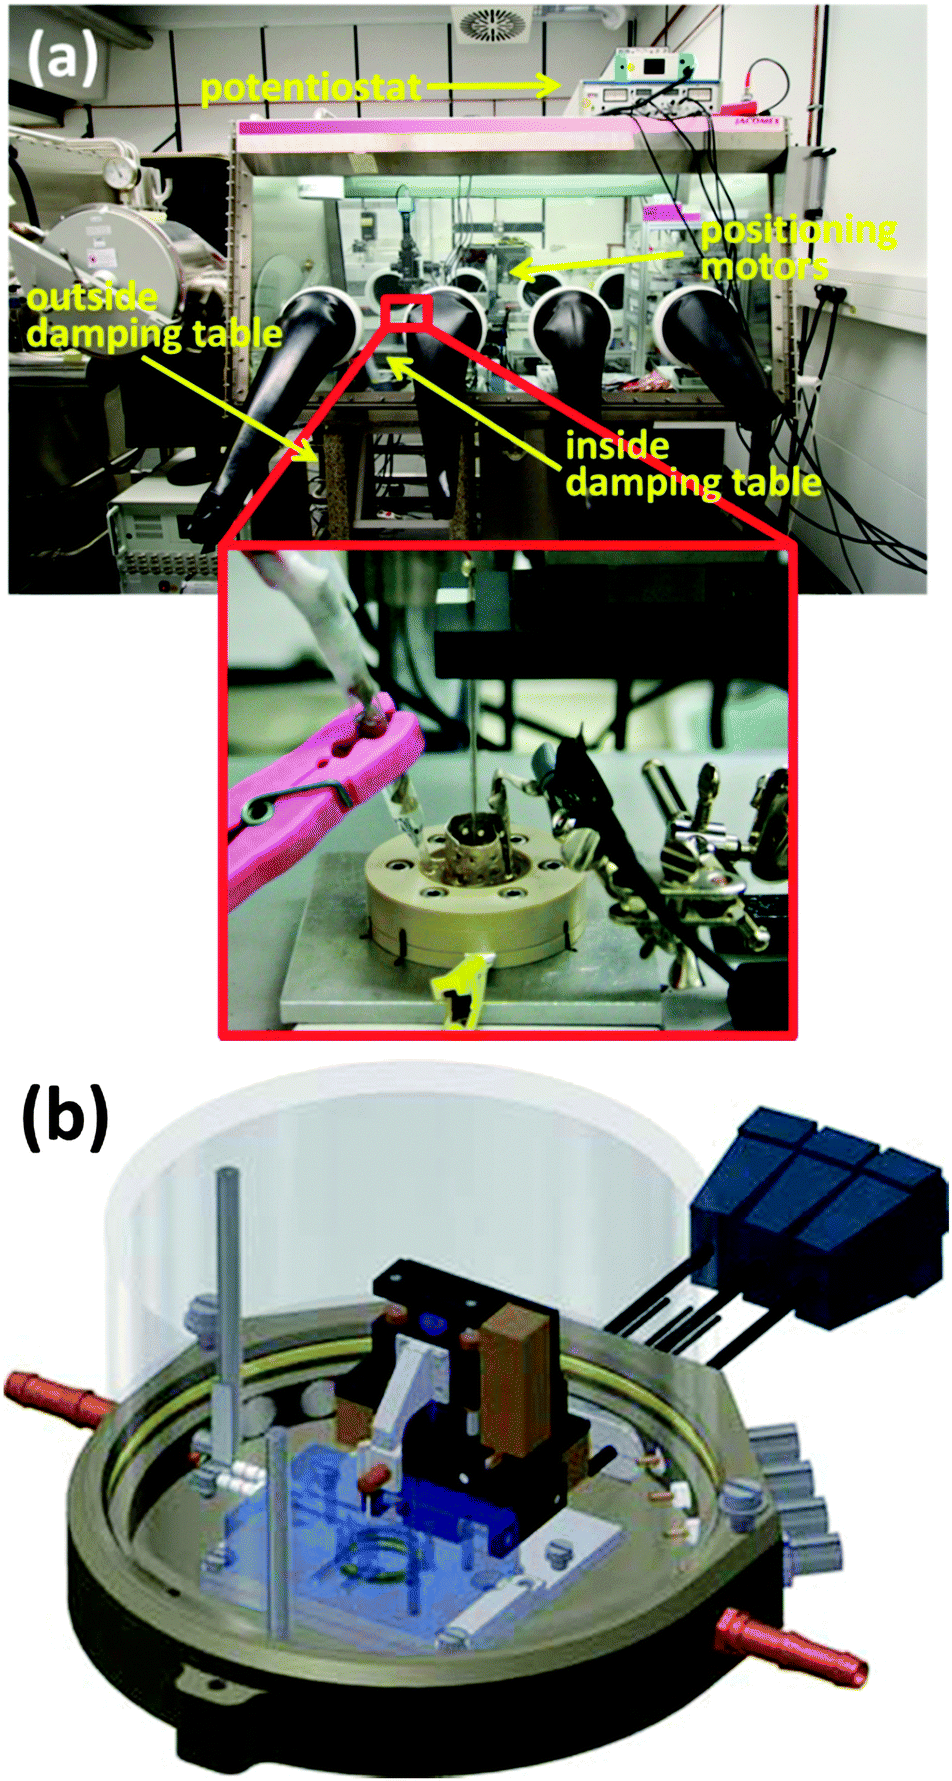 | ||
| Fig. 3 (a) Photography of a SECM placed inside an Ar-filled glovebox (the inset is a close-up photo of the SECM cell). (b) Scheme of the SECM head covered with a bell (see the supporting information in ref. 56). | ||
In general, SECM is used either to investigate the Li-ion activity at the battery electrodes with micro- and nano-scale resolution or to explore the properties of the SEI formed on the surface of the negative electrode. Consequently, SECM in LIBs is considered as either a bulk or surface technique depending on the applied operating mode.
A. Bulk processes
Although the SECM is regarded as a surface technique because it scans the electrochemical surface activity of the electrode, information related to the bulk properties of battery electrodes can be obtained. Below, we discuss four different approaches in which SECM was employed for the spatially resolved visualisation of the redox activity of the battery electrode.Due to the complexity of overlapping processes namely alteration of Li-ion concentration, anodic decomposition of electrolyte solution, dissolution of metal-ions, and even evolution of oxygen from the lattice of the metal oxide, the ST/TC mode of SECM faces severe challenges for the investigation of cathode electrodes.
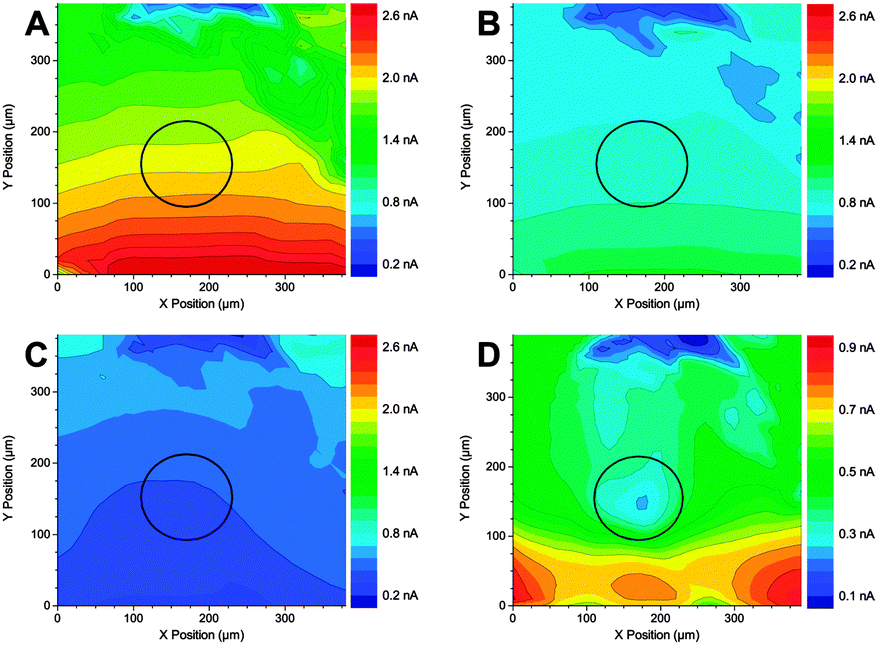 | ||
| Fig. 4 SECM images of Li+ consumption using the redox competition mode using a 120 μm diameter Au electrode (outlined in black). The lithium flux at the tip (Etip = −2.87 V) responded to differences in the substrate's activity toward lithium reduction when poised at +1.0 V (A), −0.8 V (B), and −3.0 V (C and D). Images (A–C) were each acquired in 82 s with Vtip = 20 μm/100 ms (200 μm s−1) and dFinal = 23.8 μm (1.9·rPt). Image (D) represents a higher resolution version of image (C) and was acquired in 642 s with Vtip = 10 μm/200 ms (50 μm s−1). The probe was scanned in the x-direction. Increasing blue colour indicates a decrease in free Li+ concentration. Reproduced with permission from ref. 46 © 2014 the American Chemical Society. | ||
The Li-ion concentration over a flat surface can be mapped following the Li-ion competition mode with Hg/Pt microelectrodes. However, much effort is required for this creative approach to become relevant in the field of LIBs. First, the higher resolution for model samples should be demonstrated since a 120 μm diameter Au electrode embedded into a flat and inactive PTFE surface should result in a clearer image with substantially higher contrast. In addition, battery electrodes possess high porosity and roughness which raises two issues, namely (i) the integrity of the Hg/Pt UME for small collisions against the rough electrode and (ii) the feasibility of implementing tip–substrate distance control for Hg-based microelectrodes.
 | ||
| Fig. 5 (a) Scheme of SECCM. (b) Simultaneous SECCM topography (left) and current (right) images of a LiFePO4 electrode. Scan ranges are 20 × 20 μm2. The sample potential was +0.65 V versus Ag/AgCl QRCE (Li+ deintercalation; scale bar, 5 μm). (c) CVs at different locations above a LiFePO4 electrode surface corresponding to the blue and red arrow of (b). Particle and AB refers to LiFePO4 and acetylene black (conductive additive), respectively. Scan rate is 0.1 V s−1. (d) Local charge (deintercalation) and discharge (intercalation) characteristics applying current magnitudes of 200 pA in each case via SECCM. Reproduced with permission from ref. 47 © 2014 Macmillan Publishers [Nature Comm.] | ||
The electrochemical properties of this small area are evaluated. After that, the nanopipette is retracted, moved to the next x-, y-location and approached to the surface again. Aqueous electrolyte solutions were employed for the nanoscale visualisation of redox activity at lithium-ion battery cathodes (Fig. 5b–d), which is the main limitation of this work. LiFePO4 is a safe, cheap, long-lasting Li-ion battery material, but it is a low energy density cathode material due to its cathodic operating potential (ca. 3.45 V vs. Li/Li+). Thus, LiFePO4 even operates within the electrochemical stability window of water. However, many of the active materials employed in LIBs such as LiCoO2, LiNi0.3Mn0.3Co0.3O2, LiNi0.5Mn1.5O4, graphite, silicon, tin-based alloys, Li4Ti5O12, or TiO2 do not operate within the water stability window. In addition, changing from organic electrolyte solutions to aqueous electrolytes induce potential issues such as dissolution of the materials. Therefore, the implementation of SECCM in carbonate-based solutions for the investigation of Li-ion battery electrodes is highly important for this technique to reach its full potential, but has not yet been demonstrated. On the other hand, the authors demonstrated that the topography of the electrode can be derived simultaneously with the local redox activity (Fig. 5b), which allows the evaluation of real battery electrodes which exhibit topographic variations. Moreover, the lateral resolution achieved using SECCM is impressive and allows elucidating properties of real battery electrodes. Bearing in mind these two assets, namely, topographic information and high resolution, the visualisation of redox activity in LIB electrodes at the nanoscale by SECCM appears as a suitable approach.
A more unusual approach is seen in electrochemical strain microscopy (ESM) for the investigation of battery materials. Although this technique is not based on SECM but on atomic force microscopy (AFM) it provides information about local electrochemical activity.49,50 The setup is the same as a conductive AFM. If an alternating current with optimal amplitude and frequency is applied to the conducting cantilever in contact with the sample (a battery material), Li-ions are attracted and repelled to/from the tip of the cantilever. Thus, a high resolution visualisation of the Li-ion diffusivity in a battery material is obtained as well as information about simultaneously occurring volumetric changes. This technique was developed for the investigation of Li-ion dynamics of battery materials at high resolution; however, its feasibility for studying real battery electrodes is to be demonstrated.
B. Surface processes
In the feedback mode, which is probably the most used mode in SECM imaging, a redox mediator is added to the solution. The tip is polarised to a potential at which the redox mediator reaches the limiting diffusion current. When the tip approaches a conductive and reactive sample surface, the current recorded at the tip is enhanced (positive feedback). If an electronically insulating or inert sample surface is approached, the current at the tip decreases (negative feedback). Therefore, the feedback in the signal of the tip is expected to change from positive to negative when the SEI is formed on the battery electrode as a consequence of electrolyte decomposition as illustrated in Fig. 6. As a proof of the sensitivity of the feedback mode to the presence of the SEI, a glassy carbon electrode was cycled between 3 V and 0.01 V (vs. Li/Li+) in carbonate based electrolyte solution (1 M LiClO4 in EC![[thin space (1/6-em)]](https://www.rsc.org/images/entities/char_2009.gif) :PC).51 The SEI formed on the electrode was scratched away from an area of 50 × 50 μm2 using AFM in contact mode. Although the thickness of the SEI was so thin that it could not be determined accurately from the AFM cross-section, a clear higher feedback signal was obtained when the area was visualised by SECM (Fig. 7).
:PC).51 The SEI formed on the electrode was scratched away from an area of 50 × 50 μm2 using AFM in contact mode. Although the thickness of the SEI was so thin that it could not be determined accurately from the AFM cross-section, a clear higher feedback signal was obtained when the area was visualised by SECM (Fig. 7).
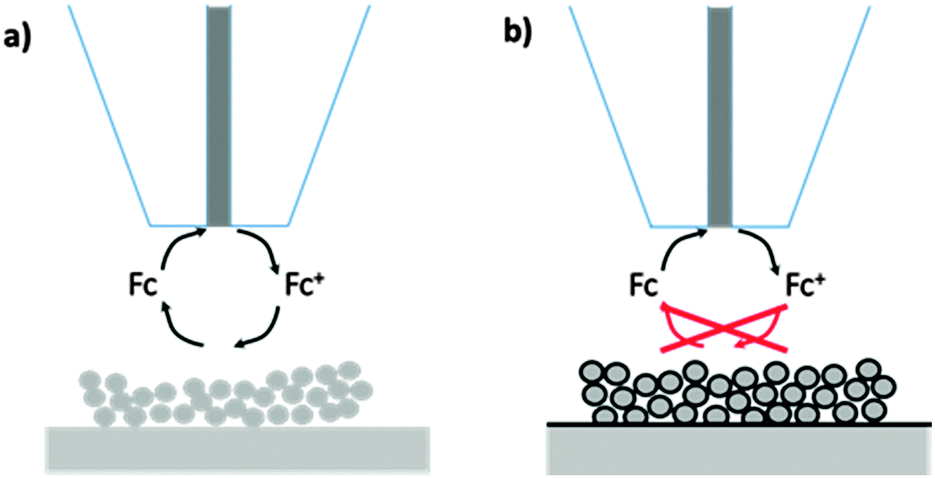 | ||
| Fig. 6 Effect of the formation of the SEI on the feedback current at the SECM tip. Battery electrode (a) without and (b) with SEI. The SEI modulates the reduction rate of Fc+ at the paste electrode leading to a decreased feedback current. Reproduced with permission from ref. 54 © 2013 the Royal Society of Chemistry. | ||
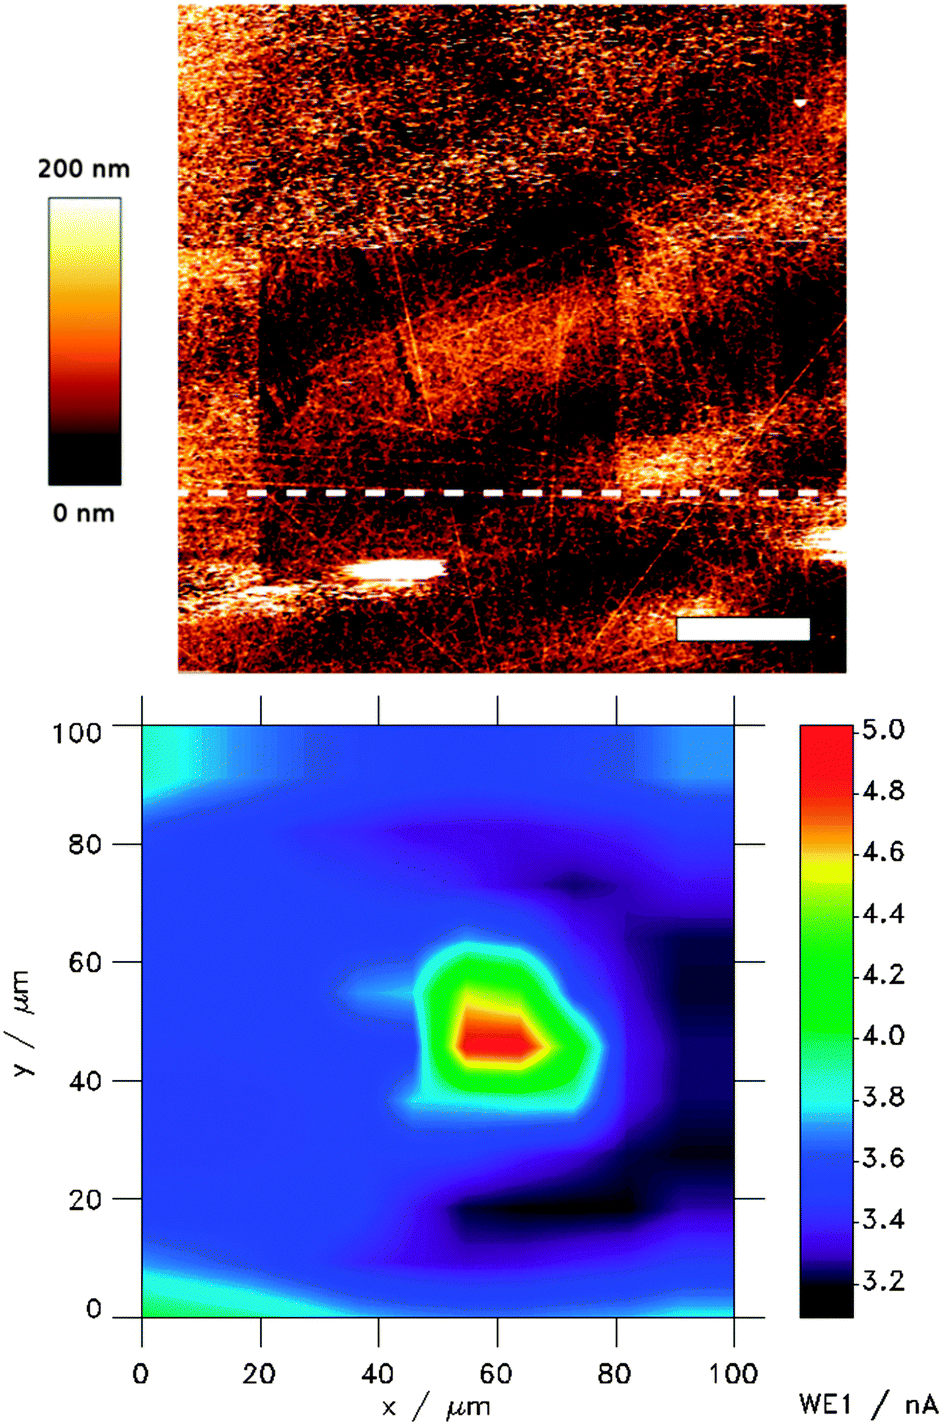 | ||
| Fig. 7 100 × 100 μm AFM image (top) and SECM images (bottom). Z-scale was 200 nm and 2 nA for the AFM and the SECM image, respectively. An area of 50 × 50 μm2 of SEI was scratched away using AFM in the contact mode with a loading force of 3–5 nN. The sample (glassy carbon) was first cycled between 3.0 V and 0.01 V (vs. Li/Li+) and left at OCP during AFM and SECM imaging. Reproduced with permission from ref. 51 © 2015 Wiley-VCH. | ||
The formation and evolution of the SEI on glassy carbon was also investigated by local electrochemistry based on the feedback mode of SECM under in operando conditions.52 This study confirmed the formation of an electrically insulating layer at 0.8 V vs. Li/Li+ (Fig. 8a). Although the evolution of gas (only CO2) was reported by DEMS to take place at 1 V, the insulating character of the surface does not change until the potential was more cathodic than 0.8 V.53 DEMS also reported that ethylene started to evolve below 0.8 V, indicating that the products of the reduction changes below 0.8 V. The SECM results suggest that the products of the reaction occurring at 0.8–1.0 V do not result in the formation of an electrically insulating layer and cathodic polarisation below 0.8 V is necessary for the formation of the formation of a protecting SEI. In addition, it was observed that the electrically insulating character of the SEI remains stable in the second cycle (Fig. 8b). The partial anodic dissolution/compositional change of the SEI reported to occur above 2.0 V appeared not to significantly affect the insulating character of the film. The feedback mode of SECM was also employed to investigate real paste battery electrodes both with respect to local electrochemistry as well as visualisation of their local variations.54,55
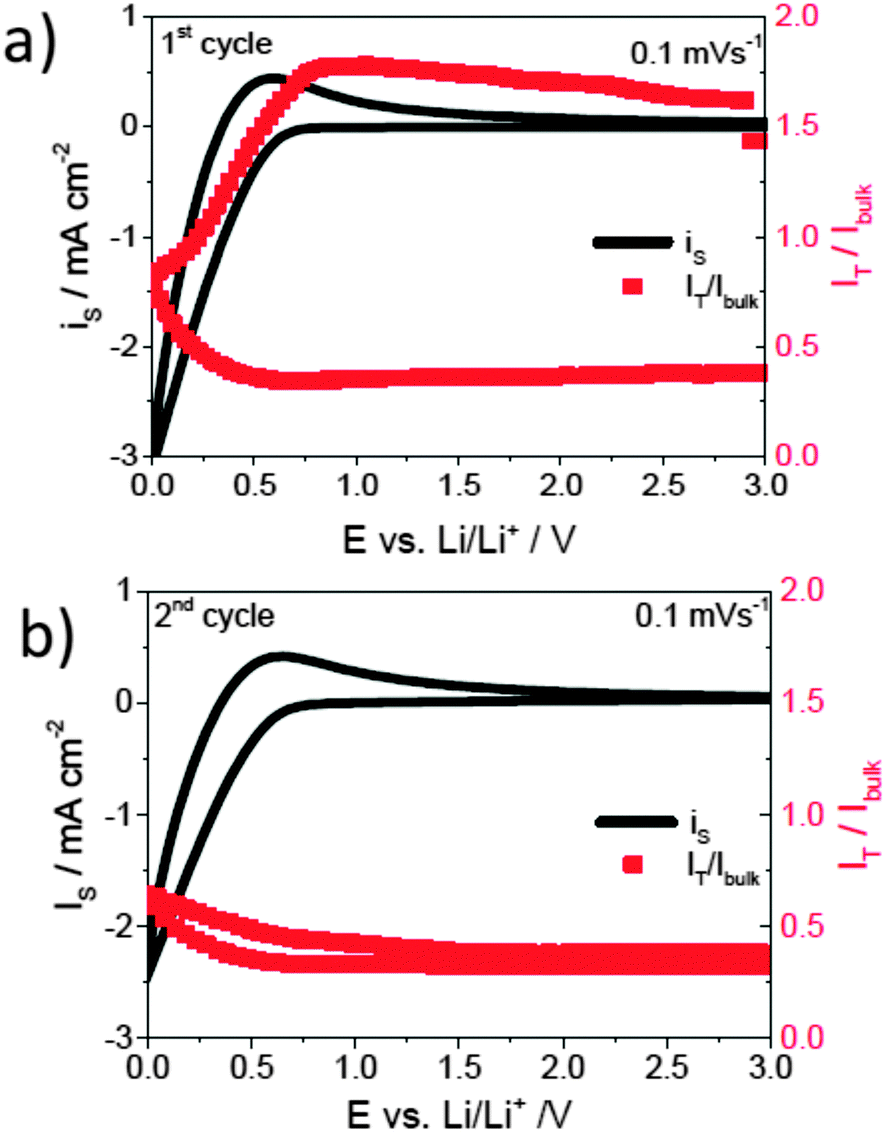 | ||
| Fig. 8 Cyclic voltammogram of a glassy carbon electrode in 1 M LiClO4 containing 20 mM Fc in EC:DEC (1:1% wt) at a scan rate of 0.1 mV s−1. (a) First cycle, (b) second cycle, and the corresponding feedback current at the microelectrode polarized at 3.6 V vs. Li/Li+. IT/Ibulk refers to the current intensity recorded at the tip normalized by the current intensity obtained when the tip is located far away from the surface (bulk of the solution) to the current recorded at the tip and reproduced with permission from ref. 52 © 2015 the Royal Society of Chemistry. | ||
Zampardi et al. investigated SEI formation and evolution on TiO2 paste electrodes.54 Both mapping and local electrochemistry measurements indicated that the electrically insulating character of the surface is only achieved by driving the potential of the electrode below 1 V vs. Li/Li+. These results are of high relevance to clarify the formation of the SEI at titania electrodes. Since titania electrodes operate within the stability window of the electrolyte solution, many scientists considered this type of electrode to be SEI-free.2,68,69 On the other hand, other groups insisted on the presence of SEI at titania electrodes operating even above potentials of 2 V vs. Li/Li+.70,71 The SECM results demonstrated that the electrically insulating character of the electrode surface is not achieved at potentials above 1 V vs. Li/Li+. If a film is formed at a potential positive to 1 V, it does not possess the intrinsic feature of the SEI namely the electrically insulating character.
Another creative application of the feedback mode of SECM was demonstrated by Bülter et al. for the investigation of real LIB electrodes.56 Spontaneous spatiotemporal changes in SEI properties of electrochemically aged graphite paste electrodes in the lithiated state were in situ evaluated. Besides confirming the electrically insulating character of cycled graphite electrodes, SECM images revealed the development of unexpected features at the SEI-covered electrode surface over time at open circuit potential. SECM images acquired at open circuit potential (Fig. 9) showed the appearance of areas in which a lower current was recorded at the tip. It was concluded that the evolution (spontaneous appearance and disappearance) of these areas with lower tip–current were due to spontaneous gas evolution. The formation of an electrochemically inactive bubble of gas resulted in a lower current at the tip. The detachment of the bubble leads to the recovery of the signal at the tip. The evolution of gas reveals the dynamic properties of the SEI at lithiated graphite electrodes, even when kept at open circuit potential, as indicated by these spontaneous spatiotemporal SECM investigations.
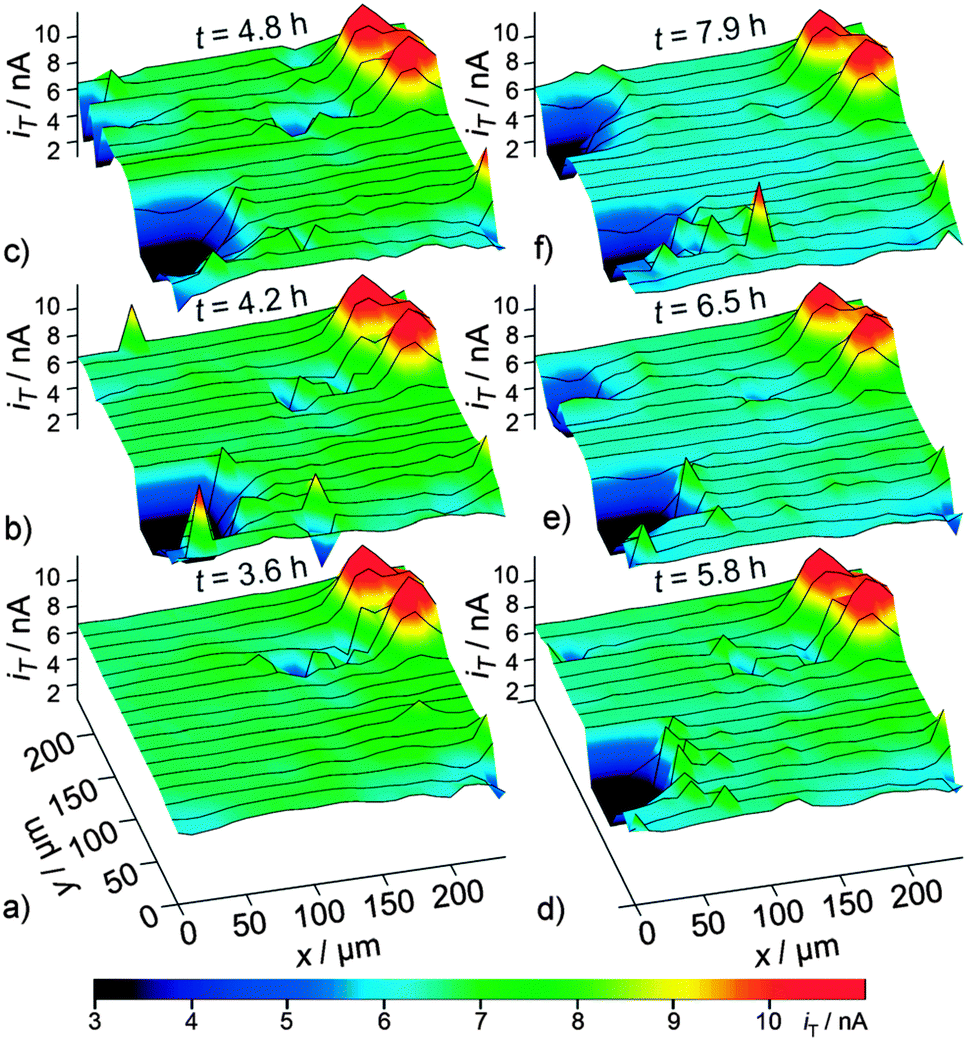 | ||
| Fig. 9 Detection of gas-bubble formation within a sequence of SECM feedback-mode images of an identical region of a SEI-covered graphite electrode recorded (a) 3.6 h, (b) 4.2 h, (c) 4.8 h, (d) 5.8, (e) 6.5 h, and (f) 7.9 h after filling electrolyte solution into the SECM cell at d = 3 μm. Reproduced with permission from ref. 56 © 2014 Wiley-VCH. | ||
The feedback mode of SECM has been demonstrated with several examples to be a powerful and versatile analytical tool for the study of the SEI in LIBs. The formation and evolution of the properties of the SEI can be investigated in situ or in operando. Importantly, the feedback mode of SECM is the unique technique that is able to provide information about one of the most important parameters of the SEI: its electrically insulating character. The main limitation of the feedback mode from the point of view of imaging is the implementation of a tip-to-sample distance control, which will allow for the enhancement of the lateral resolution.
5. Comparison of SECM with other microscopy techniques
A brief comparison of the information extracted from SECM versus that obtained from other microscopies is given in this section. Four microscopies are often used in Li-ion batteries: Raman microspectroscopy,72,73 scanning electron microscopy (SEM),29 transmission electron microscopy (TEM),74–76 and atomic force microscopy (AFM).25,26 Each technique provides different types of information: morphology, chemical composition or crystallinity. Probably, TEM is the most versatile technique since it can provide all these three kinds of information. On the other hand, SECM provides new types of information ranging from spatially resolved distribution of (1) the electrochemical activity or (2) the electrically insulating character of the SEI across a real-world battery electrode. Hence, SECM provides unique information that cannot be obtained by other microscopies. In addition, SECM can operate under ex situ, in situ and even in operando conditions.6. Perspective of SECM in beyond Li-ion batteries
There is growing interest in some emerging electrochemical energy storage technologies which in one way or another present potential advantages over Li-ion batteries such as Na-ion, semi-solid flow, Li–sulphur or Li–air batteries. Although the application of SECM has not been extended to the study of all these emerging technologies yet, there are few exemplary cases indicating the feasibility of the SECM studies in the emerging battery systems.Schwager et al. studied gas diffusion electrodes (GDE) of Li–air batteries by means of SECM.77 They were able to in situ investigate the mass transport resistance of oxygen across the GDE.
SECM in feedback mode was employed by Ventosa et al. to evaluate the passivation of the current collector of semi-solid flow batteries.78 They concluded that operating potentials below 0.8 V vs. Li/Li+ should be avoided in semi-solid flow batteries (SSFBs) due to the hindered electron transfer between the current collector and the fluid electrode.
Zampardi et al. used SECM in feedback mode to study the SEI formation on glassy carbon for Na-ion batteries.52 An electronically insulating layer was found to be formed at the surface of the electrode when glassy carbon (used as a carbon model material) was polarized to 0.03 V vs. Na/Na+.
7. Conclusions
LIBs are complex systems that require the use of multiple and complementary analytical techniques in order to understand the variety of processes occurring simultaneously. Scanning electrochemical microscopy is an emerging analytical tool in this field. SECM has already been demonstrated to be a powerful technique providing valuable and unique information about LIBs. By selecting an appropriate operating mode, different processes can be studied under ex situ, in situ or in operando conditions. To date, SECM has been employed to gather information with respect to (i) spatially resolved visualisation of the activity of the LIB electrode at the nanoscale, which relates to bulk processes, and (ii) investigation of the properties of the SEI at the negative electrode, which relates to surface processes. The strength and potential of SECM to shed light on both bulk and surface processes were successfully demonstrated, making SECM a powerful technique as relevant as other well established techniques in the field of LIB characterisation such as TEM, XRD, XAS, XPS, Raman and IR spectroscopy. Nevertheless, much effort has to be devoted for the improvement of resolution in some of the operating modes of SECM, particularly in the feedback mode. Since the lateral resolution is restricted by the size of the microelectrode, the use of sub-micrometer SECM tips are necessary to enhance the lateral resolution. As a consequence, the implementation of tip-to-substrate distance control under anhydrous and deoxygenated conditions is an important step forward for SECM in LIBs.The great versatility of SECM allows the use of this technique to investigate a variety of processes. Therefore, SECM is likely able to provide valuable information about additional processes occurring at LIBs, provided that a specific mode is developed in each case. The successful implementation of SECM for other battery applications is still in its infancy but will definitively emerge in the near future.
Acknowledgements
Financial support from the DFG (Deutsche Forschungsgemeinschaft) in the framework of the Cluster of Excellence RESOLV (EXC1069) and the Helmholtz-Energie-Allianz “Stationäre elektrochemische Speicher und Wandler” (HA-E-0002) and MERCUR in the framework of the project NanoSiLiKat is gratefully acknowledged.Notes and references
- F. T. Wagner, B. Lakshmanan and M. F. Mathias, J. Phys. Chem. Lett., 2010, 1, 2204 CrossRef CAS
.
- M. Fehse and E. Ventosa, ChemPlusChem, 2015, 80, 785 CrossRef CAS PubMed
- L. J. Hardwick, M. Holzapfel, P. Novak, L. Dupont and E. Baudrin, Electrochim. Acta, 2007, 52, 5357 CrossRef CAS PubMed
- Y. Yang, S. Jeong, L. Hu, H. Wu, S. W. Lee and Y. Cui, Proc. Natl. Acad. Sci. U. S. A., 2011, 108, 13013 CrossRef CAS PubMed
- Z. Lu, Z. Chen and J. R. Dahn, Chem. Mater., 2003, 15, 3214 CrossRef CAS
- J. Nelson, S. Misra, Y. Yang, A. Jackson, Y. Liu, H. Wang, H. Dai, J. C. Andrews, Y. Cui and M. F. Toney, J. Am. Chem. Soc., 2012, 134, 6337 CrossRef CAS PubMed
- J. Breger, N. Dupre, P. J. Chupas, P. L. Lee, T. Proffen, J. B. Parise and C. P. Grey, J. Am. Chem. Soc., 2005, 127, 7529 CrossRef CAS PubMed
- N. Liu, H. Wu, M. T. McDowell, Y. Yao, C. Wang and Y. Cui, Nano Lett., 2012, 12, 3315 CrossRef CAS PubMed
- W.-S. Yoon, C. P. Grey, M. Balasubramanian, X.-Q. Yang and J. McBreen, Chem. Mater., 2003, 15, 3161 CrossRef CAS
- C. S. Johnson, J.-S. Kim, A. J. Kropf, A. J. Kahaian, J. T. Vaughey, L. M. L. Fransson, K. Edstrom and M. M. Thackeray, Chem. Mater., 2003, 15, 2313 CrossRef CAS
- A. S. Andersson, B. Kalska, L. Haggstromb and J. O. Thomas, Solid State Ionics, 2000, 130, 41 CrossRef CAS
- O. Mao, R. A. Dunlap and J. R. Dahn, J. Electrochem. Soc., 1999, 146, 405 CrossRef CAS PubMed
- C. P. Grey and N. Dupre, Chem. Rev., 2004, 104, 4493 CrossRef CAS
- B. Key, R. Bhattacharyya, M. Morcrette, V. Seznec, J.-M. Tarascon and C. P. Grey, J. Am. Chem. Soc., 2009, 131, 9239 CrossRef CAS PubMed
- A. R. Armstrong, M. Holzapfel, P. Novak, C. S. Johnson, S.-H. Kang, M. M. Thackeray and P. G. Bruce, J. Am. Chem. Soc., 2006, 128, 8694 CrossRef CAS PubMed
- F. La Mantia, F. Rosciano, N. Tran and P. Novak, J. Appl. Electrochem., 2008, 38, 893 CrossRef CAS
- P. Verma, P. Maire and P. Novak, Electrochim. Acta, 2010, 55, 6332 CrossRef CAS PubMed
- H. Bryngelsson, M. Stjerndahl, T. Gustafsson and K. Edström, J. Power Sources, 2007, 174, 970 CrossRef CAS PubMed
- E. Madej, F. La Mantia, B. Mei, S. Klink, M. Muhler, W. Schuhmann and E. Ventosa, J. Power Sources, 2014, 266, 155 CrossRef CAS PubMed
- A.-H. Zinn, S. Borhani-Haghighi, E. Ventosa, J. Pfetzing-Micklich, N. Wieczorek, W. Schuhmann and A. Ludwig, Phys. Status Solidi A, 2014, 211, 2650 CrossRef CAS PubMed
- D. Aurbach, A. Zaban, Y. Ein-Eli, I. Weissman, O. Chusid, B. Markovsky, M. Levi, E. Levi, A. Schechter and E. Granot, J. Power Sources, 1997, 68, 91 CrossRef CAS
- M. Winter, R. Imhof, F. Joho and P. Novak, J. Power Sources, 1997, 81–82, 818 Search PubMed
- S. Klink, E. Madej, E. Ventosa, A. Lindner, W. Schuhmann and F. La Mantia, Electrochem. Commun., 2012, 22, 120 CrossRef CAS PubMed
- M. D. Levi, V. Dargel, Y. Shilina, D. Aurbach and I. C. Halalay, Electrochim. Acta, 2014, 149, 126 CrossRef CAS PubMed
- D. Alliata, R. Kotz, P. Novak and H. Siegenthaler, Electrochem. Commun., 2000, 2, 436 CrossRef CAS
- L. Y. Beaulieu, T. D. Hatchard, A. Bonakdarpour, M. D. Fleischauer and J. R. Dahn, J. Electrochem. Soc., 2003, 150, A1457 CrossRef CAS PubMed
- J. Zhang, R. Wang, X. Yang, W. Lu, X. Wu, X. Wang, H. Li and L. Chen, Nano Lett., 2012, 12, 2153 CrossRef CAS PubMed
- N. Weadock, N. Varongchayakul, J. Wan, S. Lee, J. Seog and L. Hu, Nano Energy, 2013, 2, 713 CrossRef CAS PubMed
- H. Buqa, A. Wursig, J. Vetter, M. E. Spahr, F. Krumeich and P. Novak, J. Power Sources, 2006, 153, 385 CrossRef CAS PubMed
- M. Nie, D. P. Abraham, Y. Chen, A. Bose and B. L. Lucht, J. Phys. Chem. C, 2013, 117, 13403 CAS
- M. Nie, D. Chalasani, D. P. Abraham, Y. Chen, A. Bose and B. L. Lucht, J. Phys. Chem. C, 2013, 117, 1257 CAS
- E. Ventosa, M. Skoumal, F. J. Vazquez, C. Flox, J. Arbiol and J. R. Morante, ChemSusChem, 2015, 8, 1737–1744 CrossRef CAS PubMed
- K. Eckhard, X. Chen, F. Turcu and W. Schuhmann, Phys. Chem. Chem. Phys., 2006, 8, 5359 RSC
- J. L. Fernandez, D. A. Walsh and A. J. Bard, J. Am. Chem. Soc., 2005, 127, 357 CrossRef CAS PubMed
- A. R. Zeradjanin, E. Ventosa, A. S. Bondarenko and W. Schuhmann, ChemSusChem, 2012, 5, 1905 CrossRef CAS PubMed
- P. Bertoncello, Energy Environ. Sci., 2010, 3, 11 Search PubMed
- L. Niu, Y. Yin, W. Guo, M. Lu, R. Qin and S. Chen, J. Mater. Sci., 2009, 44, 4511 CrossRef CAS
- C. H. Paik, H. S. White and R. C. Alkire, J. Electrochem. Soc., 2000, 147, 4120 CrossRef CAS PubMed
- M. V. Mirkin and B. R. Horrocks, Anal. Chim. Acta, 2000, 406, 119 CrossRef CAS
- M. A. Edwards, S. Martin, A. L. Whitworth, J. V. Macpherson and P. R. Unwin, Physiol Meas, 2006, 27, R63 CrossRef PubMed
- S. Amemiya, A. J. Bard, F. R. F. Fan, M. V. Mirkin and P. R. Unwin, Annu. Rev. Anal. Chem., 2008, 1, 95 CrossRef CAS PubMed
- A. K. Neufeld, A. P. O'Mullane and A. M. Bond, J. Am. Chem. Soc., 2005, 127, 13846 CrossRef CAS PubMed
- A. L. Barker, M. Gonsalves, J. V. Macpherson, C. J. Slevin and P. R. Unwin, Anal. Chim. Acta, 1999, 385, 223–240 CrossRef CAS
- F. Xu, B. Beak and C. Jung, J. Solid State Electrochem., 2012, 16, 305 CrossRef CAS PubMed
- G. A. Snook, T. D. Huynh, A. F. Hollenkamp and A. S. Best, J. Electroanal. Chem., 2012, 687, 30 CrossRef CAS PubMed
- Z. J. Barton and J. Rodriguez-Lopez, Anal. Chem., 2014, 86, 10660 CrossRef CAS PubMed
- T. Takahashi, A. Kumatani, H. Munakata, H. Inomata, K. Ito, K. Ino, H. Shiku, P. R. Unwin, Y. E. Korchev, K. Kanamura and T. Matsue, Nat. Commun., 2014, 5, 5450 CrossRef PubMed
- A. L. Lipson, R. S. Ginder and M. C. Hersam, Adv. Mater., 2011, 23, 5613 CrossRef CAS PubMed
- N. Balke, S. Jesse, A. N. Morozovska, E. Eliseev, D. W. Chung, Y. Kim, L. Adamczyk, R. E. Garcia, N. Dudney and S. V. Kalinin, Nat. Nanotechnol., 2010, 5, 749 CrossRef CAS PubMed
- N. Balke, S. Jesse, Y. Kim, L. Adamczyk, A. Tselev, I. N. Ivanov, N. J. Dudney and S. V. Kalinin, Nano Lett., 2010, 10, 3420 CrossRef CAS PubMed
- G. Zampardi, S. Klink, V. Kuznetsov, T. Erichsen, A. Maljusch, F. La Mantia, W. Schuhmann and E. Ventosa, ChemElectroChem, 2015 DOI:10.1002/celc.201500085
- G. Zampardi, F. La Mantia and W. Schuhmann, RSC Adv., 2015, 5, 31166 RSC
- F. La Mantia and P. Novak, Electrochem. Solid-State Lett., 2008, 11, A84 CrossRef CAS PubMed
- G. Zampardi, E. Ventosa, F. La Mantia and W. Schuhmann, Chem. Commun., 2013, 49, 9347 RSC
- G. Zampardi, E. Ventosa, F. La Mantia and W. Schuhmann, Electroanalysis, 2015, 27, 1017 CrossRef CAS PubMed
- H. Bülter, F. Peters, J. Schwenzel and G. Wittstock, Angew. Chem., Int. Ed., 2014, 53, 10531 CrossRef PubMed
-
D. Linden and T. B. Reddy, Handbook of batteries, McGraw-Hill, 3rd edn, 2002ch. 35 Search PubMed
- S. S. Zhang, J. Power Sources, 2006, 162, 1379 CrossRef CAS PubMed
- J. B. Goodenough and Y. Kim, Chem. Mater., 2010, 22, 587 CrossRef CAS
- M. A. Edwards, S. Martin, A. L. Whitworth, J. V. Macpherson and P. R. Unwin, Physiol Meas, 2006, 27, R63 CrossRef PubMed
- P. Sun, F. O. Laforge and M. V. Mirkin, Phys. Chem. Chem. Phys., 2007, 9, 802 RSC
- S. Amemiya, A. J. Bard, F.-R. F. Fan, M. V. Mirkin and P. R. Unwin, Annu. Rev. Anal. Chem., 2008, 1, 95 CrossRef CAS PubMed
- P. Bertoncello, Energy Environ. Sci., 2010, 3, 1620 CAS
- C. Combellas, J. Ghilane, F. Kanoufi and D. Mazouzi, J. Phys. Chem. B, 2004, 108, 6391 CrossRef CAS PubMed
- N. Ktari, S. Nunige, A. Azioune, M. Piel, C. Connan, F. Kanoufi and C. Combellas, Chem. Mater., 2010, 22, 5725 CrossRef CAS
- W. Nogala, K. Szot, M. Burchardt, F. Roelfs, J. Rogalski, M. Opallo and G. Wittstock, Analyst, 2010, 135, 2051 RSC
- J. Rodriguez-Lopez, M. Shen, A. B. Nepomnyashchii and A. J. Bard, J. Am. Chem. Soc., 2012, 134, 9240 CrossRef CAS PubMed
- Z. Chen, I. Belharouak, Y.-K. Sun and K. Amine, Adv. Funct. Mater., 2013, 23, 959 CrossRef CAS PubMed
- R. Bernhard, S. Meini and H. A. Gasteiger, J. Electrochem. Soc., 2014, 161, A497 CrossRef CAS PubMed
- Y.-B. He, B. Li, M. Liu, C. Zhang, W. Lv, C. Yang, J. Li, H. Du, B. Zhang, Q.-H. Yang, J.-K. Kim and F. Kang, Sci. Rep., 2012, 2, 913 Search PubMed
- S. Brutti, V. Gentili, H. Menard, B. Scrosati and P. G. Bruce, Adv. Energy Mater., 2012, 2, 322 CrossRef CAS PubMed
- R. Elazari, G. Salitra, Y. Talyosef, J. Grinblat, C. Scordilis-Kelley, A. Xiao, J. Affinito and D. Aurbach, J. Electrochem. Soc., 2010, 157, A1131 CrossRef CAS PubMed
- T. Nishi, H. Nakai and A. Kita, J. Electrochem. Soc., 2013, 160, A1785 CrossRef CAS PubMed
- X. H. Liu, J. W. Wang, S. Huang, F. Fan, X. Huang, Y. Liu, S. Krylyuk, J. Yoo, S. A. Dayeh, A. V. Davydov, S. X. Mao, S. T. Picraux, S. Zhang, J. Li, T. Zhu and J. Y. Huang, Nat. Nanotechnol., 2012, 7, 749 CrossRef CAS PubMed
- J. W. Wang, X. H. Liu, S. X. Mao and J. Y. Huang, Nano Lett., 2012, 12, 5897 CrossRef CAS PubMed
- Y. Zhu, J. W. Wang, Y. Liu, X. Liu, A. Kushima, Y. Liu, Y. Xu, S. X. Mao, J. Li, C. Wang and J. Y. Huang, Adv. Mater., 2013, 25, 5461 CrossRef CAS PubMed
- P. Schwager, D. Fenske and G. Wittstock, J. Electroanal. Chem., 2015, 740, 82 CrossRef CAS PubMed
- E. Ventosa, G. Zampardi, C. Flox, F. La Mantia, W. Schuhmann and J. R. Morante, under review.
| This journal is © the Owner Societies 2015 |