 Open Access Article
UV photodissociation spectroscopy of cryogenically cooled gas phase host–guest complex ions of crown ethers†
Yoshiya
Inokuchi
a,
Takeharu
Haino
a,
Ryo
Sekiya
a,
Fumiya
Morishima
a,
Claude
Dedonder
b,
Géraldine
Féraud
b,
Christophe
Jouvet
*b and
Takayuki
Ebata
*a
aDepartment of Chemistry, Graduate School of Science, Hiroshima University, Higashi-Hiroshima 739-8526, Japan. E-mail: tebata@hiroshima-u.ac.jp
bCNRS, Aix Marseille Université, Physique des Interactions Ioniques et Moléculaires (PIIM) UMR 7345, 13397 Marseille Cedex, France. E-mail: christophe.jouvet@univ-amu.fr
First published on 5th June 2015
Abstract
The geometric and electronic structures of cold host–guest complex ions of crown ethers (CEs) in the gas phase have been investigated by ultraviolet (UV) fragmentation spectroscopy. As host CEs, we chose 15-crown-5 (15C5), 18-crown-6 (18C6), 24-crown-8 (24C8), and dibenzo-24-crown-8 (DB24C8), and as guests protonated-aniline (aniline·H+) and protonated-dibenzylamine (dBAM·H+) were chosen. The ions generated by an electrospray ionization (ESI) source were cooled in a quadrupole ion-trap (QIT) using a cryogenic cooler, and UV spectra were obtained by UV photodissociation (UVPD) spectroscopy. UV spectroscopy was complemented by quantum chemical calculations of the most probable complex structures. The UV spectrum of aniline·H+·CEs is very sensitive to the symmetry of CEs; aniline·H+·18C6 shows a sharp electronic spectrum similar to aniline·H+, while aniline·H+·15C5 shows a very broad structure with poor Franck–Condon factors. In addition, a remarkable cage effect in the fragmentation process after UV excitation was observed in both complex ions. In aniline·H+·CE complexes, the cage effect completely removed the dissociation channels of the aniline·H+ moiety. A large difference in the fragmentation yield between dBAM·H+·18C6 and dBAM·H+·24C8 was observed due to a large barrier for releasing dBAM·H+ from the axis of rotaxane in the latter complex.
Introduction
Crown ethers (CEs) are macrocyclic ethers built with oxyethylene (–CH2–CH2–O–) units. Pedersen synthesized the first crown ether (CE) dibenzo-18-crown-6 (DB18C6), in 1967 and investigated complexation with various metal salts1,2 using UV spectroscopy. Since then, CEs have been playing an important role in host–guest and supramolecular chemistry. CEs can include not only metal ions in their cavity but also form various complexes with ionic and neutral species through non-covalent interactions. Applications of CEs as molecular receptors, metal cation extraction agents, fluoroionophores and phase transfer catalytic media have been described in a number of studies.3–14 Especially, it is well known that, in the condensed phase, CEs exhibit selectivity when they include the guest species.9–14 This selectivity is described by the matching between the size of the guest species and that of the CE cavity. On the other hand, the host–guest binding energy measured in the gas phase shows different characteristics from those observed in the condensed phase.15–17 This discrepancy requires the search for more information on the intrinsic nature of CEs, such as the flexibility of the CE frame and conformation preference, as well as solvent effects on the stability of the inclusion complexes.To investigate the difference between condensed phase and gas phase studies and to obtain information on the host–guest interaction at the microscopic level, we have been studying the structures, conformation preference, and selectivity of guests for the inclusion complexes of CEs in the gas phase.18–27 The cold gas phase complexes are generated either by the supersonic expansion technique for neutral complexes18–24 or by the electrospray ionization (ESI)/cold ion-trap method for ionic complexes.24–27 We apply various laser spectroscopic methods to record conformer specific UV and IR spectra, and the spectra are analyzed by comparing with the spectra of possible complexes obtained by quantum chemical calculations. Based on these studies, we reported that the conformations of CEs in the inclusion complexes are generally different from the most stable conformer of bare forms, because CEs will change their structures so that they can include the different size and structure of guest species in their cavities.20,22,23
In the present work, we report a study on host–guest complexes of CEs with protonated aromatic amines. CEs can be good receptors of protonated amines since stable complexes can be formed via multiple NH⋯O hydrogen bonds. First, we investigate the inclusion complexes of protonated aniline (aniline·H+) with 18-crown-6 (18C6) and 15-crown-5 (15C5). These complexes have a structure in which the NH3+ group of aniline·H+ (guest) is bonded to 18C6 or 15C5 (host) through N–H⋯O hydrogen bonds. In a previous study, we reported that UV photodissociation (UVPD) of aniline·H+ generates aniline+ and C6H5+ fragment ions.28 Here we examine how the complex formation affects the electronic spectrum of aniline·H+ as well as the UVPD pattern. Second, we report the host–guest complexes between protonated dibenzylamine (dBAM·H+) with 18C6, 24-crown-8 (24C8), and dibenzo-24-crown-8 (DB24C8). dBAM·H+ is used as an axis molecule of rotaxane. Rotaxane molecules have attracted great interest due to their potential use in molecular machines, such as molecular switches29–33 and molecular shuttles.34–36 In this study, we recorded the UV electronic spectra and the fragmentation yield after UV excitation of the complexes between dBAM·H+ and 18C6, 24C8 and DB24C8. We investigate how the complex or rotaxane formation changes the electronic structure of constituent chromophores and the UVPD pattern by comparing the observed spectra with those of the possible structures obtained by quantum chemical calculations.
Experimental and computational
Experimental setup
The experimental setup has been described in previous papers.28,37,38 The setup consists of three parts: an ESI source, a cryogenically cooled quadrupole-ion-trap (QIT) and a time-of-flight mass spectrometer (TOF-Mass).39,40 Protonated ions are produced in the ESI source41 and trapped in an octopole trap at the exit of the capillary. They are extracted by a negative electric pulse and are further accelerated by a second electric pulse just after the exit electrode. The ions are driven by a couple of electrostatic lenses toward the Paul trap. A mass gate at the entrance of the trap selects the parent ion. The ions are trapped in the Paul trap cooled using a cryostat (Coolpak Oerlikon) and filled with helium buffer gas injected using a pulsed valve. The ions are thermalized at around 30 K while they stay in the trap. After 60 ms, the UV laser is introduced to dissociate the cold ions, and after another 30 ms the fragments and remaining parent ions are extracted using a TOF spectrometer and are detected using a microchannel plate (MCP) detector. The UV spectrum is obtained by scanning the laser frequency and recording the ion fragments using a MCP detector. We use an OPO laser (EKSPLA model-NT342B) as the UV light source, and its spectral resolution is 8 cm−1. The unfocused laser is shaped to a 2 mm2 spot in the trap, corresponding to a power of ca. 5 mW.Computational
For the structural calculation of dBAM·H+, and complexes of aniline·H+ and dBAM·H+ with crown ethers, possible conformers were first searched by selecting some initial geometries optimized at the AM1 level,42 and the obtained structures were optimized by density functional theory calculations using M05-2X/6-31+G*.To obtain plausible structures of DB24C8·H+ and dBAM·H+·DB24C8 complexes, we first used a classical force field to search initial conformations. We performed a Monte Carlo simulation by a mixed torsional search with low-mode sampling using MacroModel43 V.9.1 with a MMFF94s force field,44 and optimized the geometries using the Polak–Ribiere conjugate gradient (PRCG) algorithm45 with a convergence threshold of 0.05 kJ mol−1. From this calculation, 10 isomers for the DB24C8·H+ complex and 3 isomers for dBAM·H+·DB24C8 were obtained within 10 kJ mol−1 of the most stable one. All these isomers were geometry-optimized by DFT calculations at the M05-2X/6-31+G* level with loose optimization criteria. Quantum chemical calculations were performed using the Gaussian 09 program package.46
Synthesis of materials
Dibenzylammonium hexafluorophosphate (dBAM·H+·PF6−): dBAM·H+·PF6− was synthesized by a procedure previously reported by Ashton et al.47 Aqueous hydrogen chloride (1 mol L−1, 26.1 mL) was added to dibenzylamine (26.1 mmol), and the solution was stirred for 1.5 h at room temperature. The solvent was removed under vacuum and the residue was dissolved in hot deionized water (100 mL, 70 °C). Saturated aqueous ammonium hexafluorophosphate was added until no further precipitation occurred. The white solid was filtered off and dried to afford 8.34 g of the desired product (93%).Pseudo-rotaxanes: dBAM·H+·DB24·PF6− was prepared from DB24C8 and dBAM·H+·PF6−. DB24C8 (100 mg, 0.222 mmol) was dissolved in chloroform (10 mL), and then dBAM·H+·PF6− salt (76.6 mg, 0.223 mmol) was added. After being stirred for 1 h at room temperature, the mixture was concentrated in vacuo to afford 167 mg of the pseudo-rotaxane (94%) as a white solid.
dBAM·H+·24C8·PF6− was prepared from 24C8 and dBAM·H+·PF6−. 24C8 (72.0 mg, 0.204 mmol) was dissolved in chloroform (5 mL), and then dBAM·H+·PF6− salt (70.1 mg, 0.204 mmol) was added. After being stirred for 0.5 h at room temperature, the mixture was concentrated in vacuo to afford 132 mg of the pseudo-rotaxane (93%) as a white solid.
The rotaxane formation was confirmed using dBAM·H+ NMR spectroscopy. The catechol protons split two resonances, one of which was slightly upfield-shifted. Two sets of the oxymethylene protons of DB24C8 showed the up-field shifts of 0.16 and 0.05 ppm, respectively. Two benzene rings of bound dBAM·H+·PF6− face one another as found in the crystal structure. The crown moiety is placed within the cleft of the benzene rings; therefore, aromatic shielding most likely resulted in the up-field shifts of the crown protons. A similar chemical shift change was observed in the 1H NMR spectrum of dBAM·H+·24C8·PF6−. The oxyethylene protons of 24C8 showed an up-field shift of 0.19 ppm. These sets of evidence are consistent with those reported by Ashton et al.47
Results and discussion
1. Protonated aniline·crown ether complex ions
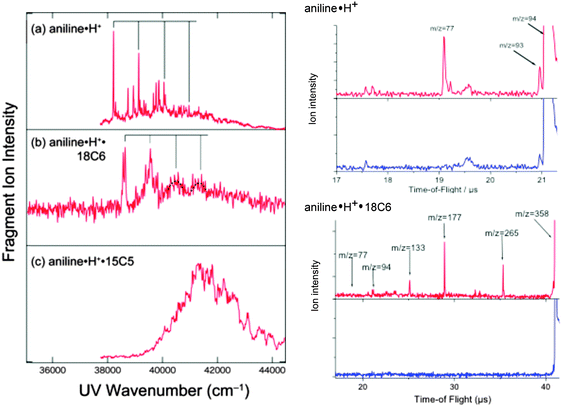
The left panel of Fig. 1 shows the UVPD spectra of (a) aniline·H+, (b) aniline·H+·18C6, and (c) aniline·H+·15C5 ions in the 35![[thin space (1/6-em)]](https://www.rsc.org/images/entities/char_2009.gif) 000–44
000–44![[thin space (1/6-em)]](https://www.rsc.org/images/entities/char_2009.gif) 000 cm−1 region. The excess proton in aniline H+ is attached to the amino group, forming the anilinium ion, C6H5NH3+. The right panel of Fig. 1 shows the time of flight (TOF) spectra of aniline·H+ without (blue) and with UV (red) laser irradiation. As shown in the figure, the main photofragment ions for aniline·H+ are aniline+ (m/z = 93) and C6H5+ (m/z = 77), produced by H atom loss or NH3 loss, respectively.45 The UVPD spectrum of the aniline·H+ ion shows a band origin at 38
000 cm−1 region. The excess proton in aniline H+ is attached to the amino group, forming the anilinium ion, C6H5NH3+. The right panel of Fig. 1 shows the time of flight (TOF) spectra of aniline·H+ without (blue) and with UV (red) laser irradiation. As shown in the figure, the main photofragment ions for aniline·H+ are aniline+ (m/z = 93) and C6H5+ (m/z = 77), produced by H atom loss or NH3 loss, respectively.45 The UVPD spectrum of the aniline·H+ ion shows a band origin at 38![[thin space (1/6-em)]](https://www.rsc.org/images/entities/char_2009.gif) 215 cm−1, which is ∼4200 cm−1 blue-shifted as compared to the transition origin of neutral aniline (34
215 cm−1, which is ∼4200 cm−1 blue-shifted as compared to the transition origin of neutral aniline (34![[thin space (1/6-em)]](https://www.rsc.org/images/entities/char_2009.gif) 027 cm−1).48 This blue shift between the transitions of ionic and neutral species is the largest observed for the systems investigated here. It can be assigned to the deconjugation of the nitrogen lone pair when H+ attaches to the amino group so that aniline·H+ has a toluene like electronic structure (the (0,0) band of the toluene S1–S0 transition is located at 37
027 cm−1).48 This blue shift between the transitions of ionic and neutral species is the largest observed for the systems investigated here. It can be assigned to the deconjugation of the nitrogen lone pair when H+ attaches to the amino group so that aniline·H+ has a toluene like electronic structure (the (0,0) band of the toluene S1–S0 transition is located at 37![[thin space (1/6-em)]](https://www.rsc.org/images/entities/char_2009.gif) 477 cm−1).46,49 A progression in a mode of ∼920 cm−1 can be followed by starting from the band origin, as shown with solid lines in Fig. 1a, which is assigned to the ring breathing mode (mode 1).50 This frequency is closer to that of neutral toluene (935 cm−1) than that of aniline (952 cm−1).
477 cm−1).46,49 A progression in a mode of ∼920 cm−1 can be followed by starting from the band origin, as shown with solid lines in Fig. 1a, which is assigned to the ring breathing mode (mode 1).50 This frequency is closer to that of neutral toluene (935 cm−1) than that of aniline (952 cm−1).
In the case of the aniline·H+·18C6 complex, two sharp bands are observed at 38![[thin space (1/6-em)]](https://www.rsc.org/images/entities/char_2009.gif) 565 and 38
565 and 38![[thin space (1/6-em)]](https://www.rsc.org/images/entities/char_2009.gif) 640 cm−1 (Fig. 1b). Since one cannot see any strong band or progression around these two bands, they may probably be ascribed to the origin band of two different isomers. The position of the origin bands is much closer to that of aniline·H+ than to that of neutral aniline, thus the proton is still located on the amino group of the aniline part. The UVPD spectrum of aniline·H+·18C6 also shows a progression with an interval of ∼920 cm−1 similar to aniline·H+ as highlighted by solid lines in Fig. 1b, although the transitions to higher vibrational levels show broadened features. Since the frequency of the ring breathing mode is almost the same for aniline·H+ and aniline·H+·18C6 ions, the benzene ring in the aniline·H+·18C6 ion seems not to be strongly affected by the 18C6 part. The right panel of Fig. 1 shows the TOF spectra of aniline·H+·18C6. We find that the fragment pattern is quite different from that of aniline·H+. Three photofragment ions are observed for aniline·H+·18C6; 18C6·H+ (m/z = 265), (OCH2CH2)4·H+ (m/z = 177), and (OCH2CH2)3·H+ (m/z = 133); no fragment ion due to the dissociation of the aniline·H+ part, H loss (dissociation of an NH bond) or NH3 loss (dissociation of the CN bond), is observed. The CN bond breaking observed in the UVPD of aniline·H+ could lead to the formation of the CE·NH3+ fragment, but is not observed either. The fragmentation pattern rather indicates that a proton transfer occurs from aniline·H+ to 18C6 after the UV excitation, and the excess energy initially injected in the aniline·H+ part efficiently flows to the 18C6 part. After UV excitation, the aniline·H+·18C6 complex may relax to the ground state and transfer a proton and energy to the 18C6 part, leading to fragmentation in aniline and 18C6·H+. 18C6·H+ has enough internal energy to further fragment into (OCH2CH2)4·H+ or (OCH2CH2)3·H+ as observed. Thus, 18C6 has a role of a reservoir of energy; the energy initially imparted by the optical excitation into electronic and vibrational energy of the aniline part is transferred to 18C6, a kind of cage effect. As shown in Fig. S1 in the ESI,† the intensity of the (OCH2CH2)4·H+ fragment ion becomes stronger than that of 18C6·H+ with increasing UV photon energy; the formation of (OCH2CH2)4·H+ requires more energy than that of 18C6·H+ and the fragmentation occurs statistically after the proton and energy transfer from aniline·H+ to 18C6.
640 cm−1 (Fig. 1b). Since one cannot see any strong band or progression around these two bands, they may probably be ascribed to the origin band of two different isomers. The position of the origin bands is much closer to that of aniline·H+ than to that of neutral aniline, thus the proton is still located on the amino group of the aniline part. The UVPD spectrum of aniline·H+·18C6 also shows a progression with an interval of ∼920 cm−1 similar to aniline·H+ as highlighted by solid lines in Fig. 1b, although the transitions to higher vibrational levels show broadened features. Since the frequency of the ring breathing mode is almost the same for aniline·H+ and aniline·H+·18C6 ions, the benzene ring in the aniline·H+·18C6 ion seems not to be strongly affected by the 18C6 part. The right panel of Fig. 1 shows the TOF spectra of aniline·H+·18C6. We find that the fragment pattern is quite different from that of aniline·H+. Three photofragment ions are observed for aniline·H+·18C6; 18C6·H+ (m/z = 265), (OCH2CH2)4·H+ (m/z = 177), and (OCH2CH2)3·H+ (m/z = 133); no fragment ion due to the dissociation of the aniline·H+ part, H loss (dissociation of an NH bond) or NH3 loss (dissociation of the CN bond), is observed. The CN bond breaking observed in the UVPD of aniline·H+ could lead to the formation of the CE·NH3+ fragment, but is not observed either. The fragmentation pattern rather indicates that a proton transfer occurs from aniline·H+ to 18C6 after the UV excitation, and the excess energy initially injected in the aniline·H+ part efficiently flows to the 18C6 part. After UV excitation, the aniline·H+·18C6 complex may relax to the ground state and transfer a proton and energy to the 18C6 part, leading to fragmentation in aniline and 18C6·H+. 18C6·H+ has enough internal energy to further fragment into (OCH2CH2)4·H+ or (OCH2CH2)3·H+ as observed. Thus, 18C6 has a role of a reservoir of energy; the energy initially imparted by the optical excitation into electronic and vibrational energy of the aniline part is transferred to 18C6, a kind of cage effect. As shown in Fig. S1 in the ESI,† the intensity of the (OCH2CH2)4·H+ fragment ion becomes stronger than that of 18C6·H+ with increasing UV photon energy; the formation of (OCH2CH2)4·H+ requires more energy than that of 18C6·H+ and the fragmentation occurs statistically after the proton and energy transfer from aniline·H+ to 18C6.
In contrast to aniline·H+ and aniline·H+·18C6, the UVPD spectrum of aniline·H+·15C5 (Fig. 1c) shows a broad absorption in the region of 39![[thin space (1/6-em)]](https://www.rsc.org/images/entities/char_2009.gif) 000–44
000–44![[thin space (1/6-em)]](https://www.rsc.org/images/entities/char_2009.gif) 000 cm−1. In aniline·H+·15C5, the proton is attached to the NH2 group of the aniline part as in aniline·H+·18C6. However, the UV spectrum of the aniline·H+·15C5 ion is quite different from that of aniline·H+·18C6, which may imply a poor Franck–Condon overlap between the S0 and S1 states.
000 cm−1. In aniline·H+·15C5, the proton is attached to the NH2 group of the aniline part as in aniline·H+·18C6. However, the UV spectrum of the aniline·H+·15C5 ion is quite different from that of aniline·H+·18C6, which may imply a poor Franck–Condon overlap between the S0 and S1 states.
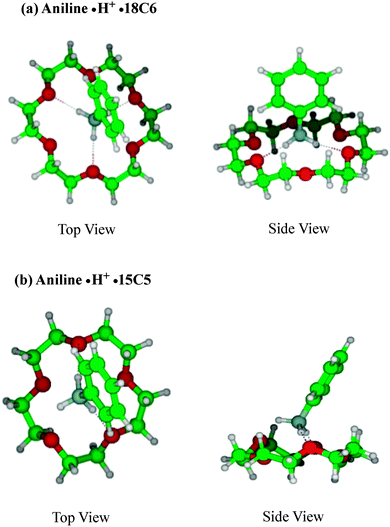
Fig. 2 shows the typical structures of (a) aniline·H+·18C6 and (b) aniline·H+·15C5 complexes. In the aniline·H+·18C6 complex, the NH3+ group is bonded to 18C6 through three N–H⋯O hydrogen bonds as was expected. This intermolecular bond seems to result in effective proton transfer from aniline·H+ to 18C6 after the UV excitation. The H⋯O distances are almost the same (∼1.83 Å) for all the three hydrogen bonds; the 18C6 cavity seems to be well fitted to the NH3+ group. The 18C6 component and the aromatic ring are located apart, so that there is no strong intermolecular interaction between 18C6 and the benzene ring, which is consistent with the similar frequency observed in the UVPD spectra of aniline·H+ and aniline·H+·18C6 ions for the benzene breathing-mode. The proton transfer from aniline·H+ to 18C6 after UV excitation of the complex is understood in terms of larger proton affinity (PA) of the crown ether (967.0 kJ mol−1) than that of aniline (882.5 kJ mol−1).51 After UV excitation, the proton transfer occurs from aniline·H+ to 18C6 in the S1 excited state of the complex or after the relaxation to S0 by internal conversion (IC).
For the aniline·H+·15C5 complex, the proton is also initially situated on the aniline molecule, and the aniline·H+ ion is bonded to 15C5 through two N–H⋯O hydrogen bonds, instead of three H-bonds in aniline·H+·18C6. The PA of 15C5 is 943.8 kJ mol−1,48 larger than that of aniline; thus, after UV excitation, the proton of aniline·H+ is also transferred to 15C5. The difference in the UV spectral patterns between the aniline·H+·18C6 and aniline·H+·15C5 ions can be assigned to the asymmetry of the hydrogen bond network in the aniline·H+·15C5 ion that distorts the structure of the complex and leads to a change in geometry between the ground and excited states, which results in a poor Franck–Condon overlap in the UVPD spectrum (Fig. 1c). Another possibility to explain the broad feature of the UV spectrum of aniline·H+·15C5 is the coexistence of other isomer(s) in aniline·H+·15C5. Pasker et al. investigated aniline·H+ and its complexes by infrared photo-dissociation (IRPD) spectroscopy and theoretical calculations,52 and reported that aniline·H+ has two almost equally stable isomers, the ammonium and carbenium isomers, and that their relative population changes with complexation. It may be possible that the asymmetrical hydrogen-bonding of the aniline·H+·15C5 complex induces a larger population of the carbenium isomers, which should have different vibronic structures than the ammonium type isomer. However, calculations show that the ground state carbenium complex with 15C5 is more than 1 eV higher in energy than the anilinium·15C5 complex, because in the carbenium ion the positive charge is largely delocalized whereas in the ammonium ion the charge is well localized on the ammonium group.
The UV excitation does not produce any fragment ion via the loss of H atom or NH3 loss neither in aniline·H+·18C6 nor in aniline·H+·15C5, which differs from the UVPD of bare aniline·H+. The crown ether induced cage effect on the fragmentation of anilinium is surprising. While it is easy to understand that the cage will suppress the H loss channel from anilinium, the absence of the NH3 loss channel, which is one of the major fragments in the anilinium ion, is unexpected. This is in contrast to the protonated tryptamine case in which the C–NH3 bond breaking is observed both in the free ion53 and in the complex with 18C6.54 In the complex, this fragmentation channel was assigned to an excited state dissociation, which thus seems to be absent in anilinium·CE complexes.
2. Protonated dibenzylamine (dBAM·H+)
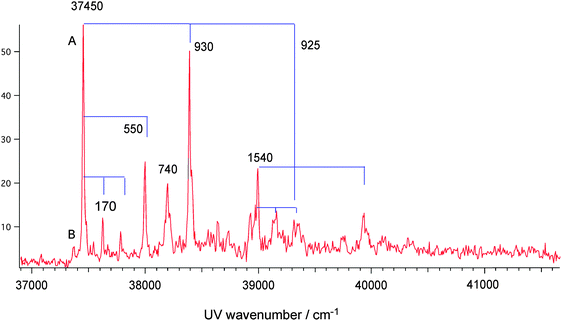
Protonated dibenzylamine (dBAM·H+) is used as an axis molecule in pseudo-rotaxane. We investigate how the rotaxane formation affects the electronic transition of dBAM·H+. Fig. 3 shows the UVPD spectrum of dBAM·H+ obtained by monitoring the m/z = 107 (C7NH9+) major fragment. The spectrum is essentially the same as that reported in our previous paper,38 except the spectrum is recorded in a wider energy region. A sharp (0,0) band appears at 37![[thin space (1/6-em)]](https://www.rsc.org/images/entities/char_2009.gif) 450 cm−1 (band A) along with several sharp vibronic bands involving torsional mode (170 cm−1) and skeletal modes (550, 745, 930 and 1540 cm−1). The vibronic structure corresponding to skeletal modes is very similar to that of aniline·H+. Additionally, a weak band (band B) is observed at 70 cm−1 on the lower frequency side of band A. We investigated the temperature dependence of bands A and B, and found that the relative intensity of band B with respect to band A increases with the increase of the temperature of the trap (see ESI,† Fig. S2). Thus it is found that band B is due to either a hot band or a higher energy conformer.
450 cm−1 (band A) along with several sharp vibronic bands involving torsional mode (170 cm−1) and skeletal modes (550, 745, 930 and 1540 cm−1). The vibronic structure corresponding to skeletal modes is very similar to that of aniline·H+. Additionally, a weak band (band B) is observed at 70 cm−1 on the lower frequency side of band A. We investigated the temperature dependence of bands A and B, and found that the relative intensity of band B with respect to band A increases with the increase of the temperature of the trap (see ESI,† Fig. S2). Thus it is found that band B is due to either a hot band or a higher energy conformer.
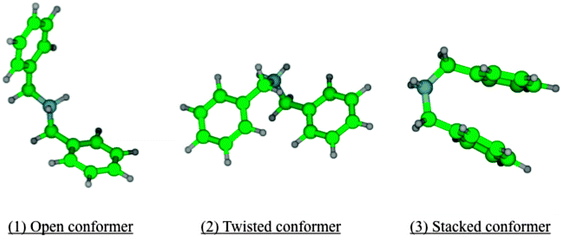
Possible structures of dBAM·H+ have been investigated by DFT calculations at the M05-2X/6-31+G* level. Three stable conformers were obtained: (1) an open conformer, (2) a twisted conformer, and (3) a stacked conformer as shown in Fig. 4. Table 1 shows their relative ground state and vertical excitation energies. Conformers (1) and (2) have very similar ground state energies; conformer (2) being 4.3 kJ mol−1 higher than conformer (1) without zero point energy (ZPE) correction. Conformer (3) has a higher energy (85.4 kJ mol−1), and is not expected to be present in the trap. Since dBAM·H+ has two benzene chromophores, we expect two closely lying electronic states, S1 and S2, corresponding to the excitation of each of the two chromophores. In the UVPD spectrum, strong band A and weak band B are observed. Since they show different temperature dependencies, band A can be assigned to the most stable open conformer and band B to the twisted conformer. Table 1 also lists the vertical excitation energies to S1 and S2 states and their oscillator strengths calculated by TD-DFT calculations at the M05-2X/6-31+G* level. As shown in Table 1, S1 and S2 states are located at almost the same energy for the open and twisted conformers, and the oscillator strength of the S1–S0 transition of the open conformer is zero, which is due to the cancelation of the transition dipoles of the two constituent benzene chromophores. The calculated results are in accordance with the observation of a single band origin, band A, in the UVPD spectrum corresponding to the open conformer, and weak band B corresponding to the twisted conformer.
| Conformer | Open | Twisted | Stacked |
|---|---|---|---|
| S0 (kJ mol−1) | 0 | 4.3 | 85.4 |
| S1 (eV) | 5.57 (0.0) | 5.56 (2.0 × 10⁻⁴) | 4.93 (0.0) |
| S2 (eV) | 5.58 (9.8 × 10⁻³) | 5.57 (8.1 × 10⁻³) | 5.12 (3.9 × 10⁻²) |
3. Complexes of dBAM·H+ with 18C6 and 24C8
dBAM·H+ does not go through the 18C6 ring due to steric hindrance, but dBAM·H+ can go through the 24C8 ring to form a pseudo-rotaxane.47 So, we investigated how the difference in complex structure will be reflected in the UV spectra and fragmentation yields of the two complexes.
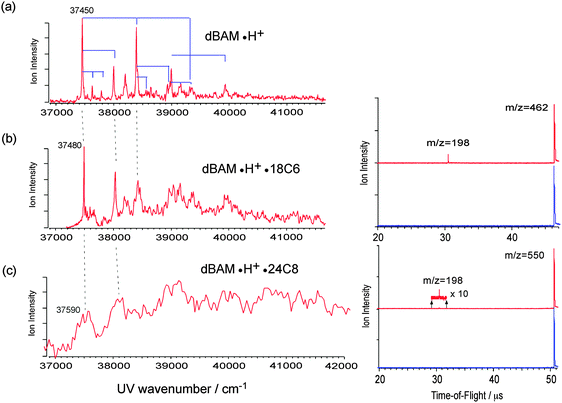
Fig. 5b and c show the UVPD spectra of dBAM·H+·18C6 and dBAM·H+·24C8 complex ions. At the opposite of the aniline·H+·18C6 UVPD, we observed dBAM·H+ fragment ions (m/z = 198) instead of CE·H+ in both cases (see the TOF spectra in the right panels of Fig. 5), and the UVPD spectra are recorded by monitoring the dBAM·H+ fragment in both cases. The PA value of dBAM is not known, but that of benzylamine is reported to be 913 kJ mol−1. Since we do not observe the 18C6·H+ fragment, the PA of dBAM should be larger than that of 18C6 (967 kJ mol−1). The UVPD spectra of dBAM·H+·18C6 and dBAM·H+·24C8 are compared to the UVPD spectrum of dBAM·H+ (Fig. 5a). The (0,0) band of dBAM·H+·18C6 is located at 37![[thin space (1/6-em)]](https://www.rsc.org/images/entities/char_2009.gif) 480 cm−1, 30 cm−1 blue-shifted from dBAM·H+ and the overall structure of the spectrum is very similar to that of dBAM·H+ except that higher vibronic bands are broadened. This situation is the same as that between aniline·H+ and aniline·H+·18C6. The UVPD spectrum of dBAM·H+·24C8 is much weaker and broader and its band origin is located at around 37
480 cm−1, 30 cm−1 blue-shifted from dBAM·H+ and the overall structure of the spectrum is very similar to that of dBAM·H+ except that higher vibronic bands are broadened. This situation is the same as that between aniline·H+ and aniline·H+·18C6. The UVPD spectrum of dBAM·H+·24C8 is much weaker and broader and its band origin is located at around 37![[thin space (1/6-em)]](https://www.rsc.org/images/entities/char_2009.gif) 590 cm−1. Thus, the difference in the complex structure between dBAM·H+·18C6 and dBAM·H+·24C8 is not reflected in the electronic transition origins, which are almost the same, but in the width of the vibronic structures. However, the main difference is observed in the UV photo-fragmentation yield. The right panels of Fig. 5b and c show the TOF spectra of dBAM·H+·18C6 and dBAM·H+·24C8 with and without the photodissociation laser, the UV frequency being fixed at the band origin of each complex. By comparing the two TOF spectra, the relative fragmentation yield giving dBAM·H+ from dBAM·H+·18C6 is much larger than that from dBAM·H+·24C8 under the same UV laser power conditions. Since the UV absorption cross-sections are similar between dBAM·H+·18C6 (a calculated oscillator strength of 1.4 × 10⁻³) and dBAM·H+·24C8 complexes (an oscillator strength 2 × 10⁻³), the small fragmentation yield in the latter case is assigned to a barrier for releasing dBAM·H+ from the 24C8 cavity in the dBAM·H+·24C8 pseudo-rotaxane.
590 cm−1. Thus, the difference in the complex structure between dBAM·H+·18C6 and dBAM·H+·24C8 is not reflected in the electronic transition origins, which are almost the same, but in the width of the vibronic structures. However, the main difference is observed in the UV photo-fragmentation yield. The right panels of Fig. 5b and c show the TOF spectra of dBAM·H+·18C6 and dBAM·H+·24C8 with and without the photodissociation laser, the UV frequency being fixed at the band origin of each complex. By comparing the two TOF spectra, the relative fragmentation yield giving dBAM·H+ from dBAM·H+·18C6 is much larger than that from dBAM·H+·24C8 under the same UV laser power conditions. Since the UV absorption cross-sections are similar between dBAM·H+·18C6 (a calculated oscillator strength of 1.4 × 10⁻³) and dBAM·H+·24C8 complexes (an oscillator strength 2 × 10⁻³), the small fragmentation yield in the latter case is assigned to a barrier for releasing dBAM·H+ from the 24C8 cavity in the dBAM·H+·24C8 pseudo-rotaxane.
It is very difficult to determine the structures of dBAM·H+·18C6 and dBAM·H+·24C8 from the electronic spectra. However, the number of possible isomers should be reduced because of the low temperature of the trap (30 K). Actually, as shown in Fig. 5b, the UVPD spectrum of dBAM·H+·18C6 shows a single sharp band origin. Thus, by assuming that the oscillator strengths of the conformers are not very different from each other, only one major conformer is observed under the present conditions. Fig. 6 shows typical ground state optimized structures of (a) dBAM·H+·18C6 and (b) dBAM·H+·24C8. For dBAM·H+·18C6, a twisted shape dBAM·H+ is attached above 18C6 and bound to two ether oxygen atoms via NH⋯O H-bonds. In the dBAM·H+·24C8 complex, on the other hand, dBAM·H+ goes through the 24C8 cavity forming pseudo-rotaxane. The calculated binding energy is 236 kJ mol−1 for dBAM·H+·18C6, and 264 kJ mol−1 for dBAM·H+·24C8 at the M05-2X/6-31+G* level using BSSE corrections. Thus, though the binding energy is not so different between dBAM·H+·18C6 and dBAM·H+·24C8, the low fragmentation yield of dBAM·H+·24C8 may come from a larger barrier for dBAM·H+ to be released from the 24C8 cavity.
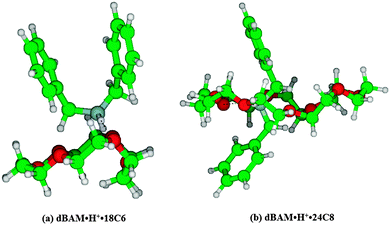 | ||
| Fig. 6 Optimized structures of (a) dBAM·H+·18C6 and (b) dBAM·H+·24C8 complexes at the M05-2X/6-31+G* level of calculation. | ||
4. dBAM·H+·DB24C8 pseudo-rotaxane
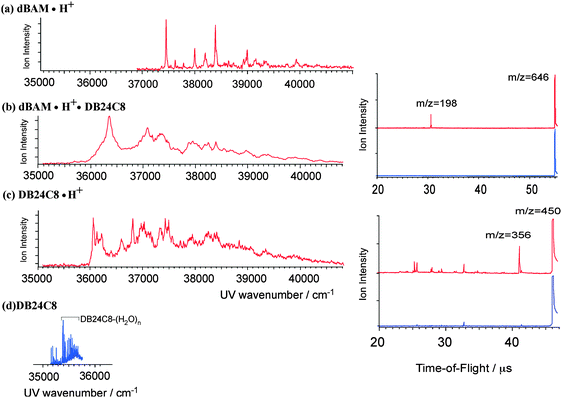
Fig. 7b shows the UVPD spectrum of dBAM·H+·DB24C8 pseudo-rotaxane recorded at 30 K. The spectrum is compared with that of dBAM·H+ (Fig. 7a), and DB24C8·H+ (Fig. 7c), respectively. The spectrum of dBAM·H+·DB24C8 shows broad structures with a band origin at ∼36![[thin space (1/6-em)]](https://www.rsc.org/images/entities/char_2009.gif) 350 cm−1. It is not clear whether the broadness is due to the overlap of the transitions of several coexisting isomers or to spectral congestion due to low vibrational modes. The first band is more than 1000 cm−1 red-shifted as compared to the (0,0) transition of dBAM·H+, and is rather close to the (0,0) band of DB24C8·H+ (36
350 cm−1. It is not clear whether the broadness is due to the overlap of the transitions of several coexisting isomers or to spectral congestion due to low vibrational modes. The first band is more than 1000 cm−1 red-shifted as compared to the (0,0) transition of dBAM·H+, and is rather close to the (0,0) band of DB24C8·H+ (36![[thin space (1/6-em)]](https://www.rsc.org/images/entities/char_2009.gif) 050 cm−1). This suggests that the electronic transition of dBAM·H+·DB24C8 in this region is not due to dBAM·H+ but to DB24C8 or DB24C8·H+. For comparison, Fig. 7d shows the laser induced fluorescence spectrum of the S1–S0 transition of jet-cooled neutral DB24C8 in the band origin region. For neutral DB24C8, two different conformers were identified at 35
050 cm−1). This suggests that the electronic transition of dBAM·H+·DB24C8 in this region is not due to dBAM·H+ but to DB24C8 or DB24C8·H+. For comparison, Fig. 7d shows the laser induced fluorescence spectrum of the S1–S0 transition of jet-cooled neutral DB24C8 in the band origin region. For neutral DB24C8, two different conformers were identified at 35![[thin space (1/6-em)]](https://www.rsc.org/images/entities/char_2009.gif) 195 and 35
195 and 35![[thin space (1/6-em)]](https://www.rsc.org/images/entities/char_2009.gif) 408 cm−1, which were assigned to the chair and boat forms, respectively.21 The S1–S0 electronic transition of DB24C8·H+ is roughly 800 cm−1 blue-shifted with respect to that of neutral DB24C8. Thus, the spectrum of dBAM·H+·DB24C8 in this region is assigned to excitation of the DB24C8·H+ chromophore. The intensity of the dBAM·H+ fragment at m/z = 198 from the dBAM·H+·DB24C8 photodissociation is 10–20 times larger than that from the dBAM·H+·24C8 photodissociation although these complexes have similar pseudo-rotaxane structures. The difference due to the larger absorption cross-section of the DB24C8·H+ chromophore as compared to the dBAMH+ absorption will be discussed later (Table 2).
408 cm−1, which were assigned to the chair and boat forms, respectively.21 The S1–S0 electronic transition of DB24C8·H+ is roughly 800 cm−1 blue-shifted with respect to that of neutral DB24C8. Thus, the spectrum of dBAM·H+·DB24C8 in this region is assigned to excitation of the DB24C8·H+ chromophore. The intensity of the dBAM·H+ fragment at m/z = 198 from the dBAM·H+·DB24C8 photodissociation is 10–20 times larger than that from the dBAM·H+·24C8 photodissociation although these complexes have similar pseudo-rotaxane structures. The difference due to the larger absorption cross-section of the DB24C8·H+ chromophore as compared to the dBAMH+ absorption will be discussed later (Table 2).
| dBAM·H+ (open) | DB24C8 | DB24C8·H+ | dBAM·H+·DB24C8 | |
|---|---|---|---|---|
| S1 | 5.58 (0.0) | 5.35 (6.4 × 10⁻²) | 5.42 (4.2 × 10⁻²) | 5.33 (4.7 × 10⁻²) |
| S2 | 5.59 (9.8 × 10⁻³) | 5.39 (5.0 × 10⁻²) | 5.55 (1.3 × 10⁻²) | 5.40 (4.9 × 10⁻²) |
We calculated possible initial structures of DB24C8·H+ and dBAM·H+·DB24C8 by MMF calculations further optimized by DFT calculations at the M05-2X/6-31+G* level. Fig. 8 shows the two most stable structures of DB24C8·H+. Other conformers are more than 2.6 kJ mol−1 higher in energy and their structures are shown in Fig. S3 (ESI†). In isomer 1, a proton is bound in a bifurcated manner to two ether oxygen atoms, one of which is adjacent to a benzene ring. Isomer 2 has a covalent O–H+ bond and the proton is H-bonded to an opposite ether oxygen. The DB24C8·H+ S1–S0 electronic transition is more than 800 cm−1 blue-shifted as compared to the neutral DB24C8 transition, which is compatible with the structure of isomer 1, because its electronic transition should be most affected by the proton binding to the oxygen atom adjacent to one benzene ring in this structure. Fig. 9 shows the most stable structure calculated for the dBAM·H+·DB24C8 complex. The next stable isomer is more than 5 kJ mol−1 higher in energy (see Fig. S4 in the ESI†). In the most stable structure, DB24C8 has a boat-structure and the benzene rings form quasi π–π stacking structure with one of the dBAM benzene rings. In addition, one NH bond of dBAM is H-bonded to an oxygen atom adjacent to a DB24C8 benzene ring. This situation is essentially the same as in the most stable structure (isomer 1) of DB24C8·H+.
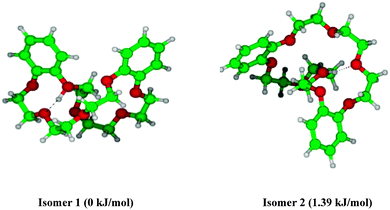 | ||
| Fig. 8 Two lowest energy isomers of DB24C8·H+ obtained at the M05-2X/6-31+G* level of calculation. Hydrogen-bonds are shown as dotted lines. | ||
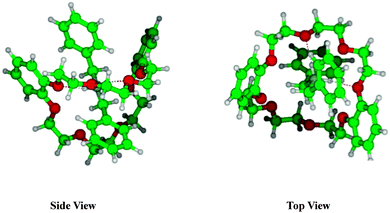 | ||
| Fig. 9 Most stable structure of dBAM·H+·DB24C8 pseudo-rotaxane obtained at the M05-2X/6-31+G* level of calculation. Hydrogen bonds between NH and oxygen atoms of CEs are shown as dotted lines. | ||
The vertical excitation energies and oscillator strengths for the most stable structures of dBAM·H+, neutral DB24C8, DB24C8·H+ and dBAM·H+·DB24C8 obtained at the M05-2X/6-31+G* level are compared in Table 2. When we compare the S1–S0 electronic transition energies of DB24C8, DB24C8·H+, and dBAM·H+, we see that those of DB24C8·H+ are located between those of DB24C8 and dBAM·H+, which is in good agreement with the observed relationship of the UVPD spectra shown in Fig. 7. In addition, the S1–S0 and S2–S0 oscillator strengths of DB24C8·H+ are ∼5 times larger than the dBAM·H+ oscillator strength, which also agrees with the observed larger photo-fragmentation yield of dBAM·H+·DB24C8 as compared to that of dBAM·H+·24C8.
Conclusions
In summary, we investigated the geometrical and electronic structures of the complex ions of protonated aniline (aniline·H+) and dibenzylamine (dBAM·H+) with crown ethers (CEs) of different cavity sizes, 15C5, 18C6, 24C8, and DB24C8. The aniline·H+ complexes with 15C5 and 18C6 have a structure in which the proton is located on the aniline part. After UV excitation, the complexes relax to the ground electronic state and the proton is transferred from the aniline part to the CE moiety producing the protonated CE fragments. The cage effect here completely removes the dissociation channels of the aniline·H+ moiety, which is different from what was observed for the tryptamine·H+·18C6 complex. In addition, the UV spectrum of aniline·H+·CEs is very sensitive to the symmetry of CEs; aniline·H+·18C6 shows a sharp electronic spectrum similar to aniline·H+, while that of aniline·H+·15C5 shows very broad structure with poor Franck–Condon factors.For the dBAM·H+ complexes with CEs, the proton is always located on dBAM. However, CEs have a role of a proton acceptor, leading to the blue-shift of electronic transition. Actually, in the case of DB24C8, the transition of the DB24C8 moiety of dBAM·H+·DB24C8 is ∼800 cm−1 blue-shifted compared to neutral DB24C8.
A large difference in the fragmentation yield between dBAM·H+·18C6 and dBAM·H+·24C8 was found due to a large barrier for releasing dBAM·H+ from the axis of rotaxane. Whereas in dBAM·H+·24C8 the excitation is on the dBAMH+ moiety, in dBAM·H+·DB24C8 the initial excitation is on the DB24C8H+ part and the fragmentation yield is larger in the latter case due to a larger oscillator strength. For further details on the structure of the complexes including the position of the proton, the IR spectrum in the NH and OH region should be recorded, which will be the future work.
Acknowledgements
This study was supported in part by the France-Japan Collaboration Program (SAKURA), the Japan Society for Promotion of Science and the ANR Research Grant (ESPEM-ANR2010BLANC040501). We acknowledge the use of the computing facility cluster GMPCS of the LUMAT federation (FR LUMAT 2764).References
- C. J. Pedersen, J. Am. Chem. Soc., 1967, 89, 7017–7036 CrossRef CAS.
- C. J. Pedersen, Science, 1988, 241, 536–540 CAS.
- A. M. Stuart and J. A. Vidal, J. Org. Chem., 2007, 72, 3735–3740 CrossRef CAS PubMed.
- N. Jose, S. Sengupta and J. K. Basu, J. Mol. Catal. A: Chem., 2009, 309, 153–158 CrossRef CAS PubMed.
- J. Malval, I. Gosse, J. Morand and R. Lapouyade, J. Am. Chem. Soc., 2002, 124, 904–905 CrossRef CAS PubMed.
- R. M. Uda, T. Matsui, M. Oue and K. Kimura, J. Inclusion Phenom. Macrocyclic Chem., 2005, 51, 111–114 CrossRef CAS.
- I. F. Uchegbu and S. P. Vyas, Int. J. Pharm., 1998, 172, 33–70 CrossRef CAS.
- L. Tavano, R. Muzzalupo, S. Trombino, I. Nicotera, C. O. Rossi and C. L. Mesa, Colloids Surf., B, 2008, 61, 30–38 CrossRef CAS PubMed.
- R. M. Izatt, J. H. Rytting, D. P. Nelson, B. L. Hayamore and J. J. Christensen, Science, 1969, 164, 443–444 CAS.
- R. M. Izatt, D. P. Nelson, J. H. Rytting and J. J. Christensen, J. Am. Chem. Soc., 1971, 93, 1619–1623 CrossRef CAS.
- C. J. Pedersen and H. K. Frensdorff, Angew. Chem., Int. Ed., 1972, 11, 16–25 CrossRef CAS PubMed.
- R. M. Izatt, R. E. Terry, B. L. Haymore, L. D. Hansen, N. K. Dalley, A. G. Avondet and J. J. Christensen, J. Am. Chem. Soc., 1976, 98, 7620–7626 CrossRef CAS.
- R. M. Izatt, R. E. Terry, D. P. Nelson, Y. Chan, D. J. Eatough, J. S. Bradshaw, L. D. Hansen and J. J. Christensen, J. Am. Chem. Soc., 1976, 98, 7626–7630 CrossRef CAS.
- J. D. Lamb, R. M. Izatt, C. S. Swain and J. J. Christensen, J. Am. Chem. Soc., 1980, 102, 475–479 CrossRef CAS.
- S. Maleknia and J. Brodbelt, J. Am. Chem. Soc., 1992, 114, 4295–4298 CrossRef CAS.
- M. B. More, D. Ray and P. B. Armentrout, J. Am. Chem. Soc., 1999, 121, 417–423 CrossRef CAS.
- J. D. Anderson, E. S. Paulsen and D. V. Dearden, Int. J. Mass Spectrom., 2003, 227, 63–76 CrossRef CAS.
- R. Kusaka, Y. Inokuchi and T. Ebata, Phys. Chem. Chem. Phys., 2007, 9, 4452–4459 RSC.
- R. Kusaka, Y. Inokuchi and T. Ebata, Phys. Chem. Chem. Phys., 2008, 10, 6238–6244 RSC.
- R. Kusaka, Y. Inokuchi and T. Ebata, Phys. Chem. Chem. Phys., 2009, 11, 9132–9140 RSC.
- S. Kokubu, R. Kusaka, Y. Inokuchi, T. Haino and T. Ebata, Phys. Chem. Chem. Phys., 2010, 12, 3559–3565 RSC.
- R. Kusaka, Y. Inokuchi, S. S. Xantheas and T. Ebata, Sensors, 2010, 10, 3519–3548 CrossRef CAS PubMed.
- R. Kusaka, S. Kokubu, Y. Inokuchi, T. Haino and T. Ebata, Phys. Chem. Chem. Phys., 2011, 13, 6827–6836 RSC.
- R. Kusaka, Y. Inokuchi, T. Haino and T. Ebata, J. Phys. Chem. Lett., 2012, 3, 1414–1420 CrossRef CAS.
- Y. Inokuchi, O. V. Boyarkin, R. Kusaka, T. Haino, T. Ebata and T. R. Rizzo, J. Am. Chem. Soc., 2011, 133, 12256–12263 CrossRef CAS PubMed.
- Y. Inokuchi, O. V. Boyarkin, R. Kusaka, T. Haino, T. Ebata and T. R. Rizzo, J. Phys. Chem. A, 2012, 116, 4057–4068 CrossRef CAS PubMed.
- Y. Inokuchi, T. Ebata, T. R. Rizzo and O. V. Boyarkin, J. Am. Chem. Soc., 2014, 136, 1815–1824 CrossRef CAS PubMed.
- G. Féraud, M. Broquier, C. Dedonder-Lardeux, G. Grégoire, S. Soorkia and C. Jouvet, Phys. Chem. Chem. Phys., 2014, 16, 5250–5259 RSC.
- J.-P. Desvergne and H. Bouas-Laurent, J. Chem. Soc., Chem. Commun., 1978, 403–404 RSC.
- I. Yamashita, M. Fujii, T. Kaneda, S. Misumi and T. Otsubo, Tetrahedron Lett., 1980, 21, 541–544 CrossRef CAS.
- H. Bouas-Laurent, A. Castellan and J.-P. Desvergne, Pure Appl. Chem., 1980, 52, 2633–2648 CrossRef CAS.
- S. Shinkai, T. Nakaji, Y. Nishida, T. Ogawa and O. Manabe, J. Am. Chem. Soc., 1980, 102, 5860–5865 CrossRef CAS.
- V. Serreli, C.-F. Lee, E. R. Kay and D. A. Leigh, Nature, 2007, 445, 523–527 CrossRef CAS PubMed.
- P. L. Anelli, N. Spencer and J. F. Stoddart, J. Am. Chem. Soc., 1991, 113, 5131–5133 CrossRef CAS.
- R. A. Bissell, E. Córdova, A. E. Kaifer and J. F. Stoddart, Nature, 1994, 369, 133–137 CrossRef CAS PubMed.
- C. A. Schalley, K. Beizai and F. Vögtle, Chem. Res., 2001, 34, 465–476 CrossRef CAS PubMed.
- I. Alata, J. Bert, M. Broquier, C. Dedonder, G. Feraud, G. Gregoire, S. Soorkia, E. Marceca and C. Jouvet, J. Phys. Chem. A, 2013, 117, 4420–4427 CrossRef CAS PubMed.
- G. Féraud, C. Dedonder, C. Jouvet, Y. Inokuchi, T. Haino, R. Sekiya and T. Ebata, J. Phys. Chem. Lett., 2014, 5, 1236–1240 CrossRef.
- X. B. Wang and L. S. Wang, Rev. Sci. Instrum., 2008, 79, 073108 CrossRef PubMed.
- C. M. Choi, D. H. Choi, N. J. Kim and J. Heo, Int. J. Mass Spectrom., 2012, 314, 18–21 CrossRef CAS PubMed.
- J. U. Andersen, P. Hvelplund, S. B. Nielsen, S. Tomita, H. Wahlgreen, S. P. Møller, U. V. Pedersen, J. S. Forster and T. J. D. Jørgensen, Rev. Sci. Instrum., 2002, 73, 1284–1287 CrossRef CAS PubMed.
- M. J. S. Dewar, E. G. Zoebisch, E. F. Healy and J. J. P. Stewart, J. Am. Chem. Soc., 1985, 107, 3902–3909 CrossRef CAS.
- F. Mohamadi, N. G. J. Richard, W. C. Guida, R. Liskamp, M. Lipton, C. Caufield, G. Chang, T. Hendrickson and W. C. Still, J. Comput. Chem., 1990, 11, 440–467 CrossRef CAS PubMed.
- T. A. Halgren, J. Comput. Chem., 1999, 20, 720–729 CrossRef CAS.
- E. Polak and G. Ribiere, Rev. Fr. Inf. Rech. Oper., 1969, 16, 241–254 Search PubMed.
- M. J. Frisch, G. W. Trucks, H. B. Schlegel, G. E. Scuseria, M. A. Robb, J. R. Cheeseman, G. Scalmani, V. Barone, B. Mennuchi and G. Petersson, et al., Gaussian 09, Revision A.1, Gaussian, Inc., Wallingford, CT 2009 Search PubMed.
- P. R. Ashton, E. J. T. Chrystal, P. T. Glink, S. Menzer, C. Schiavo, N. Spencer, J. F. Stoddart, P. A. Tasker, A. J. P. White and D. J. Williams, Chem. – Eur. J., 1996, 2, 709–728 CrossRef CAS PubMed.
- N. Mikami, A. Hiraya, I. Fujiwara and M. Ito, Chem. Phys. Lett., 1980, 74, 531–535 CrossRef CAS.
- S. Ishikawa, T. Ebata, H. Ishikawa, T. Inoue and N. Mikami, J. Phys. Chem., 1996, 100, 10531–10535 CrossRef CAS.
- The notation for the vibrational modes is adapted from G. Varsanyi, Assignments for Vibrational Spectra of Seven Hundreds Benzene Derivatives, Adam Hilger, London, 1974 Search PubMed.
- NIST Chemistry Webbook, NIST Standard Reference Database Number 69, http://webbbok.nist.gov./chemistry/.
- F. M. Pasker, N. Solca and O. Dopfer, J. Phys. Chem. A, 2006, 110, 12793–12804 CrossRef CAS PubMed.
- H. Kang, C. Jouvet, C. Dedonder-Lardeux, S. Martrenchard, C. Charriere, G. Gregoire, C. Desfrancois, J.-P. P. Schermann, M. Barat, J. A. Fayeton, G. Grégoire and C. Desfrançois, J. Chem. Phys., 2005, 122, 084307 CrossRef CAS PubMed.
- U. Kadhane, M. Pérot, B. Lucas, M. Barat, J. A. Fayeton, C. Jouvet, A. Ehlerding, M.-B. S. Kirketerp, S. B. Nielsen, J. A. Wyer and H. Zettergren, Chem. Phys. Lett., 2009, 480, 57–61 CrossRef CAS PubMed.
Footnote |
| † Electronic supplementary information (ESI) available. See DOI: 10.1039/c5cp01960e |
| This journal is © the Owner Societies 2015 |

