 Open Access Article
Creative Commons Attribution 3.0 Unported Licence
Constant capacitance in nanopores of carbon monoliths†
Alejandra
García-Gómez
a,
Gelines
Moreno-Fernández
a,
Belén
Lobato
b and
Teresa A.
Centeno
*b
aInstituto de Ciencia de Materiales de Madrid, ICMM-CSIC. Sor Juana Ines de la Cruz, 3, Cantoblanco, 28049 Madrid, Spain
bInstituto Nacional del Carbón, INCAR-CSIC, Apartado 73, 33080 Oviedo, Spain. E-mail: teresa@incar.csic.es; Fax: +34 985 297662; Tel: +34 985 119 090
First published on 21st May 2015
Abstract
The results obtained for binder-free electrodes made of carbon monoliths with narrow micropore size distributions confirm that the specific capacitance in the electrolyte (C2H5)4NBF4/acetonitrile does not depend significantly on the micropore size and support the foregoing constant result of 0.094 ± 0.011 F m−2.
The reliable assessment of surface areas in nanoporous carbons is of great relevance to gain clear insights into their performance in supercapacitors. It was shown recently that there are important differences between the surface area estimated by the standard BET model and practically all other methods.1 Basically, SBET underestimates the real surface area of carbons with a high proportion of micropores below 0.8 nm and gradually overestimates it in micropores above 1.1 nm. Only in the micropore range of 0.8–1.1 nm, SBET coincides with the values from the other determinations.1,2
In this context, it was illustrated that the anomalous increase3 in the surface-capacitance (C/S in F m−2) claimed for carbide-derived carbons (CDCs) with pores smaller than 1 nm derives from the unreliable assessment of their area by the classical BET equation.2,4 The original sampling used by Chmiola et al.3 was limited to 5 CDCs for the region below 1.1 nm and for wider pores they considered data quoted in the literature. Stoeckli et al.4 re-examined this issue by considering: (a) a larger variety of carbons and (b) the reliable determination of the total surface area available to the electrolyte ions by using simultaneously several independent methods. Such extended study showed that there is a linear correlation between the gravimetric capacitance [in F g−1] and the surface involved in the electrochemical double-layer formation [in m2 g−1]. Therefore, the contribution from the carbon surface to the capacitance in the (C2H5)4NBF4/acetonitrile electrolyte (Et4NBF4/AN) is practically constant around 0.094 ± 0.011 F m−2 in the range of 0.66 to 1.6 nm and shows a similar pattern even up to 15 nm.4 Additionally, following corrections for pseudocapacitance effects, it resulted that C/S is also independent of the micropore width in the aqueous H2SO4 and KOH electrolytes.5
The reliability of the constant experimental values of C/S within the experimental uncertainty was confirmed by further studies from different approaches by Stoeckli et al.2,6,7 Additionally, evidences supporting the constant pattern were also provided by other authors. The study of Feng et al.,8 based on the surface area of carbons beads estimated by the Density Functional Theory (DFT) and in disagreement with SBET, led to values in Et4NBF4/PC of 0.087, 0.099 and 0.097 F m−2 at pore widths below 1 nm, between 1 and 2 nm, and above 2 nm, respectively. Relatively constant C/S in pores larger than 0.8 nm was also obtained from modeling based on DFT and taking into account the solvent.9,10
This paper presents a new and straightforward demonstration as a response to the criticisms addressed to the constant capacitance, namely that11–14
• The presence of binder in the electrode could push the increase in C/S further down.
• The pore size distribution of carbons may hide an underlying variation of the surface-capacitance with the pore size.
The fact that the results of C/SBETvs. micropore size obtained by Chmiola et al. and Stoeckli et al. are very similar already weakens these points but the controversy over this issue still remains.
It has been shown that monolithic electrodes report direct correlations between porous features of carbons and their supercapacitor performance.15,16 The present study of binder-free electrodes made of carbon monoliths with a very narrow micropore size distribution provides further experimental evidences on the constant surface-capacitance in the organic electrolyte Et4NBF4/AN.
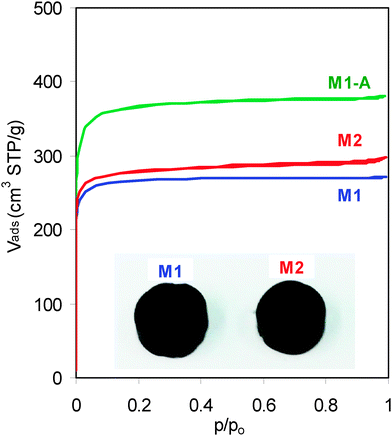
Two carbon monoliths, here-after called M1 and M2, were obtained as slices of multichannel carbon bars. They consist of carbon walls and square channels both arranged along the cylinder axis (Fig. 1, inset). A detailed description of the carbon walls was reported elsewhere.16 Carbon monolith M1-A resulted from the activation of M1 in flowing CO2.
 | ||
| Fig. 1 N2 adsorption–desorption isotherms of the carbon monoliths (inset, pictures of the carbon monoliths M1 and M2). | ||
As summarized in Table 1, the three monoliths achieve similar gravimetric capacitance, being 91 and 93 F g−1 for M1 and M1-A and 86 F g−1 for M2.
| Carbon monolith | Porosity characteristics | Gravimetric capacitance | Surface-capacitance | ||||||||
|---|---|---|---|---|---|---|---|---|---|---|---|
| L 0 (nm) | S DR (m2 g−1) | S comp (m2 g−1) | S phenol (m2 g−1) | S BET (m2 g−1) | S total (m2 g−1) | S >0.63 (m2 g−1) | C (F g−1) | C/SBET (F m−2) | C/Stotal (F m−2) | C/S>0.63 (F m−2) | |
| M1 | 0.73 | 1152 | 1107 | 1000 | 619 | 1086 | 878 | 91 | 0.147 | 0.084 | 0.104 |
| M2 | 0.69 | 1278 | 1276 | 1286 | 599 | 1280 | 933 | 86 | 0.144 | 0.067 | 0.092 |
| M1-A | 1.01 | 1151 | 1114 | 1193 | 1154 | 1153 | 898 | 93 | 0.081 | 0.081 | 0.104 |
The type-I isotherms obtained for the three carbon monoliths (Fig. 1) reveal that their porosity consists exclusively of micropores (width <2 nm) with a negligible contribution of meso-macropores (Fig. S1, ESI†).
The analysis of the isotherm of M1 by the Dubinin–Radushkevich (DR) equation reports that it has a volume of micropores of 0.42 cm3 g−1 corresponding to pores with an average size (L0) of 0.73 nm. These values lead to a microporous surface area of 1151 m2 g−1. Additionally, the comparison with the isotherm obtained for the non-porous carbon Vulcan 3G confirmed that the contribution of pores larger than 2 nm is not significant and the external surface (non-microporous) is only 1 m2 g−1. Therefore, the total area of M1 is the sum of both values, SDR = 1152 m2 g−1 (Table 1).
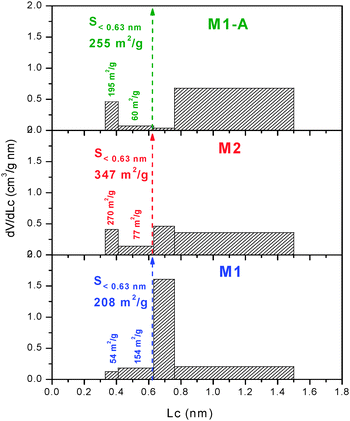
Immersion calorimetry of M1 into liquids with molecular dimensions between 0.33 and 1.5 nm leads to the effective micropore size distribution (PSD),17 as opposed to the adsorption which provides the absolute distribution by using the small N2 molecule as probe. Fig. 2 shows an extremely narrow PSD in M1, with the majority of the pores in the range 0.63–0.76 nm, suiting the size of the cation Et4N+.3 The good agreement observed between the adsorption and immersion experiments indicates the absence of “molecular sieves” effects or “bottle-neck” at the entrance of the micropores.17
The DR analysis conducted on the isotherm of M2 reveals comparable characteristics to those of M1 with a micropore volume of 0.44 cm3 g−1, an average micropore size of 0.69 nm, a microporous surface of 1275 m2 g−1, an external surface of 3 m2 g−1 and a total surface area of 1278 m2 g−1 (Table 1). In spite of the similar average micropore width of M1 and M2, the latter displays a more heterogeneous PSD with significant presence of micropores in all ranges (Fig. 2).
It appears that the activation process does not modify the porous structure above 2 nm but it increases the micropore volume and the average micropore size is enlarged to 1.01 nm. The PSD obtained for M1-A confirms the enlargement of the pores, the surface area being mostly in pores with sizes between 0.76 and 1.5 nm (Fig. 2). The SDR of the activated monolith accounts for 1151 m2 g−1 (Table 1).
In order to get a more reliable determination of the specific surface area of the carbon monoliths, the N2 isotherms were also analyzed by other methods such as the comparison plot (Scomp) and the BET equation (SBET). These data were further cross-checked with the corresponding enthalpy of immersion of the carbon monoliths into dilute aqueous solution of phenol (Sphenol).1,2Table 1 summarizes the specific surface areas derived from the different approaches.
The good agreement between SDR, Scomp, Sphenol and SBET for M1-A (Table 1) confirms that the BET method provides reliable results for materials with pores around 0.9–1.0 nm.1 On the contrary, there is a noticeable difference (around 50%) between the value obtained by the BET equation and the other determinations in the case of M1 and M2 (Table 1). As reported previously,1SBET underestimates the total surface area of carbons with a high proportion of pores below 0.8–0.9 nm, which is precisely the case of M1 and M2. Based on the convergence of values, the total surface area of the carbon monoliths was derived from the average between the areas obtained from the three independent methods Stotal = (SDR + Scomp + Sphenol)/3.
In a first step, Stotal appears to be more reliable than SBET, with the corresponding consequences on surface-capacitance C/S values summarized in Table 1. Thus, C/SBET and C/Stotal are similar in M1-A but C/Stotal is clearly much lower than C/SBET in the two monoliths with micropores below 1 nm.
Secondly, it must be emphasized that Stotal corresponds to the area accessible to small molecules such as nitrogen and phenol which probe the surface area of pores down to ∼0.4 nm. In the case of the present carbons with a significant fraction of their porosity below 0.7 nm (Fig. 1a), the surface area accessible to the desolvated cation (the largest dimension being 0.68 nm3) would be much reduced.4,18 The extent of the surface involved in the energy storage is limited by that accessible to Et4N+ as the anion BF4− has a smaller size.19
For the three monoliths, the combination of N2 adsorption and the enthalpies of immersion into CH2Cl2, C6H6 and CCl4 allows estimating the surface area of the micropores in the ranges 0.33–0.41 and 0.41–0.63 nm (S<0.63).17,20 It follows that the surface close to that accessible to Et4N+ corresponds to S>0.63 = Stotal − S<0.63. Table 1 shows that S>0.63 for the present monoliths is around 75% of their Stotal.
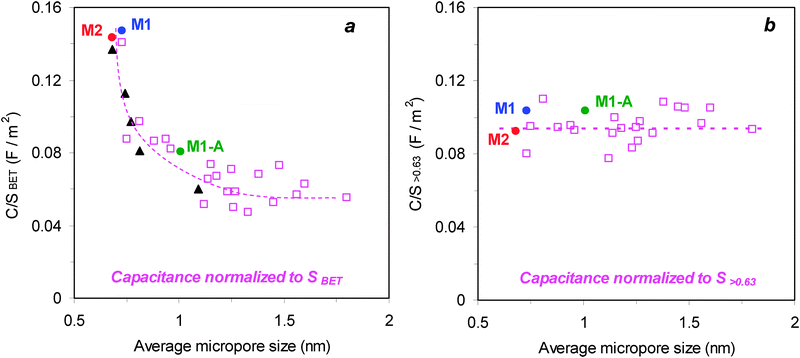
As implied by the data of Table 1, the determination of the surface-capacitance leads to strongly diverging results, depending on the choice of the surface area. Fig. 3 clearly illustrates the difference in the C/S vs. micropore size based on SBET or on the surface accessible to the electrolyte. Fig. 3a shows the trend for C/SBET and it includes data for the present monoliths, a variety of 21 porous carbons tested by Stoeckli et al.4 ( ) and the 5 carbide-based carbons (▲) which led to the hypothesis of an anomalous increase in pores below 1 nm.3 It is observed that carbon monoliths with pore widths around 0.7 nm achieve outstanding capacitances of 0.147 and 0.144 F m−2, even surpassing the highest value obtained for CDCs,3 whereas C/SBET decreases to 0.081 F m−2 for the activated monolith with a porosity around 1 nm. Fig. 3a illustrates that these data fit into the general profile, an enhancement below 1 nm and a drop above 1.3 nm, reported earlier on the basis of the unreliable BET-surface area by Chmiola et al.3 and Stoeckli et al.4
On the contrary, the values referred to the more reliable S>0.63 drop to 0.104 and 0.092 F m−2 for M1 and M2, respectively (Table 1) in accordance with 0.104 F m−2 for M1-A. As shown in Fig. 3b, these refined data based on the real surface involved in the electrochemical double-layer formation follow the regular pattern found by Stoeckli et al. with a contribution in Et4NBF4/AN of (0.094 ± 0.011) F m−2 between 0.7 and 15 nm.2
The present results obtained for binder-free electrodes made of carbon monoliths with narrow micropore size distributions provide a strong evidence that the specific capacitance C/S in F m−2 does not depend significantly on the micropore size and support the foregoing constant result. The gravimetric capacitance of carbons depends mainly on the surface available to the cation of the organic electrolyte.
The need for a reliable characterization of carbons in SC is often overlooked, but of fundamental importance to assess competing claims.
Experimental
Carbon monoliths M1 and M2 were obtained from multichannel carbon bars 650 CPI and 1200 CPI, respectively. They were manufactured by MAST Carbon International Ltd from extrusion of a phenolic resin and subsequent carbonization and activation and display 650 and 1200 channels per square inch, respectively. Carbon monolith M1-A was obtained by heating M1 in flowing CO2 at 800 °C for 6 hours, up to a weight loss of 7%.The porosity of the carbon monoliths was characterized by N2 adsorption at 77 K (Micromeritics ASAP 2010) and by immersion calorimetry at 293 K. The N2 isotherm was analyzed by the Dubinin's theory, the Kaneko's comparison plot and the BET equation. The total surface area was also determined from the enthalpy of immersion of the carbon monoliths into 0.4 M aqueous solution of phenol (Sphenol).2,17
The assessment of the micropore accessibility was obtained from the enthalpies of immersion into liquids having different critical molecular sizes such as dichloromethane (0.33 nm), benzene (0.41 nm), carbon tetrachloride (0.63 nm), cyclododeca-1,5,9-triene (0.76 nm), and tri-2,4-xylylphosphate (1.50 nm).17
The electrochemical study was carried out in two-electrode Swagelok™-type cells at room temperature. The carbon monoliths acting as electrodes were separated by a glassy fibrous paper (Whatman 934 AH) and immersed in 1 M solution of (C2H5)4NBF4 in acetonitrile. Two tantalum rods were used as current collectors. The gravimetric capacitance was determined from galvanostatic measurements between 0 and 2 V (Autolab potentiostat/galvanostat-302 N) at a current density of 1 mA cm−2, i.e. in nearly steady state to prevent any kinetic effect on the capacitance measurement.
The specific capacitance was determined from the discharge run by using C = 2·I·td/E·m, where I is the current applied, td is the time spent along the discharge, and m is the mass of one electrode.
Acknowledgements
We thank Dr Jose M. Rojo (ICMM-CSIC) for his useful assistance. Financial support from Spanish MICINN (project MAT 2011-25198) is gratefully acknowledged. G. Moreno-Fernandez thanks Spanish MINECO for a FPI fellowship.Notes and references
- T. A. Centeno and F. Stoeckli, Carbon, 2010, 48, 2478 CrossRef CAS PubMed.
- F. Stoeckli and T. A. Centeno, J. Mater. Chem. A, 2013, 1, 6865 CAS.
- J. Chmiola, G. Yushin, Y. Gogotsi, C. Portet, P. Simon and P. L. Taberna, Science, 2006, 313, 1760 CrossRef CAS PubMed.
- T. A. Centeno, O. Sereda and F. Stoeckli, Phys. Chem. Chem. Phys., 2011, 13, 12403 RSC.
- T. A. Centeno and F. Stoeckli, Electrochim. Acta, 2011, 56, 7334 CrossRef CAS PubMed.
- F. Stoeckli and T. A. Centeno, Phys. Chem. Chem. Phys., 2012, 14, 11589 RSC.
- T. A. Centeno and F. Stoeckli, Electrochem. Commun., 2012, 16, 34 CrossRef CAS PubMed.
- Z. Feng, R. Xue and X. Shao, Electrochim. Acta, 2010, 55, 7334 CrossRef CAS PubMed.
- D. Jiang, Z. Jin, D. Henderson and J. Wu, J. Phys. Chem. Lett., 2012, 3, 1727 CrossRef CAS.
- D. Jiang and J. Wu, Nanoscale, 2014, 6, 5545 RSC.
- G. Feng and P. T. Cummings, J. Phys. Chem. Lett., 2011, 2, 2859 CrossRef CAS.
- S. Kondrat, C. S. Pérez, V. Presser, Y. Gogotsi and A. A. Kornyshev, Energy Environ. Sci., 2012, 5, 6474 CAS.
- W. Gu and G. Yushin, Wiley Interdiscip. Rev.: Energy Environ., 2014, 3, 424 CrossRef CAS PubMed.
- T. Ohba and K. Kaneko, J. Phys. Chem. C, 2013, 117, 17092 CAS.
- G. Hasegawa, K. Kanamori, K. Nakanishi and T. Abe, J. Phys. Chem. C, 2012, 116, 26197 CAS.
- A. Garcia-Gomez, V. Barranco, G. Moreno-Fernandez, J. Ibáñez, T. A. Centeno and J. M. Rojo, J. Phys. Chem. C, 2014, 118, 5134 CAS.
- F. Stoeckli, in Porosity in carbons. Characterization and applications, ed. J. Patrick, Arnold, London, 1995, pp. 67–92 Search PubMed.
- T. A. Centeno, J. A. Fernández and F. Stoeckli, Carbon, 2008, 46, 1025 CrossRef CAS PubMed.
- J. Huang, B. G. Sumpter and V. Meunier, Chem. – Eur. J., 2008, 14, 6614 CrossRef CAS PubMed.
- T. A. Centeno and F. Stoeckli, Carbon, 1997, 35, 1097 CrossRef.
Footnote |
| † Electronic supplementary information (ESI) available. See DOI: 10.1039/c5cp01904d |
| This journal is © the Owner Societies 2015 |


