 Open Access Article
Creative Commons Attribution 3.0 Unported Licence
Targets, ripples and spirals in a precipitation system with anomalous dispersion†
Mahmoud M.
Ayass
a,
Istvan
Lagzi
b and
Mazen
Al-Ghoul
*a
aDepartment of Chemistry, American University of Beirut, P.O. Box 11-0236, Riad El-Solh 1107 2020, Beirut, Lebanon. E-mail: mazen.ghoul@aub.edu.lb; Fax: +961-1-365217; Tel: +961-1-350000 ext. 3970
bDepartment of Physics, Budapest University of Technology and Economics, Budapest H-1521, Hungary
First published on 23rd June 2015
Abstract
We present a novel reaction–diffusion system that exhibits three-dimensional superdiffusive traveling waves without utilizing any external forces. These waves include single circular targets, spirals, and ripples as well as phase-like waves. The system is based on the interplay of the precipitation reaction of mercuric iodide in a gel medium, its polymorphic transformation to a different crystalline form, and its redissolution in excess iodide. A phase diagram is constructed as a function of the initial concentrations of the reagents. The spatiotemporal evolution of these waves is thoroughly analyzed and seems to be a consequence of an anomalous dispersion relationship. Pattern selection and wavelengths of propagating waves are found to depend on initial concentrations of the reactants. The breakup of the waves is also investigated. While the breakdown of ripples and spirals is shown to be a consequence of a Doppler-like instability in conjunction with anomalous dispersion, the targets undergo a boundary defect-mediated breakup.
1. Introduction
Self-organized patterns in reaction–diffusion (RD) systems have been the subject of a tremendous amount of investigations by researchers in chemistry,1,2 physics3,4 and biology5,6 due to their high relevance in these fields. For chemical systems in particular, self-organization includes precipitation patterns in gel media,7–9 self-oscillating reactions in the homogeneous liquid phase,10 traveling waves11 and Turing patterns.12,13 Common ingredients in these examples are oscillatory reactions or excitable media. The Belousov–Zhabotinsky (BZ) system,11 reported in Nature in the year 1970, is the classical and most studied example that has provided the foundation for many recent self-oscillating systems that produce self-organizing patterns in homogeneous RD systems. Furthermore, heterogeneous auto-catalytic chemical reactions exhibiting various patterns have also been encountered in RD systems and have also been intensively studied.14 One prominent reaction of this type is the catalytic oxidation of CO on platinum crystal planes.15In both, homogeneous and heterogeneous RD systems, the formation of many interesting patterns is the result of travelling waves which could take the shape of a spiral or a circular target pattern.16 The rotation of these spirals on a surface causes deformations in the medium of reaction. These deformations may further lead to the breakup of the spiral wave giving rise to complex spatiotemporal patterns4 and chemical turbulence. All of the aforementioned systems produce, under no advection, propagating fronts with constant velocities,17,18 or velocities in conformity with normal diffusive profile leading to a linear relation between the mean square spread of particles with time. Although recent experiments have confirmed the occurrence of superdiffusive chemical waves, such anomalous behavior is exhibited when the system is subjected to external modulations that enhance diffusion.21–25 Recently, the authors reported the propagation and interaction of three-dimensional superdiffusive target patterns in the absence of external forces in a novel heterogeneous system, namely the mercuric iodide precipitation system.19 In this sequel work, we present a full study of the aforementioned mercuric iodide system. A multitude of wave patterns, including targets (single circular wave), spirals, ripples as well as phase-like waves, are obtained. The propagation dynamics of all these waves is also shown to be superdiffusive and their breakup leads to defect-mediated chemical turbulence. Many of the observed phenomena can be shown to be a result of anomalous dispersion relations, whereby the velocity of the pulse c(T) increases by decreasing period T (i.e. dc/dT < 0), with striking similarities to those found in a special class of the BZ reaction.20,21
This paper is organized as follows. In Section 2, we describe the experimental procedure and setup. In Section 3, we report and discuss our results, which include the detailed chemistry (Section 3.1), the phase diagram of the various patterns observed and their dynamics in addition to their dispersion relations (Section 3.2), and the last part includes the discussion of the wave breakup mechanisms (Section 3.3).
2. Experimental
The materials used in our experiments constitute of mercuric chloride (Fischer Chemical), potassium iodide (Merck) and agar gel (Bacto). We carried out all the experiments in gel media. We prepared stock solutions, using double distilled water, of both mercuric chloride (HgCl2) and potassium iodide (KI) according to the required concentrations. We dissolved the agar powder (1% volume) in a volume of HgCl2 solution (inner electrolyte) by using a magnetic stirring rod on a stirring/hot plate. We maintained the temperature of the mixture within a range of 80–90 °C. To ensure that no errors in the concentration occur we covered the beakers while stirring and made sure that the solutions never reach the boiling point. The solutions continue to mix until they become clear and no gel particles remain floating. When the solution mixtures were complete, we poured them into small Petri dishes (47.0 mm diameter). About 10 mL of each solution is transferred to each Petri dish, which forms a gel of about 7 mm in thickness. We then covered the plates and placed them in a chamber equipped with a thermostat that maintains the temperature at 20 ± 0.2 °C. The gels were left for 2 hours for the completion of their gelation and aging processes.Next, we proceeded with the performance of the reaction by pouring the previously prepared KI solutions (outer electrolyte) onto the surface of the solidified gel (initialization step). The temperature of the medium was kept at 20 °C during the reaction. We monitored the reactions under a high-resolution digital camera (Cannon EOS 450D) connected to an iMac. The mode that we used for our analysis took a clear focused shot of the plates and the software was set to take a snapshot every 5 seconds. The reactions proceeded for around 15–30 minutes each; therefore with our settings we produced around 200–400 snapshots of the reactions. Combining these frames shows us a clear time evolution of the traveling waves in our system.
3. Results and discussion
3.1 Detailed chemistry
The observations we report include the coexistence of moving precipitation patterns (as in the Liesegang phenomenon) with traveling waves (as in excitable media), perpendicular to the diffusion flux vector of the invading electrolyte inside the precipitate. In our system, HgCl2 (inner electrolyte) is evenly distributed in the agar gel, and then the KI (outer electrolyte) is poured on to the gel surface, which diffuses into the gel forming HgI2 precipitates. Specifically, the formation of HgI2 in gel media22 in the wake of a diffusion front results in three different polymorphs: orange (tetragonal), β-yellow-HgI2 (orthorhombic) and α-red-HgI2 (tetragonal).23 The orange and yellow forms are the kinetically favored polymorphs, thus appearing at early stages of diffusion, but they are not thermodynamically stable. With the slightest touch these polymorphs would readily transform, by alteration of the crystal structure, to the more stable and thermodynamically favored the red form of the compound.24,25 Furthermore, in the presence of excess potassium iodide solution (outer electrolyte), both α- and β-HgI2 precipitates rapidly dissolve forming the K2HgI4 complex.26 The aforementioned precipitation process, polymorphic transformation and the complex formation are summarized according to the following reaction scheme:| Hg2+(aq) + 2I−(aq) ⇌ β-HgI2(s) | (1) |
| β-HgI2(s) → α-HgI2(s) | (2) |
| α-HgI2(s) + 2I−(aq) ⇌ [HgI4]2−(aq) | (3) |
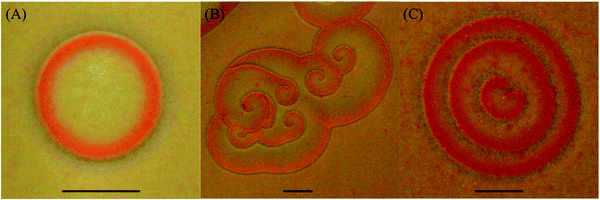
Since the only contact between the two electrolytes is the surface of the gel, a thin layer of the precipitates (∼70–150 μm) forms at the interface immediately after contact between the inner and outer electrolytes. As diffusion continues, the excess outer electrolyte following the front reacts with the precipitate to form the complex K2HgI4 (redissolution) and the whole layer appears like a front propagating downward. On the other hand, while monitoring the surface of the precipitate layer from a top view parallel to the surface of the gel, we observe distinct self-organized patterns forming inside the whole width of the thin precipitation disk. Fig. 1 represents the three different self-organized patterns we observe in our system.
A close inspection of the snapshots taken of the pattern evolution reveals that the tiny bubbles formed in the hot gel while solidifying serve as nucleation sites for all propagating patterns. Moreover, the glass boundary of our reactor acts also as a significant nucleation site, which produces rather irregular shaped patterns. All the measurements and descriptions reported correspond to patterns forming at the center of our reactor without any boundary interference.
The spatial evolution of the fronts over a particular region is initiated on a steady yellow background of β-HgI2. The front itself is a transformation wave that causes an increase in red α-HgI2 and the subsequent decrease in β-HgI2. After the wave passes through this particular region, α-HgI2 drops slowly and transforms back to a quasi-steady region equivalent to the composition of the background β-HgI2. We also notice, as the front travels, that it has a colorless outline which is presumed to be the complex [HgI4]2− appearing to be an intermediate product of the polymorphic transformation reaction between α-HgI2, composing the front, and β-HgI2, composing the background (see ESI†). The spatial description given above is similar to what is observed in the alteration of red and blue colors appearing in the BZ reaction,27 yet it is very unique and complex in its type since it involves an interplay between diffusion of a chemical wave coupled with a polymorphic transformation of HgI2 along with a redissolution of the precipitate, all occurring in a heterogeneous mixture, in a porous medium (the gel). Moreover, it is obvious in all of our experiments that the propagating front is defined by a colorless outline. This outline is reasoned to be the complex K2HgI4 formed due to the excess iodide solution.
3.2 Spatiotemporal patterns
It is noteworthy to state that the nucleating self-organized patterns are highly dependent on the initial mercuric concentration, [Hg2+]0, in the gel medium. They only appear in a limited range labeled the “excitable region” which exists between 0.16 M and 0.26 M of [Hg2+]0. This “excitable region” coincides perfectly with our previously obtained results on pattern formation in mercuric iodide chemical waves propagating in a two-dimensional system. The pattern formation was observed in the same concentration range and no patterns appeared when reaction was carried out outside this range.28 This brings upon the fact that there exists a relationship between patterns occurring in the two-dimensional system and the three-dimensional patterns appearing on the surface of the gel. This aspect is very clearly explained in the work of Tinsley et al.29 in the work they carried out on a similar system yet precipitating aluminum hydroxide.
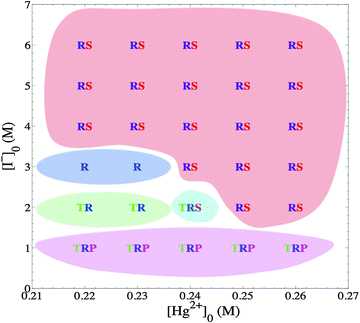
On the other hand, the outer electrolyte plays the role of determining the probability of the pattern, which is going to majorly nucleate. As Fig. 2 shows, at high outer values the major patterns are spirals and ripples, yet as we go lower in concentration, targets become the more major pattern to be observed. Another role of the outer electrolyte noticed is the actual quantity of nucleation sites that actually produce a pattern. At an initial iodide concentration, [I−]0 = 1.0–2.0 M, experiments show nucleation of about 40–50 patterns, but when the concentration increased to 3.0 M and above, the count dropped to less than 10 patterns. Therefore, for simply increasing the probability of nucleation we decrease the outer concentration, yet we expect a crowded reactor with small patterns. If we require a larger pattern relative to the size of the reactor with minimal collision with other patterns, we need to increase the outer concentration.
 , is a linear function of time; i.e.
 , where α = 0.5. This derives from the fact that at the microscopic level, particles undergo Brownian motion whose time increments obey Gaussian statistics. However, exceptions exist in numerous complex systems such as in turbulent fluids,30 chaotic dynamics31 and disordered media,32 whereby anomalous33 sub-(α < 0.5) and superdiffusion (α > 0.5) mechanisms are the driving forces governing the physics of transport.34 While in chemistry subdiffusion is frequently encountered for example when reactions take place in porous media, superdiffusion is only seen in special chemical systems subject to utilization of external forces.31,35,36 We study in this section target patterns that exhibit superdiffusive propagation without external interference.
Target patterns are circular waves that arise from small modified regions that can act as pacemakers due to the slightest perturbations such as the presence of dust particles, gas bubbles or surface defects.37 In homogenous media, these regions typically have a local oscillation frequency higher than that of uniform oscillations.38 On the other hand, the targets in our system nucleate at the air bubbles trapped in the gel after its solidification and lack continuous stimulation. Since in our media such perturbative bubbles are available in moderate amounts, several circular patterns are clearly observed. When the gel preparation is carefully performed with the elimination of the bubbles, no initiation of targets can be observed.
Moreover, the examination of the targets using scanning electron microscopy (SEM) reveals a three-dimensional ridgy wavefront where the boundary of the circular target is actually higher than its internal part with a range between 70 and 100 μm while the gel outside the target is only around 20–40 μm lower.19
By studying the propagation profiles portraying the spread of our targets in time,19 we found that the speeds of these waves are not constant for various inner concentrations and at a constant outer concentration of 1.0 M. The radii were measured throughout the time the patterns are stable before the breakup. In addition, the highest inner concentration indicates the fastest pattern breakup, which may be attributed to the highest initial excitability; thereby the pattern loses stability at an earlier stage. We also realize that at this highest concentration a relatively high velocity of wave propagation is achieved. The diffusion curves, for all cases studied, fit very well a time power law equation of the form R ∼ tα with exponents α well above 0.5, which is the expected value in regular diffusive (Fickian) dynamics as these are diffusion-limited reactions. As the inner concentration is increased from 0.20 M to 0.26 M, the power α increases as well, and ranges from 0.65 to 0.84. This confirms that these patterns are not governed by Fickian diffusion, with underlying microscopic transport driven by an uncorrelated, Markovian, Gaussian process, and reaction kinetics as well as the gel matrix may be playing a stronger role in their dynamics pushing transport into the realm of non-Gaussian processes such as Lévy flights.19 It is noteworthy that at every given experiment we select at random up to 5 targets and perform the same aforementioned curve fitting, only to obtain the same value of the exponent α. Similar measurements are also performed on spirals and targets with different initial outer and inner concentrations and in all these measurements superdiffusive behavior is also achieved.19
When two targets collide they do not overlap but actually merge and form a larger yet deformed pattern. This is a result of the depletion of α-HgI2, constituting the chemical wave, from the region of collision, which transforms to an unperturbed quasi-steady β-HgI2 (see ESI† for a more descriptive video of this incident). After prolonged evolution the patterns are condemned to lose their stability leading to their breakup followed by chemical turbulence.
To add to the characterization of the targets, we also measured the width of the propagating wave and it was found to be fairly constant throughout the reaction. The values are found in the range between 120 and 240 μm. The width does not show any significant change with time but it is confirmed to slightly decrease as [Hg2+]0 increases. This fact shares similarity with the BZ reaction in the experimental and theoretical studies conducted by Bugrim et al.39 and by Pagola and Vidal,40 where it is concluded that the width of the targets remains constant during propagation.
Another type of pattern we encountered is the double spiral wave that we call a ripple and is shaped like a cardioid (Fig. 1(C)). It has a distinct feature that it first gets created as a double spiral wave with two inwardly rotating tips, which meander until they meet, and subsequently merge, resulting in a structure that resembles a deformed target pattern. However, contrary to the case of targets, the presence of a seemingly continuous stimulation gives rise to a family of merging double spirals from the same nucleation site producing a wavetrain of cardioid patterns or ripples. The velocities and separation of the successive waves are calculated and found to be unequal. The relationship between the velocities of these wavetrains and their periods can be accounted for by the anomalous dispersion relation20,21 as will be shown later on.
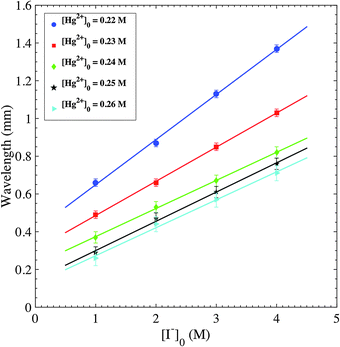
The wavelengths of spirals are then measured. For the same pair of inner/outer concentrations and at different propagation times, up to 10 different ripples/spirals are randomly selected from the total domain to measure their wavelengths. The measured wavelengths at a given time for these different patterns are close to each other due to little dispersion. Fig. 4 provides plots representing the change of the average wavelength, computed from the aforementioned selected patterns, with respect to the tested [Hg2+]0 range at a constant [I−]0. The wavelength exhibits an inverse relation with the value of reacting concentration. All four plots show that from the lowest to the highest concentration tested, the values of wavelengths are halved. On the other hand, the alteration of [I−]0, at constant [Hg2+]0, has the opposite effect on the wavelength, as shown in Fig. 5. The highest [I−]0 has a wavelength measurement of nearly double that of the lowest [I−]0. The values of wavelengths vary between 0.26 and 1.37 mm, in the figures reported. Plesser et al. performed similar tests and they also reported the decrease of spiral wavelength with the increase of proton concentration in the measurements conducted on the BZ reaction patterns.46
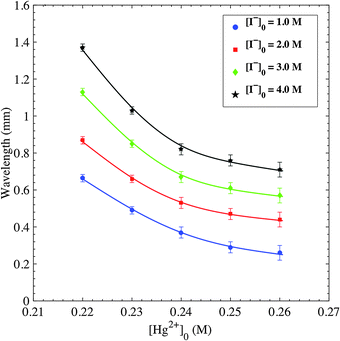 | ||
| Fig. 4 Plots of wavelengths of spiral and ripple patterns versus inner [Hg2+]0. Initial conditions: 1% agar gel, inner [Hg2+]0 = 0.22–0.26 M, [I−]0 = 1.0–4.0 M. | ||
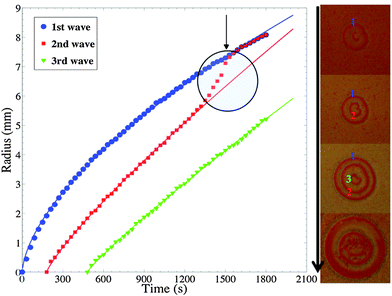
For a given ripple pattern, the distance covered over time, from the nucleation site, of three consecutive waves starting at the moment each one appeared is shown in Fig. 6. This figure uncovers that the leading wave propagates at a relatively slow velocity than the following waves. As shown, the velocities are relatively different, and at an indicated time the leading wave slows down as the second wave catches up and gradually stacks until they merge thus forming one large front. The “attractive” transition between wave 1 and 2 is clearly visible on the graph and is typical of ripples dynamics in this system. Such merging occurs when waves are separated by about 1 mm. The right part of Fig. 6 shows the evolution of the ripple structure that is analyzed in the plots on the left of the same figure and clarifies the described three waves and how they collide with each other leading to the breakup of the pattern. The plots in Fig. 6 also fit a time power law (R ∼ tα), with exponent values all significantly above 0.5, clearly indicating superdiffusive dynamics. The first wave, which is the slowest, has a power value of 0.62 followed by the second wave with a power of 0.84. This explains the reason why the second wave catches up to the leading wave fairly quickly. The power value of the third wave is close to 0.9. This merging of propagating waves indicates that this heterogeneous system exhibits remarkable similarities with excitable systems due to anomalous dispersion (see Fig. 3c by Steinbock et al.20). For such wave merging, the dispersion curves plotted in Fig. 6 start at a high value of wave velocity and do not attain a fixed velocity at a fixed wavelength. The dispersion curves clearly have negative slopes (dc/dT) down to very small periods and the velocity is always greater than the characteristic value of a solitary wave (c0 = 0.0036 mm s−1) with a maximum starting velocity that is about 6 times this value (Fig. 7).
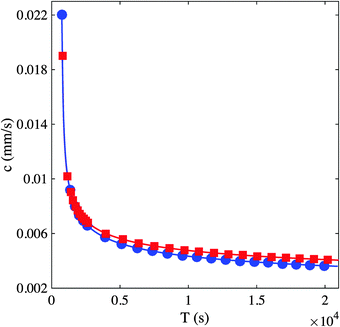 | ||
| Fig. 7 Plots of the dispersion relations of waves in Fig. 6. Square and circles are data plots obtained from the wave pairs (1,2) and (2,3), respectively. The speed c is computed by time differentiation of the nonlinear fits to the curves in Fig. 6. The period T is computed as the difference between the passage times of subsequent waves through a given position in the medium. The overlap of the data points from the two pairs is indicative of consistency of the results. | ||
In addition, this pattern is only observed right after initialization and specifically has the highest probability of occurrence at an outer iodide concentration of 1.0 M. There are rare cases where this pattern is observed at an iodide concentration of 2.0 M, but is definitely nonexistent at a concentration of 3.0 M and above.
3.3 Pattern breakup
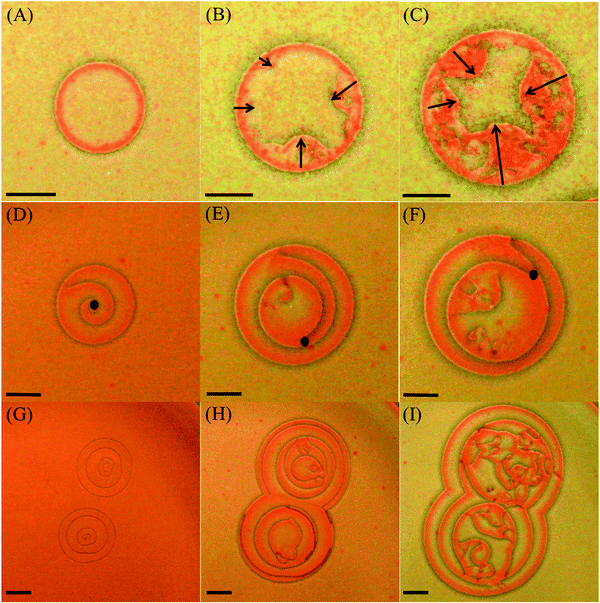
Transition from regular patterns to spatiotemporal chaos is encountered in various systems such as the reaction–diffusion system,12,50,51 fluid flows,52,53 cardiac tissue,6,54 and bacterial colonies.55 In particular, spiral wave instability in a reaction-diffusion system leading to transition to a state of defect-mediated turbulence is subject to extensive investigations.56,57In this work, the dynamics of the breakup of the targets and spirals/ripples, depicted in Fig. 9, is also investigated. Although the breakup mechanisms in the two cases are different, ultimately the system falls into a state of defect-mediated turbulence in both cases.
In the case of targets (Fig. 9(A–C)), the breakup is initiated as defects at different locations on the boundary of the wave itself are formed. These defects propagate inwards towards the nucleation center of the pattern, leaving behind a state of chemical turbulence (see ESI†). The cause of these defects is not very well understood yet. However, bubbles, which do not previously nucleate, may sometimes act as destabilizing obstacles. Furthermore, the higher the [Hg2+]0 or [I−]0 are, the earlier the onset of the instability takes place and the smaller the radius is before the target collapses.
In the case of spirals (Fig. 9(D–F)) and ripples (Fig. 9(G–I)), the breaking up is initiated at the center of the pattern and propagates outwards to form a cascade of birth of smaller spirals leading eventually to chemical turbulence. This dynamical cascade that leads to turbulence seems to be also a consequence of an anomalous dispersion, which is clear in the case of Fig. 9(G–I) whereby the outermost circular fronts of two ripples collide and mutually annihilate forming an 8-shaped leading front. The same thing happens with the second fronts emitted by those ripples but this new front has a higher velocity than the former, leading to a front-to-back collision. As the third and fastest waves arrive and collide with the outermost already merged fronts they create several perturbation sites that act as new pacemakers with higher frequencies than the two ripples. However, these pacemakers fail to produce any organized pattern and eventually lead to chemical turbulence.
In the case of the spiral in Fig. 9(D–F), the transition to turbulence is akin to the instability encountered in spirals, which is caused by the Doppler effect encountered in the BZ reaction.51 This instability is initiated by a Hopf bifurcation acting on the spiral core, which results eventually in large meandering of the spiral tip towards its adjacent wave, causing it to break up and produce more than one perturbation site. The spiral tip snaps off the pinning site and start meandering as shown in Fig. 9(D–F) where the black dots indicates the location of the tip. The new perturbation sites also nucleate spirals with a higher frequency than the initial spiral due to the anomalous dispersive dynamics, which also meander causing more chaos. The new defects introduce more defects, which in their turn contribute more to the pattern chaos spawning a saturation of deformity and ultimately producing a state of chemical turbulence.58 This transition to turbulence is accelerated by the increase of the control parameter [Hg2+]0. The Doppler effect also induces a continuous alteration of the local wavelength of the spiral or the ripple before breakup, as shown in Fig. 9(D–I).
There also exists in our system a second route to pattern break up and that is specific to spirals and ripples. As their structures show, they are made of several propagating waves, arising from the initial nucleation site. In ripples, as the leading wave diffuses with time it slows down allowing the wave following it to catch up and collide with it. This collision produces a larger diffusing front and in many cases causes the pattern to lose stability and break up into a chaotic pattern. It is noteworthy that the total number of waves fired in the case of ripples before breakup increases as the initial concentration of the outer electrolyte [I−]0 increases. For example, in the case of [I−]0 less than or equal to 4.0 M, not more than 3 waves can be fired by a single ripple, whereas in the case of [I−]0 greater than or equal to 5.0 M, one can easily distinguish more than 5 propagating waves for each ripple before breakup. Similarly in spirals, the inner turns become faster than the outermost turn, thus deforming the structure as it evolves. When obvious spatially altered waves emerge, the distance in space between consecutive waves varies. As the [Hg2+]0 increases, the amount of alterations increases thus leading to this kind of breakup.58
4. Conclusion
We report in this study an interesting collection of self-organized patterns observed for the first time in a heterogeneous system that consists of a reaction-diffusion system involving the precipitation of HgI2. The patterns appearing include targets, spirals and ripples that undergo HgI2 polymorphic transformation and also experience instabilities leading to chemical turbulence. The dispersion relation relating the speed of the waves to their wavelengths seems to follow the anomalous trend. We also show that the dynamics of the propagating waves is superdiffusive and this fact constitutes the first example of this kind in chemistry without the utilization of external forces. This will definitely open the door for further investigations including the theoretical understanding of this anomalous behavior and the formation of these patterns, leading to predictive models. In addition, the main concern and a future endeavor is to apply external forces onto our patterns, such as thermal, chemical, electrical, etc. alterations,59,60 to reduce or suppress pattern instabilities and chemical turbulence.Conflicts of interest
The authors declare no competing financial interests.Acknowledgements
This work was supported by the Lebanese Council for National Scientific Research (LCNSR), the University Research Board, American University of Beirut and the Hungarian Research Fund (OTKA K104666).References
- B. Grzybowski, Chemistry in Motion: Reaction-diffusion Systems for Micro-and Nanotechnology, Wiley Online Library, 2009 Search PubMed.
- B. A. Grzybowski, K. J. Bishop, C. J. Campbell, M. Fialkowski and S. K. Smoukov, Soft Matter, 2005, 1, 114–128 RSC.
- M. C. Cross and P. C. Hohenberg, Rev. Mod. Phys., 1993, 65, 851 CrossRef CAS.
- A. Panfilov, R. Keldermann and M. Nash, Proc. Natl. Acad. Sci. U. S. A., 2007, 104, 7922–7926 CrossRef CAS PubMed.
- M. Loose, E. Fischer-Friedrich, J. Ries, K. Kruse and P. Schwille, Science, 2008, 320, 789–792 CrossRef CAS PubMed.
- L. D. Weise and A. V. Panfilov, PLoS One, 2011, 6, e27264 CAS.
- S. C. Müller and J. Ross, J. Phys. Chem. A, 2003, 107, 7997–8008 CrossRef.
- P. Hantz, J. Phys. Chem. B, 2000, 104, 4266–4272 CrossRef CAS.
- T. Narita and M. Tokita, Langmuir, 2006, 22, 349–352 CrossRef CAS PubMed.
- P. De Kepper, I. R. Epstein and K. Kustin, J. Am. Chem. Soc., 1981, 103, 2133–2134 CrossRef CAS.
- A. Zaikin and A. Zhabotinsky, Nature, 1970, 225, 535–537 CrossRef CAS PubMed.
- Q. Ouyang and H. L. Swinney, Nature, 1991, 352, 610–612 CrossRef.
- A. M. Turing, Bull. Math. Biol., 1990, 52, 153–197 CrossRef CAS PubMed.
- R. Imbihl and G. Ertl, Chem. Rev., 1995, 95, 697–733 CrossRef CAS.
- S. Jakubith, H. Rotermund, W. Engel, A. Von Oertzen and G. Ertl, Phys. Rev. Lett., 1990, 65, 3013–3016 CrossRef CAS PubMed.
- A. Volford, F. Izsák, M. Ripszám and I. Lagzi, Langmuir, 2007, 23, 961–964 CrossRef CAS PubMed.
- G. Fernández-García and V. Pérez-Muñuzuri, Eur. Phys. J.: Spec. Top., 2008, 165, 169–174 CrossRef.
- P. M. Wood and J. Ross, J. Chem. Phys., 1985, 82, 1924 CrossRef CAS.
- M. M. Ayass, I. Lagzi and M. Al-Ghoul, Phys. Chem. Chem. Phys., 2014, 16, 24656–24660 RSC.
- C. T. Hamik, N. Manz and O. Steinbock, J. Phys. Chem. A, 2001, 105, 6144–6153 CrossRef CAS.
- N. Manz, C. Hamik and O. Steinbock, Phys. Rev. Lett., 2004, 92, 248301 CrossRef CAS PubMed.
- M. M. Ayass, A. Abi Mansour and M. Al-Ghoul, J. Phys. Chem. A, 2014, 118, 7725–7731 CrossRef CAS PubMed.
- G. A. Jeffrey and M. Vlasse, Inorg. Chem., 1967, 6, 396–399 CrossRef CAS.
- M. Hostettler, H. Birkedal and D. Schwarzenbach, Acta Crystallogr., Sect. B: Struct. Sci., 2002, 58, 903–913 Search PubMed.
- M. Hostettler, H. Birkedal and D. Schwarzenbach, Helv. Chim. Acta, 2003, 86, 1410–1422 CrossRef CAS.
- I. Das, A. Pushkarna and N. R. Agrawal, J. Phys. Chem., 1989, 93, 7269–7275 CrossRef CAS.
- R. J. Field and R. M. Noyes, J. Am. Chem. Soc., 1974, 96, 2001–2006 CrossRef CAS.
- M. M. Ayass and M. Al-Ghoul, J. Phys. Chem. A, 2014, 118, 3857–3865 CrossRef CAS PubMed.
- M. R. Tinsley, D. Collison and K. Showalter, J. Phys. Chem. A, 2013, 117, 12719–12725 CrossRef CAS PubMed.
- G. Boffetta, F. De Lillo and S. Musacchio, Phys. Rev. E: Stat., Nonlinear, Soft Matter Phys., 2012, 85, 066322 CrossRef CAS.
- M. Paoletti, C. Nugent and T. Solomon, Phys. Rev. Lett., 2006, 96, 124101 CrossRef CAS PubMed.
- J.-P. Bouchaud and A. Georges, Phys. Rep., 1990, 195, 127–293 CrossRef.
- R. Klages, G. Radons and I. M. Sokolov, Anomalous Transport, Wiley. com, 2008 Search PubMed.
- V. Shkilev, J. Exp. Theor. Phys, 2008, 107, 892–898 CrossRef CAS.
- Z. Noszticzius, Z. Bodnar, L. Garamszegi and M. Wittmann, J. Phys. Chem., 1991, 95, 6575–6580 CrossRef CAS.
- A. von Kameke, F. Huhn, G. Fernández-García, A. Muñuzuri and V. Pérez-Muñuzuri, Phys. Rev. E: Stat., Nonlinear, Soft Matter Phys., 2010, 81, 066211 CrossRef CAS.
- A. S. Mikhailov and K. Showalter, Phys. Rep., 2006, 425, 79–194 CrossRef CAS.
- Y. Kuramoto, Chemical Oscillations, Waves, and Turbulence, Courier Dover Publications, 2003 Search PubMed.
- A. E. Bugrim, M. Dolnik, A. M. Zhabotinsky and I. R. Epstein, J. Phys. Chem., 1996, 100, 19017–19022 CrossRef CAS.
- A. Pagola and C. Vidal, J. Phys. Chem., 1987, 91, 501–503 CrossRef CAS.
- P. S. Hagan, SIAM J. Appl. Math., 1982, 42, 762–786 CrossRef.
- J. Ma, B. Hu, C. Wang and W. Jin, Nonlinear Dyn., 2013, 1–11 Search PubMed.
- Th. Walter, W. Pesch and E. Bodenschatz, Chaos, 2004, 14, 933–939 CrossRef CAS PubMed.
- E. D. Siggia and A. Zippelius, Phys. Rev. A: At., Mol., Opt. Phys., 1981, 24, 1036 CrossRef CAS.
- E. Meron, Phys. Rep., 1992, 218, 1–66 CrossRef.
- T. Plesser, S. C. Mueller and B. Hess, J. Phys. Chem., 1990, 94, 7501–7507 CrossRef CAS.
- G. Ermentrout, S. Hastings and W. Troy, SIAM J. Appl. Math., 1984, 44, 1133–1149 CrossRef.
- Y. Kuramoto, Prog. Theor. Phys., 1980, 63, 1885–1903 CrossRef CAS.
- Y. Nishiura and M. Mimura, SIAM J. Appl. Math., 1989, 49, 481–514 CrossRef.
- A. Belmonte, J.-M. Flesselles and Q. Ouyang, EPL, 1996, 35, 665 CrossRef CAS.
- Q. Ouyang, H. L. Swinney and G. Li, Phys. Rev. Lett., 2000, 84, 1047–1050 CrossRef CAS PubMed.
- R. E. Ecke, Y. Hu, R. Mainieri and G. Ahlers, Science, 1995, 269, 1704–1707 CAS.
- N. Mukolobwiez, A. Chiffaudel and F. Daviaud, Phys. Rev. Lett., 1998, 80, 4661 CrossRef CAS.
- R. F. Gilmour, Drug Discovery Today, 2003, 8, 162–167 CrossRef CAS PubMed.
- K. J. Lee, E. C. Cox and R. E. Goldstein, Phys. Rev. Lett., 1996, 76, 1174 CrossRef CAS PubMed.
- B.-W. Li, L.-Y. Deng and H. Zhang, Phys. Rev. E: Stat., Nonlinear, Soft Matter Phys., 2013, 87, 042905 CrossRef.
- O. Steinbock and H. Engel, Eng. Polym. Chem. Complexity, 2013, 11, 147 CAS.
- L. Q. Zhou and Q. Ouyang, J. Phys. Chem. A, 2001, 105, 112–118 CrossRef CAS.
- Q. Lou, J.-X. Chen, Y.-H. Zhao, F.-R. Shen, Y. Fu, L.-L. Wang and Y. Liu, Phys. Rev. E: Stat., Nonlinear, Soft Matter Phys., 2012, 85, 026213 CrossRef.
- P. Kaštánek, J. Kosek, D. Šnita, I. Schreiber and M. Marek, Phys. D, 1995, 84, 79–94 CrossRef.
Footnote |
| † Electronic supplementary information (ESI) available: Two videos are provided displaying the propagation of the spiral and target patterns. An extra file is provided explaining the contents of each video. See DOI: 10.1039/c5cp01879j |
| This journal is © the Owner Societies 2015 |

