 Open Access Article
Creative Commons Attribution 3.0 Unported Licence
Ionic liquid- and surfactant-controlled crystallization of WO3 films†
Helena
Kaper
ab,
Igor
Djerdj
*c,
Silvia
Gross
d,
Heinz
Amenitsch
e,
Markus
Antonietti
a and
Bernd M.
Smarsly
*f
aMax Planck Institute of Colloids and Interfaces, Department of Colloid Chemistry, Am Mühlenberg 1, 14476 Potsdam, Germany
bCeramic Synthesis and Functionalization Laboratory UMR 3080, 84306 Cavaillon, France
cRuđer Bošković Institute, Bijenička 54, 10000 Zagreb, Croatia. E-mail: igor.djerdj@irb.hr; Fax: +38514680114; Tel: +38514680113
dIENI-CNR, Dipartimento di Scienze Chimiche, Università degli Studi di Padova, and INSTM UdR Padova, via Marzolo 1, 5131-Padova, Italy
eGraz University of Technology, Institute of Inorganic Chemistry, A-8010 Graz, Austria
fInstitute of Physical Chemistry, Heinrich-Buff-Ring 58, D-35392, Giessen, Germany. E-mail: bernd.smarsly@phys.chemie.uni-giessen.de; Fax: +49 641 99-34509; Tel: +49 641 99-34590
First published on 27th May 2015
Abstract
WO3 films were obtained via evaporation-induced self-assembly (EISA) using ionic surfactants such as long-chain ionic liquids 1-hexadecyl-3-methyl imidazolium chloride and bromide (C16mimCl and C16mimBr, respectively) and cetyltrimethylammonium chloride and bromide (CTAC and CTAB, respectively) as additives. Owing to the presence of the ionic surfactants, WO3 films crystallize in a preferred orientation along the a-axis on different substrates, as evidenced by X-ray diffraction. WO3 films with this orientation show improved electrochromic properties when compared to films with a lower degree of crystallographic orientation, prepared in an analogue fashion.
1. Introduction
The synthesis of inorganic crystalline nanostructures with control over size, shape and morphology of the final material represents an important issue in nanoscience. In this context, the preferred growth of matter in one or two dimensions, as accomplished in quantum dots (0D), nanowires and nanotubes (1D) or quantum wells (2D), has opened a new research field of both fundamental and technological interest. The physical properties of such anisotropic, nanoscopic materials often differ from those of polycrystalline materials (e.g. melting point, conductivity, magnetism, optical performance).1,2In the past few years, novel concepts for manipulating the nucleation and crystallization of inorganic structures from solution have been discovered and developed, especially for metal oxides. One very appealing strategy is the utilization of soft matter, i.e. surface-active agents and polymers, for direct nucleation/crystallization, used by Nature in biomineralization processes.3 Recently, oxide nanoparticles with oriented crystallites were achieved by means of “oriented attachment”.4 In essence, it was found that the interaction of organic compounds with the growing inorganic material not only limits the crystallite size, but also leads to the preferred orientation and the preference of otherwise unusual or thermodynamically unstable modifications. Further insights into such unusual crystallization processes were recently described by Cölfen and Antonietti.5–8
While these examples mainly involve powders or monolithic materials, the preparation of a thin film of metal oxides with oriented crystallinity, however, is not straightforward using solution-based chemistry. Crystalline films of metal oxides with a preferred orientation are usually synthesized via deposition of molecular species from the gas phase,9 such as by pulsed laser deposition or molecular beam epitaxy, or from the liquid phase10 onto single-crystalline substrates. The idea of these procedures is to grow the crystals in a direction corresponding to the exposed lattice plane of the substrate. Thereby, the lattice parameters of the substrate match those of the oxide, a relationship which is generally referred to as epitaxy. The term “soft epitaxy’’ has only recently been introduced for solution-based orientational growth of metal oxides on arbitrary substrates via EISA.11 In this case, nucleation and crystallization are influenced by the presence of polymers, block copolymers or ionic surfactants. So far, only films of transition metal oxides with a highly anisotropic unit cell have been obtained with a preferred orientation, e.g. MoO3, Ta2O5 and MgTa2O6.11–13 It was indeed shown for MoO3 that the preferred orientation combined with defined mesoporosity results in improved electrochemical properties (Li-storage) in comparison to films of polycrystalline MoO3.13 These few reports mainly described mesoporous materials prepared using block copolymers. The preferred crystallization was attributed to the combination of the anisotropy of the unit cell and a layer-like make-up of the crystal structure present in the aforementioned oxides. It had thus remained unclear if the preferred crystalline orientation can also occur with metal oxides possessing a less anisotropic unit cell. Furthermore, the role of the surfactant has not been systematically investigated.
In this work, using an analogue approach, crystalline WO3 films are prepared by a sol–gel chemistry procedure analogous to the EISA process under the influence of ionic surfactants such as the long-chain ionic liquids C16mimCl and C16mimBr as well as the ionic surfactants CTAC and CTAB. Even though the unit cells of monoclinic and orthorhombic WO3 are nearly isotropic, the layer-like make-up of the unit cell with its anisotropic polarizability was studied with respect to oriented crystal growth relative to the surface. We thus addressed the question if a possible preferred orientation is correlated with the energy of the planes, taking into account of the fact that the (001) surface is the lowest energy surface for monoclinic tungsten oxide.14
Tungsten oxide films have been studied for many years with respect to application such as electrochromic devices for self-coloring windows (“smart windows”) in energy efficient buildings,15,16 antidazzle mirrors and thermal emittance in temperature control devices.17 In fact, in comparison to other electrochromic materials, tungsten oxide is by far the best studied and most promising candidate.18
The influence of numerous parameters on the electrochromic performance of sol–gel derived tungsten oxide films has been investigated in detail; among them are the annealing procedure and the coating process (spin coating vs. dip-coating),19 mesoporosity20–22 or humidity during the deposition process.23 However, even though the orientation effects have been observed,23 a direct comparison between the electrochromic properties of crystallographically oriented and non-oriented sol–gel derived films has not yet been undertaken. In the course of this study, we succeeded in synthesizing both crystallographically weakly oriented and oriented WO3 films through a sol–gel based coating under similar conditions (e.g. same precursor, analogue deposition procedure and temperature treatment). This enabled us to study the influence of the preferred orientation on the electrochromic performance of WO3 films.
Here, we report the synthesis of WO3 films with a preferred orientation obtained via EISA using ionic surfactants as additives and their physico-chemical characterization. The crystallization and preferred orientation were further studied by X-ray diffraction (XRD) in combination with the Rietveld refinement and 2D-XRD analysis. The atomic composition of the surface and the chemical state of the tungsten oxide were confirmed by X-ray photoelectron spectroscopy (XPS) measurements. The electrochemical behavior of the films was studied in detail by temperature-dependent multistep chronoamperometry.
2. Experimental techniques
2.1. Preparation of WO3 films
The ionic surfactants CTAC and CTAB were purchased from Sigma-Aldrich and used as received. The ionic liquids C16mimCl and C16mimBr were prepared via a reported strategy.24 For the preparation of the WO3 films, 0.2 mmol of surfactant were dissolved in 3 ml of ethanol. Also, a solution of 0.5 g (1.3 mmol) of WCl6 in 3 ml ethanol and 1 ml THF was prepared. After complete dissolution of both solutions, they were combined and stirred for 14 h. The deposition by dip-coating was carried out at a speed of 7 mm s−1 at a relative humidity of 5–10%. The films were dip-coated onto FTO-coated glass. The freshly prepared films were kept at 300 °C for 12 h. Calcination aimed at material crystallization was performed in air at a heating rate of 7.5 °C min−1, up to 560 °C, 570 °C and 585 °C. The films have a thickness of 180 nm, as determined by profilometry.2.2. Analytical methods
WAXS experiments in Theta–2Theta geometry were conducted using a D8 diffractometer from Bruker Instruments (Cu Kα radiation, λ = 0.154 nm). Alternatively, an Enraf-Nonius PDS-120 powder diffractometer in reflection mode, equipped with an FR-590 generator as the source of Cu Kα radiation, was used. Monochromatization of the primary beam was achieved by means of a curved Ge crystal. Scattered radiation was measured using a Nonius CPS120 position-sensitive detector. The resolution of this detector in 2Φ is 0.018°. The Rietveld refinement was performed using the programme FULLPROF.25 The phase composition of the investigated compound was determined from the refined values of scale factors using the Hill and Howard approach.26 The profile function was chosen to be the modified Thompson–Cox–Hastings pseudo-Voigt (TCH pV) method, allowing a straightforward size analysis. In this approach, we assumed that the line-broadening of the deconvoluted profile was attributable solely to the small crystallite size. The values of half-width parameters U, V, W and X were kept constant at instrumental values determined by using the crystalline standard LaB6. The background profile was modelled by cubic interpolation of predetermined background points with refinable heights. In the final run, a total of 62 parameters were varied including lattice parameters, zero point of detector, background heights and profile parameters. The quality of Rietveld refinement was evaluated in terms of the discrepancy factor (profile weighted residual error), Rwp, and the goodness-of-fit indicator, GoF. Crystal structures were drawn using the programme VESTA.27XPS spectra were run on a Perkin-Elmer Φ5600ci spectrometer using standard Al-Kα radiation (1486.6 eV) working at 350 W. The spectrometer was calibrated by assuming the binding energy (BE) of the Au 4f7/2 line to be 83.9 eV with respect to the Fermi level. The standard deviation of the BE values was 0.15 eV. The reported BE values were corrected for the charging effects, assigning the BE value of 284.6 eV28 to the C1s line of the carbon contaminant. Survey scans (187.85 pass energy, 1 eV per step, 25 ms per step) were obtained in the 0–1300 eV range. Detailed scans (58.7 eV pass energy) were recorded for the O1s (0.1 eV per step, 50 ms per step), C1s (0.1 eV per step, 50 ms per step), W4f (0.05 eV per step, 200 ms per step) and W4d (0.1 eV per step, 100 ms per step) regions. The atomic composition, after Shirley type background subtraction,29 was evaluated using sensitivity factors supplied by Perkin-Elmer.30 The depth profile was carried out by Ar+ sputtering at 2.5 kV with an Argon partial pressure of 5 × 10⁻⁶ Pa. A specimen area of 2 × 2 mm2 was sputtered. Samples were introduced directly into the XPS analytical chamber by a fast entry lock system. The assignment of the peaks was carried out by using the values reported in ref. 30 and 31.
Krypton sorption measurements were conducted at 77 K using an Autosorb 1 from Quantachrome GmbH. The films were degassed at 150 °C prior to the sorption measurements.
The electrochromic properties of the WO3 films were investigated using the films on FTO-covered glass as working electrodes, a silver wire as the reference electrode and Pt as an auxiliary electrode. As electrolyte solution, 1 M LiClO4 in propylene carbonate was used. The potential range was determined to be ±1 V vs. Ag using an Autolab 12 potentiostat/galvanostat from Eco Chemie and using GPES software for collection and analysis of data.
Transmission electron microscopy (TEM) investigations were performed using a CM3OST microscope (Philips; LaB6 cathode, operated at 300 kV, point resolution of 2 Å).
3. Results and discussion
3.1. Characterization of WO3 films
Fig. 1 shows the results of the electron microscopy study of an oriented WO3 film treated at 585 °C. The TEM image (Fig. 1(a)) displays a loose packing of nanoparticles. Selected-area electron diffraction (SAED) and high-resolution TEM (HRTEM) analyses confirm the high crystallinity of the sample (see Fig. 1(b) and (c)), respectively. The obtained SAED pattern exhibits a non-uniform azimuthal distribution or Debye–Scherrer rings superimposed with some discrete Laue spots. Such findings indicate a rather inhomogeneous grain size distribution of the film including the departure from spherical crystal morphology.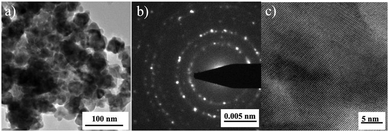 | ||
| Fig. 1 Characterization of oriented WO3 films via electron microscopy after temperature treatment at 585 °C; (a) TEM image; (b) SAED pattern of the same area; and (c) HRTEM image. | ||
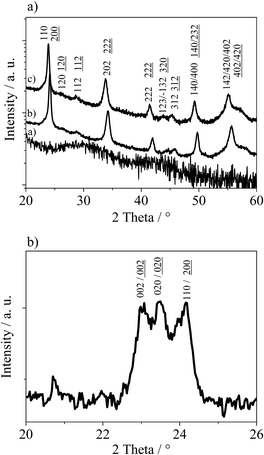
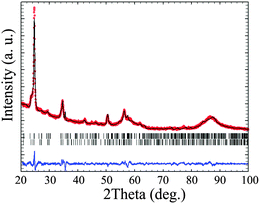
In Fig. 2(a), XRD patterns of WO3 films prepared with C16mimCl obtained after annealing at 565 °C, 570 °C and 585 °C are shown. The film treated at 565 °C is still completely amorphous, indicating that the crystallization of the films starts only at temperatures above ca. 570 °C. The phase identification and reflection assignment are not straightforward from the XRD analysis due to several factors. Owing to the preferred orientation effect, certain reflections show decreased intensity (if compared to an ideal polycrystalline material), while others are enhanced. In addition to that, the XRD patterns of monoclinic and orthorhombic WO3 are very similar, differing mainly in the peaks that are masked due to the oriented growth. Moreover, the orientation effect is weak, so that not the whole XRD pattern is affected. In order to explore and quantify the aforementioned crystallographic features, Rietveld analysis of the corresponding XRD patterns of WO3 was carried out. The results of the analysis performed for two crystalline WO3 films (treated at 570 or 585 °C) are summarized in Table S1 in the ESI.† Both samples present monoclinic (space group P21/n) as well as orthorhombic (space group Pmnb) WO3 phases, although in different proportions, with high prevalence of the orthorhombic one. This is even more pronounced at the annealing temperature of 585 °C, where the material consists almost entirely of an orthorhombic (95.9 wt%) phase of WO3. Such findings are in agreement with the structural stability and the phase diagram of WO3 thin films produced by laser ablation: monoclinic → orthorhombic → hexagonal. The first reported transition occurs at 350 °C, while the second one begins at 500 °C.32 The calculated average crystallite sizes are in agreement with the expected influence of annealing temperature, i.e. films treated at higher temperatures show larger crystallites, as particularly evidenced for the monoclinic phase. Finally, an important issue deduced from the Rietveld analysis of XRD patterns is the presence of the preferred orientation effect, being in line with our previous observations. Such an effect is confirmed by the XRD pattern recorded for films scratched off the Si-substrate. In this case, the masked 020 and 002 reflections of monoclinic WO3 or orthorhombic WO3 are present (see Fig. 2(b)). Therefore, in the Rietveld refinement we assumed that the WO3 nanocrystals are preferentially oriented to the thin film plane in the [200] direction, i.e. along the a-axis. This assumption was supported by the fact that all calculated XRD peaks matched well with the experimental pattern applying Rietveld refinement that included a parameter for the preferred orientation (Fig. 3). However, the orientation effect is rather weak, since measurements in asymmetric reflection (rocking curve) do not reveal a sharp peak as expected for pronounced orientation. The degree of preferred orientation can be quantified by comparison of values of preferred orientation parameters (exponential coefficient in the preferred orientation correction function) from Table S1 (ESI†). It can be seen that despite being a minor phase in the prepared films, the monoclinic polymorph exhibits a higher preferred orientation compared to the orthorhombic one. In addition, XRD experiments were performed in grazing incidence geometry using a 2D detector, in order to study the preferred crystallographic orientation (see ESI,† Fig. S1). The observed 2D XRD pattern of a sample heated at 575 °C shows an anistropic intensity distribution for the reflection, i.e. a significant deviation from Debye–Scherrer rings. Thus, these data also point to a weakly preferred crystalline orientation. A preferred orientation can also be observed when using other ionic surfactants differing only in the head group, e.g. CTAC and CTAB as well as using different counterions, e.g. C16mimBr.
However, the degree of preferential orientation is lower compared to IL surfactants, as indicated by differences in the relative intensity of the 020 reflections in XRD (see ESI,† Fig. S2). Varying the concentration of the IL surfactant in the starting solution does not alter the degree of orientation, but a preferred orientation can be achieved already at a quite low concentration of the surfactant. The presence of these surface-active agents alone even at a low concentration directly leads to the oriented growth of the crystallites on the surface, which is in line with previous studies.11
The surfactant thus exerts an interesting effect on the crystallization of tungsten oxide. First, crystallization is inhibited (crystallization of tungsten oxide using sol–gel precursors usually starts at lower temperatures, around 400 °C). Moreover, heat treatment involves orientation effects, exposing the (100) surface, even though the unit cells of monoclinic and orthorhombic tungsten oxide are only slightly anisotropic. Interestingly, such effects were not observed when WO3 films were prepared via a similar procedure using the block copolymer KLE (poly(ethylene-co-butylene)-block-poly(ethylene oxide)) as a template,20,22 even though orientation effects on other transition metal oxide films with anisotropic unit cells have been observed using KLE.11 The orientation due to the presence of surface-active agents in the case of metal oxides with anisotropic unit cells was attributed to the balance between the interfacial energy of the surface and the oxide, increased mobility due to surfactant lubrification, and finally screening of the induced polarization on the polarisable oxide by a polar substrate. The first two arguments can also be applied to the orientation of tungsten oxide by ionic surfactants. Due to the low structural anisotropy (as visible in Fig. 4, both WO3 polymorphs exhibit almost cubic-like crystal structures), it seems that the electric polarization of tungsten oxide will be rather isotropic. However, the measurement of optical properties performed on orthorhombic single WO3 crystals revealed a high birefringence Δn = 0.42.33 Moreover, WO3 belongs to the class of biaxial crystals characterized by three refractive indices corresponding to three principal axes of the crystal (nγ = 2.703, nβ = 2.376, and nα = 2.283). The birefringence of WO3 can be accounted for on the basis of an anisotropic molecular electronic polarisability. Hence, the third argument, the screening of the induced anisotropic polarization by a polar substrate, plays an important role in the observed preferred orientation of WO3 films. We ascribed therefore the improved orientation in the present case to the stronger ionic interaction of C16mimCl and CTAC. This observation is in agreement with the recently described orientation effects of WO3 nanocrystals on BF4−-ions.34 The authors attributed the preferred orientation along the z-axis to adsorption of BF4− ions onto the (001) facet. We assume that in our case, the presence of a surfactant and the low concentration of negatively charged ions, in comparison to the work of Zhang and coworkers, produce a different orientation effect. On examining the unit cells of monoclinic and orthorhombic WO3 (see Fig. 4), the tungsten atom density is found to be the lowest on the (100) facet. The lengths of the unit cell are nearly equal for all three sides (see Table S1, ESI†), with the a-axis being shorter than the b- and c-axes. Therefore, the (100) surface has the lowest density of atoms. Thus, the screening of charges by the ionic surfactant attached to the substrate (e.g. glass or Si wafer) is facilitated for the WO3 surface with the lowest density of atoms due to spatial resolution, avoiding repulsion between the head groups of the surfactants. The preferred interaction between the surfactant and the (100) surface results in a preferred growth on the substrate, along the a-direction.
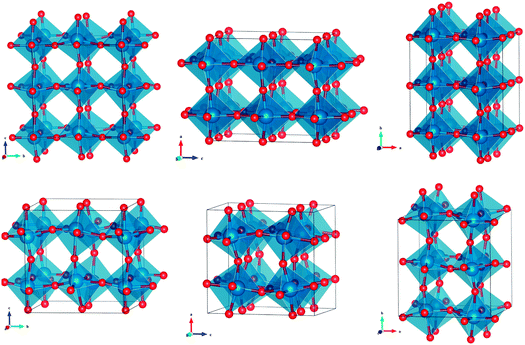 | ||
| Fig. 4 Unit cell of orthorhombic (top row) and monoclinic (bottom row) tungsten oxide shown with orientation along the a-axis, b-axis and c-axis (from left to right). | ||
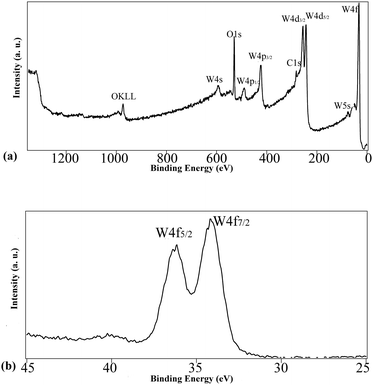
The surface and in-depth compositions of the films treated at 570 °C were analyzed by XPS to obtain information on the oxidation state, the chemical environment as well as the surface and in-depth distribution of the species. To this latter aim, we performed some sputtering-analysis cycles on the surface of the films. The survey spectrum plotted in Fig. 5(a) refers to the sample after 20 minutes of sputtering and evidences the presence of W, O and C. The O/W atomic ratio of the surface is 4, higher than that expected by the stoichiometry of the title compound (i.e. 3) since oxygen is also present as a contaminant. Accordingly, the atomic percentage of adventitious carbon is also high (88 at%), whereas after mild sputtering it is noticeably decreased to 23 at%. Upon sputtering, the W/O atomic ratio also decreases due to the preferential sputtering phenomenon involving oxygen, which in turn determines a relative enrichment of W on the exposed surface of the film. In Table 1, the atomic percentages of the species in the sample calcined at 570 °C are reported at different sputtering times.
| Sputtering time (minutes) | O (%) | W (%) | C (%) | W/O |
|---|---|---|---|---|
| 0 | 9.1 | 2.2 | 88.7 | 0.2 |
| 10 | 38.8 | 38.4 | 22.8 | 1.0 |
| 20 | 36.6 | 33.5 | 29.9 | 0.9 |
| 40 | 45.7 | 37.1 | 17.2 | 0.8 |
The films contain no other impurities such as chloride species from the precursor, revealing an overall high purity of the film.
Concerning the chemical state of the two main species, i.e. oxygen and tungsten, the former has BE values ranging between 530.4 and 530.7 eV, according to the different points sampled by performing the depth profile. These values are not diagnostic for the type of oxygen involved since the BE values of both WO3 (530.3–530.8 eV) and WO2 (530.4–530.8) are similar.35 The W4f region of tungsten (see Fig. 5(b)) is instead characterized by different BE values on the surface and in the inner layers emerged after sputtering. On the surface, the value is 35.3 eV, which is in agreement with the one reported for WO3 (35.3–35.8 eV);35 furthermore, the W4f doublet is symmetric and consists of only one component, ascribed to WVI, whereas the presence of further oxidation states could be ruled out. Also the value of the W4d5/2 region, i.e. 247.0 eV, is in good agreement with data reported in the literature for WO3, whereas the value of WIV would be remarkably lower (i.e. 243.5 eV).35 Nevertheless, already after the first cycle of sputtering, a considerable broadening was observed (data not shown) which can be traced back to the copresence of different oxidation states (WVI, WV and WIV). This reduction and the presence of tungsten in a lower oxidation state are likely not intrinsic in the sample, but rather determined by the already mentioned preferential sputtering of oxygen, which in turn determines the formation of an understoichiometric amount of oxygen around tungsten. It is well known from the literature that ion bombardment on oxides and WO3, in particular, can cause reduction to lower stoichiometric and non-stoichiometric oxides, due to the preferential sputtering of oxygen. Driscoll et al.36 reported that surface sputtering of thermally evaporated WO3 films determines the formation of an altered layer composed of W, WO2, and WOx (with x = 2.6), and the presence of low binding energy features has already been observed in crystalline WO3 exposed to Ar+ bombardment.36 On the basis of this consideration, the original presence of WO3 can reasonably be assumed.
Krypton sorption analysis shows that a substantial amount of krypton is adsorbed by the films (see Fig. 6), indicating mesoporosity with an average pore size around 3 nm, as determined by BJH analysis on the adsorption branch. However, the analysis contains quite a large margin of error, since the evaluation method is based on nitrogen sorption thermodynamics. Besides, the specific BET surface area cannot be determined as the exact amount of WO3 used in the analysis can only roughly been estimated.
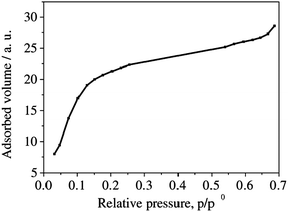 | ||
| Fig. 6 Krypton sorption adsorption branch of WO3 films treated at 400 °C. The measurement was performed at 77 K. | ||
3.2. Electrochromic properties
The electrochromic performance of WO3 is influenced by several factors, e.g. the morphology, porosity and crystallinity. With respect to application as self-coloring windows or charge storage, the impact of temperature variations and long-term stability is also of interest. Therefore, in the following, the influence of crystallinity, temperature and time on the electrochromic properties of the oriented C16mimCl-templated WO3 films is studied and compared to non-oriented films prepared under analogous conditions using a block copolymer.22 Films treated at 560 °C (film a), 570 °C (film b) and 585 °C (film c) were investigated. The experiment was conducted by adopting the following procedure: initially, the films were cycled at 20 °C for 130 min, then at 50 °C and 70 °C for 100 min each and finally again at 20 °C. As can be seen in Fig. 7, the charge insertion depends on the temperature and the annealing temperature of the films. At the beginning, insertion is not a stable process, which is often observed due to electrode effects.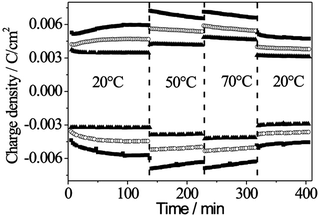 | ||
| Fig. 7 Temperature dependence of the charge insertion into WO3 films treated at 560 °C (filled squares), 570 °C (filled triangles) and 585 °C (open circles). | ||
The high current exchange of the amorphous film in comparison to the crystalline films can be explained by facilitated Li-insertion into the amorphous structure. In crystalline films, the energy barrier for Li-insertion increases due to the presence of crystallites.37 At elevated temperatures, the current exchange of Li is higher in all cases while stability and reversibility are maintained. This higher current exchange can be partially explained via accessibility of less favored sites at elevated temperatures and a better contact between the ITO-substrate and the WO3 film, resulting in enhanced electron transport across the interface. Another important aspect in this context is the stability upon heating and cooling. After heating to 50 °C and 70 °C and cooling to 20 °C, the films exhibit the same behavior as before heating, which is an important feature with respect to application.
In Table 2, the characteristic times of coloration and bleaching at different temperatures are summarized for all three films. The characteristic time is defined as the time needed to reach 90% of the coloration maximum or minimum. Coloration/bleaching is the quickest for the amorphous film at all temperatures. However, after 400 min of heating and cooling, the amorphous film shows a significant increase of the characteristic time, demonstrating the instability of the long-term performance of the film. The increase of the characteristic time in the case of film b can be explained when considering that more charge is inserted at elevated temperatures (see also Fig. 7). Finally, film c shows rather a large discrepancy between the characteristic time of coloration and bleaching – bleaching of this film occurs extremely rapidly.
| Time/min | Temperature/°C | τ col (τbl)/s of film a | τ col (τbl)/s of film b | τ col (τbl)/s of film c |
|---|---|---|---|---|
| τ col: characteristic coloration time; τbl: characteristic bleaching time. The characteristic time is defined as the time needed to achieve 90% of the coloration maximum/minimum. Film a: calcined at 560 °C; film b: calcined at 570 °C, and film c: calcined at 585 °C. | ||||
| 100 | 20 | 12 (12) | 15 (15) | 24–27 (9) |
| 200 | 50 | 12 (15) | 30 (30) | 21 (9) |
| 250 | 70 | 12 (12) | 36 (30) | 18–21 (6) |
| 400 | 20 | 15–20 (15–20) | 12 (9) | 21–24 (9) |
Since upon increasing the temperature the charge density also increases, it is reasonable to calculate the rate of reduction ν, where ν is defined as
| ν = q/t | (1) |
Another interesting feature to be considered is the coloration efficiency CE. The coloration efficiency is defined as the change in the optical density OD relative to the amount of charge q inserted per square centimeter.
| CE = ΔOD/q | (2) |
| ΔOD = log(Γox/Γred) = Absred − Absox | (3) |
| Time/min | Temperature/°C | CE/cm2 C−1 of film a | CE/cm2 C−1 of film b | CE/cm2 C−1 of film c |
|---|---|---|---|---|
| Film a: calcined at 560 °C; film b: calcined at 570 °C, and film c: calcined at 585 °C. | ||||
| 100 | 20 | 13 | 29 | 30 |
| 200 | 50 | 9 | 23 | 27 |
| 250 | 70 | 8 | 20 | 26 |
| 400 | 20 | 11 | 31 | 31 |
| Time/min | Temperature/°C | CR/% of film a | CR/% of film b | CR/% of film c |
|---|---|---|---|---|
| Film a: calcined at 560 °C; film b: calcined at 570 °C, and film c: calcined at 585 °C. | ||||
| 100 | 20 | 96 | 94 | 95 |
| 200 | 50 | 96 | 92 | 93 |
| 250 | 70 | 96 | 87 | 92 |
| 400 | 20 | 96 | 94 | 96 |
In Table 5, the main features of the oriented films treated at 560 °C, 570 °C and 585 °C are compared to crystalline non-oriented films.22 While the reversibility is high for all films, the here-studied films show improved coloration efficiency and insertion/desertion kinetics. Coloration and bleaching occur ca. twice as quickly as in the case of the crystalline oriented films treated at 570 °C. Two aspects come together in our case: first, the films are oriented with the orientation being more pronounced for the monoclinic part. Second, the size of the WO3 crystallites is ca. 7.5 nm for the orthorhombic structure which is significantly smaller than the films studied in ref. 22 (13 nm). Both aspects facilitate Li insertion: a smaller crystallite size shortens the mean ion diffusion path length and the orientational growth diminishes grain boundaries, thereby facilitating the diffusion of polarons into the crystal. Moreover, the growth along the (100) plane with its larger unit cell offers more space for the polarons to integrate into the crystal structure. However, with increasing annealing temperature, the characteristic time of insertion/desertion increases again, as seen from the film treated at 585 °C. This important result can be attributed to several effects. As shown by Rietveld analysis, the fraction of monoclinic WO3 is significantly higher for films treated at 570 °C. Faster kinetics for the 570 °C treated film thus demonstrate the advantage of a monoclinic oriented system. The lower kinetics of films treated at 585 °C can also be the consequence of a higher compaction of the film, i.e. the presence of larger grains due to coarsening at higher temperatures. Also, the mesopores collapse at higher temperatures, which makes diffusion of the ions from solution to the film more difficult. As a conclusion, oriented crystalline WO3 films with a small crystallite size show superior electrochromic characteristics with respect to coloration/bleaching in comparison to amorphous films or non-oriented crystalline films. The electrochromic performance of the WO3 films can therefore be mainly attributed to the orientation of the crystallites, since the porosity of the films is probably quite low. Mesoporous materials synthesized using C16mimCl usually have relatively small pores (3–5 nm24) and thus collapse easily upon heat treatment at elevated temperatures. Another important feature of the films presented here is their performance stability after insertion/desertion at elevated temperatures, where the initial properties of the films are retained.
4. Conclusions
In this work, the synthesis of WO3 films with preferred crystallographic orientation, applying EISA using C16mimCl, C16mimBr, CTAC and CTAB as surfactants is described. The important role played by the surfactant in this context is its ability to inhibit crystallization and direct the crystallization towards oriented WO3 at higher temperatures. In contrast to other transition metal oxides with a highly anisotropic unit cell, orientation of tungsten oxide films cannot be achieved by nonionic block copolymers. This observation indicates a stronger interaction between the (100) surface of WO3 and the ionic surfactant. With respect to application, the electrochromic properties, especially the coloration efficiency and the characteristic time of coloration/bleaching, are superior to recently reported mesoporous non-oriented WO3 films and exhibit good temperature and time stability. Moreover, the amorphous modification also exhibits good stability upon temperature changes and over time, which has not been observed yet. The good electrochemical performance of the amorphous films might be attributable to the higher annealing temperature and consequently a higher degree of condensation.Acknowledgements
The support of Gwyneth Schulz in preparing the manuscript is highly appreciated. B. M. Smarsly appreciates the support of Deutsche Forschungsgemeinschaft DFG (Bonn, Germany) within the priority program SPP 1708.Notes and references
- J. T. Hu, T. W. Odom and C. M. Lieber, Acc. Chem. Res., 1999, 32, 435–445 CrossRef CAS
.
- H. Yu, J. B. Li, R. A. Loomis, L. W. Wang and W. E. Buhro, Nat. Mater., 2003, 2, 517–520 CrossRef CAS PubMed
.
- S. Mann, Nature, 1993, 365, 499–505 CrossRef CAS PubMed
.
- M. Antonietti, M. Niederberger and B. Smarsly, Dalton Trans., 2008, 18–24 RSC
.
- T. X. Wang, H. Colfen and M. Antonietti, J. Am. Chem. Soc., 2005, 127, 3246–3247 CrossRef CAS PubMed
.
- S. H. Yu, H. Colfen and M. Antonietti, Adv. Mater., 2003, 15, 133–136 CrossRef CAS PubMed
.
- S. H. Yu, M. Antonietti, H. Colfen and M. Giersig, Angew. Chem., Int. Ed., 2002, 41, 2356–2360 CrossRef CAS
.
-
H. Colfen and M. Antonietti, Mesocrystal Systems, in Mesocrystals and Nonclassical Crystallization, John Wiley & Sons, Ltd, Chichester, UK, 2008 Search PubMed
.
- P. R. Willmott, Prog. Surf. Sci., 2004, 76, 163–217 CrossRef CAS PubMed
.
- Z. R. Zytkiewicz, D. Dobosz, Y. C. Liu and S. Dost, Cryst. Res. Technol., 2005, 40, 321–328 CrossRef CAS PubMed
.
- T. Brezesinski, M. Groenewolt, N. Pinna, H. Amenitsch, M. Antonietti and B. M. Smarsly, Adv. Mater., 2006, 18, 1827–1831 CrossRef CAS PubMed
.
- J. M. Wu, I. Djerdj, T. von Graberg and B. M. Smarsly, Beilstein J. Nanotechnol., 2012, 3, 123–133 CrossRef CAS PubMed
.
- T. Brezesinski, J. Wang, S. H. Tolbert and B. Dunn, Nat. Mater., 2010, 9, 146–151 CrossRef CAS PubMed
.
- M. Li, E. I. Altman, A. Posadas and C. H. Ahn, Surf. Sci., 2003, 542, 22–32 CrossRef CAS
.
- J. Svensson and C. G. Granqvist, Sol. Energy Mater., 1984, 11, 29–34 CrossRef CAS
.
- J. Svensson and C. G. Granqvist, Sol. Energy Mater., 1985, 12, 391–402 CrossRef CAS
.
- A. Azens, A. Hjelm, D. LeBellac, C. G. Granqvist, J. Barczynska, E. Pentjuss, J. Gabrusenoks and J. M. Wills, Solid State Ionics, 1996, 86–88, 943–948 CrossRef CAS
.
- J. Livage and D. Ganguli, Sol. Energy Mater. Sol. Cells, 2001, 68, 365–381 CrossRef CAS
.
- M. Deepa, T. K. Saxena, D. P. Singh, K. N. Sood and S. A. Agnihotry, Electrochim. Acta, 2006, 51, 1974–1989 CrossRef CAS PubMed
.
- T. Brezesinski, D. Fattakhova-Rohlfing, S. Sallard, M. Antonietti and B. M. Smarsly, Small, 2006, 2, 1203–1211 CrossRef CAS PubMed
.
- M. Deepa, A. K. Srivastava, K. N. Sood and S. A. Agnihotry, Nanotechnology, 2006, 17, 2625–2630 CrossRef CAS PubMed
.
- S. Sallard, T. Brezesinski and B. M. Smarsly, J. Phys. Chem. C, 2007, 111, 7200–7206 CAS
.
- M. Deepa, P. Singh, S. N. Sharma and S. A. Agnihotry, Sol. Energy Mater. Sol. Cells, 2006, 90, 2665–2682 CrossRef CAS PubMed
.
- T. W. Wang, H. Kaper, M. Antonietti and B. Smarsly, Langmuir, 2007, 23, 1489–1495 CrossRef CAS PubMed
.
-
J. Rodriguez-Carvajal, FULLPROF, CEA/Saclay, France, 2001 Search PubMed
.
- R. J. Hill and C. J. Howard, J. Appl. Crystallogr., 1987, 20, 467–474 CrossRef CAS
.
- K. Momma and F. Izumi, J. Appl. Crystallogr., 2011, 44, 1272–1276 CrossRef CAS
.
-
Practical Surface Analysis by Auger and X-ray Photoelectron Spectroscopy, ed. D. Briggs and M. P. Seah, John Wiley and Sons, Chichester, UK, 1983 Search PubMed
.
- D. A. Shirley, Phys. Rev. B: Solid State, 1972, 5, 4709–4714 CrossRef
.
-
J. F. Moulder, W. F. Stickle, P. E. Sobol and K. D. Bombon, Handbook of X-Ray Photoelectron Spectroscopy, Eden Prairie, MN, 1992 Search PubMed
.
- NIST XPS Database, National Institute of Standards and Technology, Gaithersburg, http://srdata.nist.gov/xps/.
- C. V. Ramana, S. Utsunomiya, R. C. Ewing, C. M. Julien and U. Becker, J. Phys. Chem. B, 2006, 110, 10430–10435 CrossRef CAS PubMed
.
- S. Sawada and G. C. Danielson, Phys. Rev., 1959, 113, 1008 CrossRef CAS
.
- D. Q. Zhang, S. L. Wang, J. Zhu, H. X. Li and Y. F. Lu, Appl. Catal., B, 2012, 123, 398–404 CrossRef PubMed
.
- M. M. Natile, F. Tomaello and A. Glisenti, Chem. Mater., 2006, 18, 3270–3280 CrossRef CAS
.
- T. J. Driscoll, L. D. Mc Cormick and W. C. Lederer, Surf. Sci., 1987, 187, 539–558 CrossRef CAS
.
- J. H. Choy, Y. I. Kim, J. B. Yoon and S. H. Choy, J. Mater. Chem., 2001, 11, 1506–1513 RSC
.
- S. K. Deb, Philos. Mag., 1973, 27, 801–822 CrossRef CAS PubMed
.
- R. Solarska, B. D. Alexander and J. Augustynski, J. Solid State Electrochem., 2004, 8, 748–756 CrossRef CAS
.
- P. K. Biswas, N. C. Pramanik, M. K. Mahapatra, D. Ganguli and J. Livage, Mater. Lett., 2003, 57, 4429–4432 CrossRef CAS
.
- B. Munro, S. Kramer, P. Zapp and H. Krug, J. Sol-Gel Sci. Technol., 1998, 13, 673–678 CrossRef CAS
.
Footnote |
| † Electronic supplementary information (ESI) available: Rietveld refinement results, 2D XRD data taken in grazing incidence geometry of a WO3 film treated at 575 °C and temperature and time dependence of the rate of reduction. See DOI: 10.1039/c5cp01869b |
| This journal is © the Owner Societies 2015 |

