 Open Access Article
Creative Commons Attribution 3.0 Unported Licence
Charge transfer in MOH(H2O)+ (M = Mn, Fe, Co, Ni, Cu, Zn) complexes revealed by vibrational spectroscopy of mass-selected ions
Brett M.
Marsh
,
Jia
Zhou
and
Etienne
Garand
*
Department of Chemistry, University of Wisconsin-Madison, 1101 University Avenue, Madison, WI 53706, USA. E-mail: egarand@chem.wisc.edu
First published on 31st March 2015
Abstract
Charge transfer between a metal and its ligand is fundamental for the structure and reactivity of a metal complex as it directly dictates the distribution of electron density within the complex. To better understand such charge transfer interactions, we studied the vibrational spectra of mass-selected MOH(H2O)+ (M = Mn, Fe, Co, Ni, Cu, or Zn) complexes, acquired using cryogenic ion infrared predissociation spectroscopy. We find that there is a partial charge transfer from the hydroxide anion to the metal center for these first-row transition metals, the extent of which is in the order of Mn < Fe < Co < Ni < Cu > Zn, dictated by the 2nd ionization energy of the bare metal. This gradual change across the metal series points to the complexity in the electronic structures of these transition metal complexes. Interestingly, the hydroxide ligand in these complexes can serves as a sensitive in situ probe of this charge transfer. Its vibrational frequency varies by >150 cm−1 for different metal species, and it is dependent on the electric field produced by the charged metal center. This dramatic vibrational Stark shift is further modulated by the charge present on the hydroxide itself, providing a well-defined relationship between the observed hydroxide frequency and the effective electric field.
I. Introduction
Charge transfer is a fundamental process present in metal–ligand interactions.1–5 While metal-centered complexes are typically designated by their formal charge states, it is often unclear how the electrons are delocalized within the complex.6,7 On the other hand, the functionality of an active site, whether in a catalyst or an enzyme, depends heavily on the exact electronic structure present.8–10 Therefore a better understanding of the driving forces behind the electron transfer process, as well as an in situ sensitive probe of the charge states present in a complex, would provide deeper insights into this vital metal–ligand interaction. Here, we use infrared predissociation spectroscopy of mass-selected MOH(H2O)+ (M = Mn, Fe, Co, Ni, Cu, Zn) complexes to directly probe the charge transfer in these species. We find that the vibrational frequency of the hydroxide ligand is extremely sensitive to the electric field generated by the charge on the metal center.The M2+OH− ion pair, where the positively charged metal center directly interacts with the negatively charged hydroxide ligand, serves as a relatively simple example of metal–ligand charge transfer interaction. Recently, our group11 probed the vibrational structure of the microsolvated CuOH+ clusters12 in an effort to better understand a new group of self-assembling copper-centered water oxidation catalysts.13–16 Shortly after, Johnson et al.17 reported the gas phase IR spectra of solvated MgOH+ and CaOH+ clusters. Surprisingly, these two studies showed dramatic differences between the vibrational spectrum of the alkaline earth and the copper complexes. Most notably, the vibrational frequency of the hydroxide (OH−) moiety in CaOH(H2O)+ and MgOH(H2O)+ was found to be blueshifted with respect to the free hydroxide frequency by nearly 200 cm−1 and 300 cm−1, respectively, while the same hydroxide vibration in CuOH(H2O)+ is blueshifted by only 35 cm−1. Additionally, the Mg and Ca complexes show a redshift in the hydroxide vibration with increasing number of water molecules around the metal center, while the Cu complex shows the exact opposite trend. These results highlight the possibility that the electronic structure of these complexes involve more than a simple M2+OH− contact ion pair configuration.
This prompted us to use cryogenic ion vibrational spectroscopy to systematically investigate the late first-row transition metal complexes of the form MOH(H2O)+ (M = Mn, Fe, Co, Ni, Cu, or Zn). We focus on the OH stretching region to reveal the metal-dependent trends in the frequencies of the hydroxide and H2O stretch vibrations. The use of D2 tagging affords cryogenically cooled complexes, yielding well-resolved vibrational features for facile assignment as well as direct comparison with electronic structure calculations. We find that the extent of charge transfer between the hydroxide ligand and the metal center depends highly on the metal species. Furthermore, the main driver of the hydroxide vibrational frequency is the modulation of the vibrational Stark effect induced by the charged metal center.
II. Experimental and computational details
The vibrational spectra of D2-tagged MOH(H2O)+ (M = Mn, Fe, Co, Ni, Cu, Zn) complexes were acquired using a homebuilt cryogenic ion photofragment spectrometer,18 described in detail previously.11 The ions of interest were generated via electrospray ionization of ∼1 mM aqueous solutions of the corresponding metal sulfates. The ions were guided by hexapole ion guides through three differentially pumped stages and collected in a 3D quadrupole ion trap (Jordan TOF) attached to a closed-cycle helium cryostat (Sumitomo) held at 10 K by a resistive heater.19 Buffer gas, consisting of 10% D2 in a balance of helium, was pulsed into the ion trap for collisional cooling and formation of D2 adducts. The weakly bound D2 tag serves as the messenger for vibrational predissociation spectroscopy. After a 90 ms delay allowing for the evacuation of the buffer gas, the cooled ions were extracted from the trap into a time-of-flight mass spectrometer. The species corresponding to the m/z of the MOH(H2O)+·D2 ions were isolated using a mass gate and intersected with the output of a Nd:YAG pumped tunable OPO/OPA laser system (Laservision). When the IR photon energy is resonant with a vibrational transition of the complex, the absorption of a single photon is sufficient to induce the evaporation of the weakly bound D2 tag. Photofragment ions corresponding to the bare MOH(H2O)+ species were then separated from the parent ions in a two-stage reflectron. The resulting photofragment intensity as a function of the photon energy yielded linear IR spectra. The final intensities were normalized to the laser output power.To aid the analysis of the experimental spectra, electronic structure calculations were performed using the Gaussian 09 computational package.20 Geometry optimizations, with Gaussian 09 standard tight convergence criteria, and harmonic frequency calculations were carried out at the cam-B3LYP/def2TZVP level of theory. Previous works have shown that the cam-B3LYP functional yields accurate binding energies21 and vibrational spectra11 for CuOH(H2O)+. For comparison to the experimental vibrational spectrum, the harmonic frequencies are scaled by a factor of 0.955. The atomic charges in these complexes were obtained using natural population analysis22 with the NBO 6 program.23
III. Results and analysis
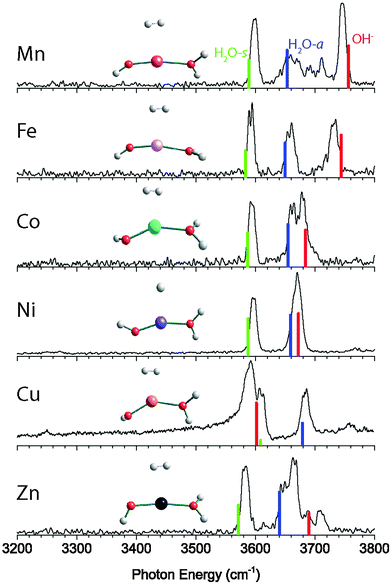
The vibrational predissociation spectra of MOH(H2O)+·D2 (M = Mn, Fe, Co, Ni, Cu, Zn) complexes in the 3200–3800 cm−1 region are shown in Fig. 1. The spectrum of CuOH(H2O)+·D2 has been reported and analyzed previously,11 but is reproduced here for comparison. In this spectral region there are two or three intense features present in each spectrum. Specifically, the MnOH(H2O)+·D2 spectrum displays two sharp features at 3598 cm−1 and 3745 cm−1 while a third broad feature extends from 3634 cm−1 to 3720 cm−1. This feature has resolved maxima at 3654 cm−1, 3692 cm−1 and 3711 cm−1. The spectrum of the Fe complex has three sharp features at 3593 cm−1, 3659 cm−1 and 3733 cm−1. The spectrum of Co complex is similar, with three peaks at 3593 cm−1, 3661 cm−1, and 3680 cm−1. On the other hand, the NiOH(H2O)+·D2 spectrum shows only two features, one narrow peak at 3597 cm−1 and a slightly broader feature at 3671 cm−1. The spectrum of the Cu complex again shows three features at 3590 cm−1, 3612 cm−1 and 3684 cm−1. Finally, the ZnOH(H2O)+·D2 spectrum shows three strong features at 3582 cm−1, 3646 cm−1, and 3664 cm−1 as well as two additional small peaks at 3689 cm−1 and 3709 cm−1.The calculated lowest energy structure and corresponding vibrational spectrum for each complex are also shown in Fig. 1, and the structural parameters are summarized in Table 1. For each complex, we considered several different spin multiplicities. We found that the ground states have the same multiplicity as the corresponding bare M2+ ion,24 namely sextet for MnOH(H2O)+·D2, quintet for FeOH(H2O)+·D2, quartet for CoOH(H2O)+·D2, triplet for NiOH(H2O)+·D2, doublet for CuOH(H2O)+·D2, and singlet for ZnOH(H2O)+·D2. For the bare MOH(H2O)+ complexes, all the calculated ground state structures have a nearly linear O–M–O geometry. Upon interaction with the D2 tag, which binds to the metal center, the O–M–O bond distorts to a bent geometry, as shown in Fig. 1. The extent of the distortion varies depending on the metal species, with the Cu complex being the most bent and the Zn complex closest to linear.
| MOH(H2O)+·D2 | O–M–O angle | M–O–H angle | M–OH bond (Å) | M–OH2 bond (Å) | O–H bond (Å) | M charge qM (e) | OH charge qOH (e) | H2O charge (e) |
|---|---|---|---|---|---|---|---|---|
| MgOH(H2O)+·D2 | 156.1 | 164.6 | 1.723 | 1.974 | 0.951 | 1.84 | −0.90 | 0.04 |
| CaOH(H2O)+·D2 | 101.4 | 179.2 | 1.930 | 2.331 | 0.956 | 1.84 | −0.86 | 0.02 |
| MnOH(H2O)+·D2 | 169.1 | 150.7 | 1.758 | 2.058 | 0.957 | 1.54 | −0.64 | 0.07 |
| FeOH(H2O)+·D2 | 165.9 | 151.6 | 1.717 | 2.011 | 0.958 | 1.46 | −0.58 | 0.08 |
| CoOH(H2O)+·D2 | 151.4 | 134.3 | 1.723 | 1.978 | 0.962 | 1.41 | −0.55 | 0.08 |
| NiOH(H2O)+·D2 | 159.1 | 136.0 | 1.695 | 1.937 | 0.963 | 1.31 | −0.47 | 0.09 |
| CuOH(H2O)+·D2 | 142.2 | 127.5 | 1.754 | 1.954 | 0.969 | 1.20 | −0.32 | 0.07 |
| ZnOH(H2O)+·D2 | 171.8 | 120.5 | 1.740 | 1.919 | 0.962 | 1.61 | −0.72 | 0.08 |
The calculated vibrational frequencies of the lowest energy structure of the Mn complex has a good agreement with the experimental spectrum. This yields the assignment of the peak at 3598 cm−1 to the H2O symmetric stretch and the peak at 3745 cm−1 to the hydroxide stretch, which leaves the broad feature at 3634–3720 cm−1 to be assigned as the H2O antisymmetric stretch. The harmonic calculation does not reproduce the complexity of this feature, but the calculated frequency is close to the lowest resolved maxima at 3654 cm−1. The substantial broadening of the H2O antisymmetric stretch can be attributed to the coupling of this vibration with the hindered internal rotation of the water ligand. Such coupling has been observed previously for other M–H2O type of complexes.25–28 The calculated barrier for the water rotation in the MnOH(H2O)+·D2 complex is only ∼15 cm−1, making it feasible to give rise to the progression observed here.
The calculated spectrum for the FeOH(H2O)+·D2 and CoOH(H2O)+·D2 complexes have excellent agreement with the experimental spectrum. In both cases, the two lower frequency peaks are assigned to the H2O symmetric and antisymmetric stretch while the highest frequency peak is assigned to the hydroxide stretch. Unlike the Mn complex, the antisymmetric H2O stretch of these two species remains a sharp peak, indicating higher H2O hindered rotor barriers. For the NiOH(H2O)+·D2 complex, the experimental spectrum shows only two features in the OH stretch region. Calculation indicates that this is because the hydroxide stretch and the H2O antisymmetric stretch are nearly degenerate, and they both appear under the slightly broader feature at 3670 cm−1. The lower frequency feature at 3597 cm−1 is then assigned to the H2O symmetric stretch mode. The spectrum of the CuOH(H2O)+·D2 species has been assigned previously.11 In contrast to all the other species considered here, the calculation predicts that the hydroxide frequency is lower in frequency than the H2O stretch modes. The peak at 3590 cm−1 is assigned to the hydroxide stretch and the peaks at 3608 cm−1 and 3680 cm−1 are assigned to the H2O symmetric and antisymmetric stretches, respectively.
Finally, we consider the only closed-shell singlet species in the series, the ZnOH(H2O)+·D2 complex. The calculated spectrum, shown in Fig. 1, allows us to assign the lowest frequency feature at 3582 cm−1 to the H2O symmetric mode. The assignment of the remaining features is more difficult. The complexity in the 3600–3750 cm−1 region is akin to the spectrum of the Mn complex, and is likely due to a similar coupling of the H2O internal rotation with the antisymmetric stretch. Similar to the Mn complex, the structure of ZnOH(H2O)+·D2 is quasi-linear with a calculated H2O rotational barrier of only 14 cm−1. Therefore, we tentatively assign the feature at 3646 cm−1 and the two small peaks at 3689 cm−1 and 3709 cm−1 to the H2O antisymmetric stretch coupled to the H2O internal rotation. These two small peaks are at similar frequencies as the partially resolved features in the hindered rotor progression of the Mn complex. This assignment leaves the peak at 3664 cm−1 to be the hydroxide stretching mode. The discrepancy between the calculated and experimental frequencies of this mode is 25 cm−1, significantly larger than those of the other complexes (<12 cm−1). We note that although the calculated hydroxide frequency coincides with the small 3689 cm−1 feature, that assignment would leave the much more intense 3664 cm−1 peak unassignable. Furthermore, calculations yielded similar vibrational frequencies (within ∼10 cm−1) for all the low-lying conformers, making it unlikely that the observed spectral complexity is due to the presence of multiple conformers.
IV. Discussion
Fig. 2 highlights the progression of the hydroxide and H2O stretch vibrational frequencies as a function of the metal species. The plot also includes values for the Mg and Ca complexes reported by Johnson et al.17 Note that the CaOH(H2O)+·D2 complex has a calculated O–M–O angle of ∼100°, making its geometry distinctively different than the other complexes. We can see from Fig. 2 that the hydroxide frequency is particularly sensitive to the nature of the metal center, shifting from a high value of 3856 cm−1 in MgOH(H2O)+·D2 to a low value of 3590 cm−1 in CuOH(H2O)+·D2. On the other hand, the H2O stretch frequencies display a much more modest dependence on the metal center, varying by no more than 43 cm−1 for all the species considered here. Interestingly, for the transition metal species, the water frequencies generally blueshift as the hydroxide vibration redshifts.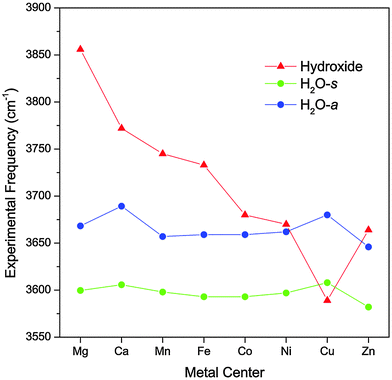 | ||
| Fig. 2 Experimental vibrational frequencies of the MOH(H2O)+·D2 complexes as a function of the metal species. The values for the Mg and Ca complexes are obtained from ref. 17. | ||
The observed trend in the hydroxide frequency is consistent with the Irving–Williams series which ranks the stability of complexes containing high-spin metal dications in the order of Mn < Fe < Co < Ni < Cu > Zn.29,30 The ordering of this series is attributed to the 2nd ionization energies of the metal center, which should also dictate the extent of charge transfer between the hydroxide and the metal center. Fig. 3 shows that the observed hydroxide frequencies indeed has a clear linear dependence on the 2nd ionization energies24 of the transition metal center. This relationship points to electron transfer from the hydroxide to the metal center as the main cause for the observed frequency shift. However, we note that this trend does not hold well for the two alkaline earth metal species.
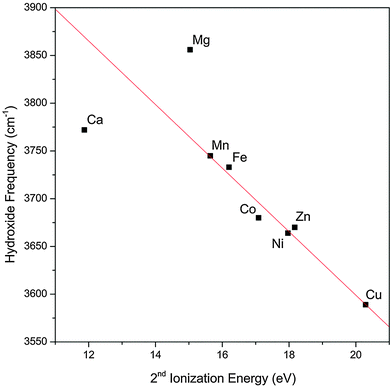 | ||
| Fig. 3 Experimental hydroxide vibrational frequency in the MOH(H2O)+·D2 complexes as a function of the 2nd ionization energy of the bare metal. The experimental values for the hydroxide frequency of the Mg and Ca complexes are obtained from ref. 17. The red line is a linear fit of the data points excluding the Mg and Ca values. | ||
The good agreement between the calculated and the experimental vibrational spectra shows that the cam-B3LYP method is able to reproduce the observed trends. We therefore use the same level of theory to perform natural population analysis (NPA) on the MOH(H2O)+·D2 complexes, taking a closer look at how the electron densities are distributed within these clusters. The localized NPA charges on the metal center, hydroxide and H2O ligand for each complex are listed in Table 1. The positive charge on the metal center decreases from +1.54e in Mn to +1.20e in Cu and then increases again to +1.61e in Zn. This change is mirrored by the negative charge on the hydroxide fragment which decreases from −0.64e in Mn to −0.32e in Cu and then increases again to −0.72e in Zn. On the other hand, the charge on H2O is fairly constant, varying only between 0.07e and 0.09e for the different metal species. Table 1 also lists the NPA charges for the Mg and Ca complexes which shows that, as expected, these two species are much closer to a M2+OH− contact ion pair with a charge of +1.84e on both alkaline earth metal centers.
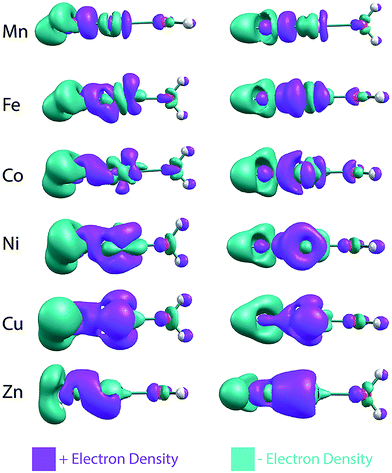
The NPA charges indicate that, across the late first-row transition metals, there is a gradual change in the electron transfer between the metal and hydroxide. To visualize this, electron density difference plots (isovalue = 0.007), obtained by subtracting the SCF densities of the individual OH− and [M–OH2]2+ fragments from the entire MOH(H2O)+ complex, are shown in Fig. 4. For the sake of simplicity these plots were generated without the D2 tag. Going from Mn to Cu, these SCF difference plots indicate that there is increasing electron density moving from the hydroxide to both the metal center and the M–OH bond. For the Mn complex, most of the electron density goes into the M–OH bond. This is true for the Fe complex as well, but it also gains electron density in the metal d-orbitals. The increasing gain of electron density in the metal d-orbitals continues for Co, Ni and Cu complexes, which shows concurrent increase in electron withdrawal from the hydroxide moiety. For the Zn complex, the electron density moves into the metal s orbital, consistent with Zn having a filled 3d shell. These SCF difference plots also show the rearrangement of the electron densities upon M–OH interaction, as indicated, for example, by the changes in the d-orbital occupation. This significant reorganization as well as the gradual charge transfer highlights the complexity of the electronic structures in these transition metal complexes.
From the above discussion, it appears that the electron transfer from the hydroxide to the metal center should be responsible for the observed variation in hydroxide frequency. However, varying the partial charge on the hydroxide alone cannot account for the >150 cm−1 shift in its frequency. Specifically, the free hydroxyl radical has a vibrational frequency31 of 3570 cm−1 while the free hydroxide anion has a slightly blueshifted frequency32 of 3556 cm−1. The experimental hydroxide frequencies for all the species considered here lie above those values, making the partial charge on the hydroxide seemingly irrelevant. The insensitivity of the hydroxide frequency to its own charge is consistent with the fact that the extra electron on the hydroxide anion occupies a non-bonding orbital, and therefore has minimal effect on the O–H bond length and frequency.
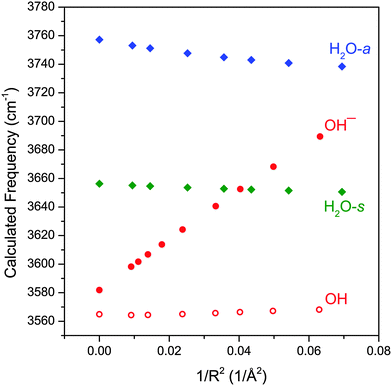
There is an additional way in which the charge transfer can affect the hydroxide frequency. The metal center, with its varying degree of localized charge, can exert a strong electric field on the surrounding ligands and induce a vibrational Stark shift.33–39 For example, the vibrational frequency of the free OH stretch in ion-containing water clusters have been observed to be modulated by the charge of the central ion.37,38 In order to explore this further, we performed CCSD/aug-cc-pVTZ calculations of water, hydroxide anion and hydroxyl radical in the presence of a +1e point charge. We choose this particular method over DFT because it generally produces more accurate dipole moments and polarizabilities for these small molecules. For these calculations, the point charge was placed on the O atom side of the molecule in a co-linear fashion and the molecular geometry was allowed to relax. The calculated harmonic vibrational frequencies as a function of 1/R2, where R is the distance from the point charge to the middle of the O–H bond, is plotted in Fig. 5. This rather simplified picture does qualitatively reproduce several of the observed experimental trends. First, the hydroxide anion shows the most sensitivity to the electric field generated by the point charge, with the change in its frequency being more than five times greater than that of H2O. The hydroxyl radical, on the other hand, is almost completely insensitive to the electric field. Also reproduced here is the opposing trend in the hydroxide and H2O frequencies as a function of the electric field. As the electric field strength increases, the hydroxide stretch blueshifts whereas both H2O stretch redshifts. This behavior of the hydroxide and water frequencies as a function of electric field are in agreement with the more detailed theoretical studies of Hermansson.40–43
Fig. 5 shows that the vibrational frequency of the hydroxide anion varies nearly linearly with the field strength, in accordance with previous vibrational Stark shift studies.33,35 In order to assess the effect of the electric field on the hydroxide frequency in the MOH(H2O)+ complexes, we must take into account two effects of the M–OH charge transfer. First, increasing electron transfer reduces the effective partial charge on the metal center (qM), and accordingly reduces the electric field which is proportional to qM/R2. At the same time, decreasing charge on the hydroxide ligand also lowers the Stark tuning rate (Stark tuning rate is effectively the slope of Fig. 5) to nearly zero as the hydroxide anion becomes a hydroxyl radical. Therefore, as the electric field from the metal center weakens, the hydroxide ligand concurrently becomes less sensitive to the field. If we assume that the Stark tuning rate is proportional to the partial charge on the hydroxide (qOH) then the hydroxide frequency shift should be proportional to:
| Δω ∝ qOHqM/R2 |
Fig. 6 plots the hydroxide frequency of all the MOH(H2O)+·D2 complexes considered here as a function of qOHqM/R2. One can clearly see that as the electron transfer increases and the effective electric field from the metal center weakens, the observed hydroxide frequency correspondingly redshifts, going towards the free hydroxyl radical frequency. The linear dependence indicates that this frequency shift is mainly due to the modulation of the vibrational Stark shift as a function of the charge transfer between the hydroxide ligand and the metal center. The Mg and Ca complexes also follow the same trend and the difference in their hydroxide frequencies can be explained by their different M–OH bond lengths. Specifically, the Ca complex has a much longer M–OH bond, and its hydroxide ligand effectively experiences a weaker field from the same +1.84e charge on the metal. For the transition metals, the M–OH bonds all have similar length, and the differences in the hydroxide frequency can be mostly accounted for by the different amount of charge transfer.
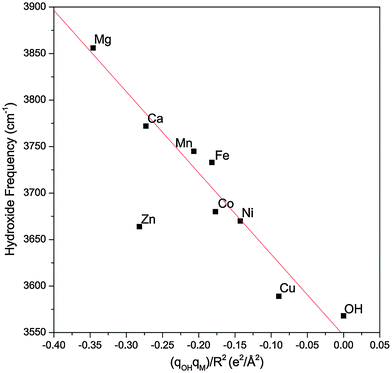 | ||
| Fig. 6 The experimental hydroxide frequency as a function of the field induced by the metal center (qM/R2) multiplied by the charge present on the hydroxide (qOH). The gas phase vibrational frequency of the hydroxyl radical is also included. The experimental values for the hydroxide frequency of the Mg and Ca complexes are obtained from ref. 17. The red line is a linear fit of the data points excluding the Zn complex. | ||
The Zn complex is the only species that falls outside the linear trend in Fig. 6. There are two possible explanations for this discrepancy. First, the calculated hydroxide frequency for the Zn complex shows the largest deviation from the experimental value, indicating that DFT possibly has a larger error in calculating the amount of charge transfer in this complex. This is supported by the fact that Zn has a similar 2nd ionization energy as Ni and their respective complexes also have similar experimental hydroxide frequencies. One would therefore expect a similar amount of charge transfer for both species, but DFT calculation gives much less charge transfer for the Zn complex. Another possibility for the different behavior of the Zn complex is the involvement of the 4s orbital in the charge transfer, as highlighted in Fig. 4. This different electron distribution might lead to a different effective electric field than the other species. In the case of the Mg and Ca complexes, since little charge transfer occurs, this may not play as much of a role. Lastly, we note that our analysis relies on the calculated atomic charges which varies depending on the method used. The NPA approach used here tends to be more reliable for ionic compounds22 such as the metal hydroxide complexes, but we also found a similar overall trend using the Mulliken charges.
V. Conclusion
The vibrational spectra of mass-selected MOH(H2O)+·D2 (M = Mn, Fe, Co, Ni, Cu, or Zn) complexes, acquired using cryogenic ion infrared predissociation spectroscopy, are presented. This series of transition metals bridge the gap between the Mg and Ca complexes studied by Johnson et al.17 and the Cu complex studied previously in our group.11 The evolution of the vibrational frequencies of the hydroxide and water ligands as a function of the metal center sheds light on the gradual charge transfer behavior of this series of metals. The interaction between the hydroxide ligand and the metal center was found to be more ionic in the Mg, Ca, and Mn complexes, while becoming more covalent in character for the Fe, Co, Ni and Cu complexes. The hydroxide vibration was found to be highly sensitive to the electric field generated by the charge on the metal center, giving rise to abnormally high frequencies for this moiety. Two correlated effects, charge on the metal center and electron density on the hydroxide ligand, yielded a linear dependence of the hydroxide frequency on qOHqM/R2. This description of M–OH interaction provides a framework for future investigation of charge transfer and vibrational spectroscopy of these metal complexes. Additionally, the well-resolved experimental spectra can serve as a benchmark for electronic structure calculations to provide better description of these complex transition metal species.Acknowledgements
This material is based upon work supported by the National Science Foundation under grant number CHE-1454086. The computational resources used in this work are supported by the National Science Foundation Grant CHE-0840494.References
- K. Ando, J. Phys. Chem. B, 2008, 112, 250–256 CrossRef CAS PubMed.
- A. Hoffmann, S. Binder, A. Jesser, R. Haase, U. Flörke, M. Gnida, M. Salomone Stagni, W. Meyer-Klaucke, B. Lebsanft, L. E. Grünig, S. Schneider, M. Hashemi, A. Goos, A. Wetzel, M. Rübhausen and S. Herres-Pawlis, Angew. Chem., Int. Ed., 2014, 53, 299–304 CrossRef CAS PubMed.
- M. Y. M. Pau, M. I. Davis, A. M. Orville, J. D. Lipscomb and E. I. Solomon, J. Am. Chem. Soc., 2007, 129, 1944–1958 CrossRef CAS PubMed.
- J. Roithova and D. Schroder, Coord. Chem. Rev., 2009, 253, 666–677 CrossRef CAS PubMed.
- J. Šima and J. Makáňová, Coord. Chem. Rev., 1997, 160, 161–189 CrossRef.
- S. Bonhommeau, N. Pontius, S. Cobo, L. Salmon, F. M. F. de Groot, G. Molnar, A. Bousseksou, H. A. Durr and W. Eberhardt, Phys. Chem. Chem. Phys., 2008, 10, 5882–5889 RSC.
- T. Petrenko, K. Ray, K. E. Wieghardt and F. Neese, J. Am. Chem. Soc., 2006, 128, 4422–4436 CrossRef CAS PubMed.
- L. S. Levitt, Science, 1954, 120, 33–35 CAS.
- J. Rittle and M. T. Green, Science, 2010, 330, 933–937 CrossRef CAS PubMed.
- X. Shan and L. Que Jr, J. Inorg. Biochem., 2006, 100, 421–433 CrossRef CAS PubMed.
- B. M. Marsh, J. Zhou and E. Garand, J. Phys. Chem. A, 2014, 118, 2063–2071 CrossRef CAS PubMed.
- A. F. Sweeney, J. T. O'Brien, E. R. Williams and P. B. Armentrout, Int. J. Mass Spectrom., 2014 DOI:10.1016/j.ijms.2014.08.037.
- S. M. Barnett, K. I. Goldberg and J. M. Mayer, Nat. Chem., 2012, 4, 498–502 CrossRef CAS PubMed.
- Z. F. Chen, P. Kang, M. T. Zhang, B. R. Stoner and T. J. Meyer, Energy Environ. Sci., 2013, 6, 813–817 CAS.
- Z. F. Chen and T. J. Meyer, Angew. Chem., Int. Ed., 2013, 52, 700–703 CrossRef CAS PubMed.
- M. T. Zhang, Z. F. Chen, P. Kang and T. J. Meyer, J. Am. Chem. Soc., 2013, 135, 2048–2051 CrossRef CAS PubMed.
- C. J. Johnson, L. C. Dzugan, A. B. Wolk, C. M. Leavitt, J. A. Fournier, A. B. McCoy and M. A. Johnson, J. Phys. Chem. A, 2014, 118, 7590–7597 CrossRef CAS PubMed.
- M. Z. Kamrath, R. A. Relph, T. L. Guasco, C. M. Leavitt and M. A. Johnson, Int. J. Mass Spectrom., 2011, 300, 91–98 CrossRef CAS PubMed.
- X. B. Wang and L. S. Wang, Rev. Sci. Instrum., 2008, 79, 073108 CrossRef PubMed.
- M. J. Frisch, G. W. Trucks, H. B. Schlegel, G. E. Scuseria, M. A. Robb, J. R. Cheeseman, G. Scalmani, V. Barone, B. Mennucci, G. A. Petersson, H. Nakatsuji, M. Caricato, X. Li, H. P. Hratchian, A. F. Izmaylov, J. Bloino, G. Zheng, J. L. Sonnenberg, M. Hada, M. Ehara, K. Toyota, R. Fukuda, J. Hasegawa, M. Ishida, T. Nakajima, Y. Honda, O. Kitao, H. Nakai, T. Vreven, J. A. Montgomery, Jr., J. E. Peralta, F. Ogliaro, M. Bearpark, J. J. Heyd, E. Brothers, K. N. Kudin, V. N. Staroverov, R. Kobayashi, J. Normand, K. Raghavachari, A. Rendell, J. C. Burant, S. S. Iyengar, J. Tomasi, M. Cossi, N. Rega, N. J. Millam, M. Klene, J. E. Knox, J. B. Cross, V. Bakken, C. Adamo, J. Jaramillo, R. Gomperts, R. E. Stratmann, O. Yazyev, A. J. Austin, R. Cammi, C. Pomelli, J. W. Ochterski, R. L. Martin, K. Morokuma, V. G. Zakrzewski, G. A. Voth, P. Salvador, J. J. Dannenberg, S. Dapprich, A. D. Daniels, Ö. Farkas, J. B. Foresman, J. V. Ortiz, J. Cioslowski and D. J. Fox, Gaussian 09, Gaussian, Inc., Wallingford, CT, 2009 Search PubMed.
- A. F. Sweeney and P. B. Armentrout, J. Phys. Chem. A, 2014, 118, 10210–10222 CrossRef CAS PubMed.
- A. E. Reed, R. B. Weinstock and F. Weinhold, J. Chem. Phys., 1985, 83, 735–746 CrossRef CAS PubMed.
- E. D. Glendening, J. K. Badenhoop, A. E. Reed, J. E. Carpenter, J. A. Bohmann, C. M. Morales, C. R. Landis and F. Weinhold, NBO 6.0, Theoretical Chemistry Institute, University of Wisconsin, Madison, 2013 Search PubMed.
- A. Kramida, Y. Ralchenko, J. Reader and NIST_ASD_Team, NIST Atomic Spectra Database (ver. 5.2), National Institute of Standards and Technology, Gaithersburg, MD, 2014 Search PubMed.
- P. D. Carnegie, B. Bandyopadhyay and M. A. Duncan, J. Chem. Phys., 2011, 134, 014302 CrossRef CAS PubMed.
- A. L. Nicely, D. J. Miller and J. M. Lisy, J. Mol. Spectrosc., 2009, 257, 157–163 CrossRef CAS PubMed.
- T. D. Vaden, B. Forinash and J. M. Lisy, J. Chem. Phys., 2002, 117, 4628–4631 CrossRef CAS PubMed.
- N. R. Walker, R. S. Walters, E. D. Pillai and M. A. Duncan, J. Chem. Phys., 2003, 119, 10471–10474 CrossRef CAS PubMed.
- S. I. Gorelsky, L. Basumallick, J. Vura-Weis, R. Sarangi, K. O. Hodgson, B. Hedman, K. Fujisawa and E. I. Solomon, Inorg. Chem., 2005, 44, 4947–4960 CrossRef CAS PubMed.
- H. Irving and R. J. P. Williams, J. Chem. Soc., 1953, 3192–3210 RSC.
- J. P. Maillard, J. Chauville and A. W. Mantz, J. Mol. Spectrosc., 1976, 63, 120–141 CrossRef CAS.
- J. C. Owrutsky, N. H. Rosenbaum, L. M. Tack and R. J. Saykally, J. Chem. Phys., 1985, 83, 5338–5339 CrossRef CAS PubMed.
- S. S. Andrews and S. G. Boxer, J. Phys. Chem. A, 2000, 104, 11853–11863 CrossRef CAS.
- S. G. Boxer, J. Phys. Chem. B, 2009, 113, 2972–2983 CrossRef CAS.
- S. H. Brewer and S. Franzen, J. Chem. Phys., 2003, 119, 851–858 CrossRef CAS PubMed.
- T. Mani, D. C. Grills and J. R. Miller, J. Am. Chem. Soc., 2015, 137, 1136–1140 CrossRef CAS PubMed.
- J. T. O'Brien and E. R. Williams, J. Am. Chem. Soc., 2012, 134, 10228–10236 CrossRef PubMed.
- J. S. Prell, J. T. O'Brien and E. R. Williams, J. Am. Chem. Soc., 2011, 133, 4810–4818 CrossRef CAS PubMed.
- D. M. Walker, R. Wang and L. J. Webb, Phys. Chem. Chem. Phys., 2014, 16, 20047–20060 RSC.
- K. Hermansson, Int. J. Quantum Chem., 1993, 45, 747–758 CrossRef CAS PubMed.
- M. M. Probst and K. Hermansson, J. Chem. Phys., 1992, 96, 8995–9004 CrossRef CAS PubMed.
- K. Hermansson, J. Chem. Phys., 1991, 95, 3578–3588 CrossRef CAS PubMed.
- K. Hermansson, Chem. Phys. Lett., 1995, 233, 376–382 CrossRef CAS.
| This journal is © the Owner Societies 2015 |

