 Open Access Article
Creative Commons Attribution 3.0 Unported Licence
Molecular and ionic diffusion in aqueous – deep eutectic solvent mixtures: probing inter-molecular interactions using PFG NMR
Carmine
D’Agostino
*a,
Lynn F.
Gladden
a,
Mick D.
Mantle
a,
Andrew P.
Abbott
*b,
Essa, I.
Ahmed
b,
Azhar Y. M.
Al-Murshedi
b and
Robert C.
Harris
b
aDepartment of Chemical Engineering and Biotechnology, University of Cambridge, Pembroke Street, Cambridge CB2 3RA, UK. E-mail: cd419@hermes.cam.ac.uk
bDepartment of Chemistry, University of Leicester, Leicester LE1 7RH, UK. E-mail: apa1@le.ac.uk
First published on 15th May 2015
Abstract
Pulsed field gradient (PFG) NMR has been used to probe self-diffusion of molecular and ionic species in aqueous mixtures of choline chloride (ChCl) based deep eutectic solvents (DESs), in order to elucidate the effect of water on motion and inter-molecular interactions between the different species in the mixtures, namely the Ch+ cation and hydrogen bond donor (HBD). The results reveal an interesting and complex behaviour of such mixtures at a molecular level. In general, it is observed that the hydroxyl protons (1H) of Ch+ and the hydrogen bond donor have diffusion coefficients significantly different from those measured for their parent molecules when water is added. This indicates a clear and significant change in inter-molecular interactions. In aqueous Ethaline, the hydroxyl species of Ch+ and HBD show a stronger interaction with water as water is added to the system. In the case of Glyceline, water has little effect on both hydroxyl proton diffusion of Ch+ and HBD. In Reline, it is likely that water allows the formation of small amounts of ammonium hydroxide. The most surprising observation is from the self-diffusion of water, which is considerably higher that expected from a homogeneous liquid. This leads to the conclusion that Reline and Glyceline form mixtures that are inhomogeneous at a microscopic level despite the hydrophilicity of the salt and HBD. This work shows that PFG NMR is a powerful tool to elucidate both molecular dynamics and inter-molecular interactions in complex liquid mixtures, such as the aqueous DES mixtures.
Introduction
Deep Eutectic Solvents (DES) are mixtures of quaternary ammonium salts and hydrogen bond donors such as amides and polyols, having properties which are analogous to ionic liquids. The interaction between the two species leads to a lowering of the melting point and the formation of a eutectic. DESs are attracting considerable attention in many applications such as catalysts,1–3 solvents,4–6 electro-plating,7 purification media8 and others.9,10In many of these applications, the addition of water has little effect upon the chemical properties but significantly improves the mass transport characteristics of the liquids. In the applications listed above water is often added to improve conductivity and aid filtration; the amount of water added often being chosen empirically It has been empirically noted that DESs change their properties to those of ionic solutions when between 5 and 10 wt% water has been added.11 The addition of water introduces a second HBD and the relative interactions between the anion/cation and both HBDs will change the diffusion coefficients of each component.
Due to the complexity of such mixtures, a fundamental understanding of the interactions involved between the different species of a DES is of significant importance. Hydrogen bonds and ionic interactions play a key role in determining the macroscopic behaviour. The HBD is known to form a complex with the anion of the salt, resulting in the formation of a bulky asymmetric anion, which decreases the lattice energy thus decreasing the freezing point of the system.12 The whole picture could potentially be more complex as some HBDs may also ionise to some extent, leading to the presence of multiple ions within the mixtures. The bulk properties of the whole system, such as viscosity, ionic conductivity and density have provided some insight into the behaviour of these liquids;5,6,12,13 however, a microscopic approach can provide insights regarding the individual species, which affect the macroscopic behaviour of the system. In particular, a more detailed understanding of the mobility of the individual component of the mixture allows an understanding of the relative interactions in the mixture. In this context, pulsed-field gradient (PFG) NMR is one technique that can provide significant insight. The method allows self-diffusion coefficients of NMR active species to be determined and has the advantage of being non-invasive and chemically selective, which makes it possible to investigate simultaneously the diffusion behaviour of different species within a mixture, including different moieties within each molecular species.
In a recent study,14 the molecular transport of the HBD and the choline cation (Ch+) in different pure choline chloride (ChCl) based DESs was investigated. It was found that the structure of the HBD greatly affects the molecular mobility of the whole system. In addition, it was speculated that in the case of Maline, the malonic acid HBD tends to form long chains of dimers, which reduces significantly the molecular mobility of the whole system compared to the other DES and leads to a slower diffusivity of malonic acid relative to ChCl, despite its much smaller molecular weight and size. It is therefore clear that, a variety of interactions takes place within such samples, notably ionic interactions and hydrogen bonding interactions.
The use of DESs in aqueous mixtures is of particular significance as aqueous DES mixtures have several practical applications.15–18 For example, interactions involving DESs, salts and water play an important role when DESs are used as extraction media for protein partitioning.16 Different DESs were shown to have different abilities to extract various proteins. A clear explanation of the extraction performances of the different DES samples was not given; however, from such results one can infer that the steric hindrance of the hydrophobic moieties around the positive nitrogen centre of the DES used in this study plays a key role in determining interactions with the aqueous protein solution, hence affecting the extraction capacity. Abbott et al.18 used water miscible DESs as potential “green” lubricants and investigated the corrosion rate for different metals. It was shown that steel corroded mildly in wet Reline but was almost inert in wet Glyceline. This was ascribed to differences in cathodic reactions in the liquids. It is clear that additional details on the molecular interactions involved in aqueous DES systems would certainly contribute to a better understanding of the microscopic behaviour of such systems in several applications, such as separation and reaction processes in general.
In this study PFG NMR has been used to study the molecular mobility of three ChCl based DESs in the presence of water in order to understand the effect of water composition on the molecular mobility of the different species involved in the system. The hydrogen bond donors studied are those most commonly used in the literature, namely glycerol (Glyceline), urea (Reline) and ethylene glycol (Ethaline). This information obtained shows that all three DESs have different speciation and characteristic interactions from those previously assumed.
Experimental
Materials
Choline chloride [HOC2H4N(CH3)3Cl] (ChCl) (Aldrich 99%) was recrystallized from absolute ethanol, filtered and dried under vacuum. Ethylene glycol (EG), glycerol and urea (all Aldrich +99%), were dried under vacuum. The two components of the DES were mixed together by stirring (in a 1![[thin space (1/6-em)]](https://www.rsc.org/images/entities/char_2009.gif) :
:![[thin space (1/6-em)]](https://www.rsc.org/images/entities/char_2009.gif) 2 molar ratio of ChCl: hydrogen bond donor) at 60 °C until a homogeneous, colourless liquid formed. Viscosity measurements were obtained as a function of temperature using a Brookfield DV-E Viscometer (Brookfield Instruments, USA) fitted with a temperature probe. A variety of spindles (LV1, LV2 and LV3) were used with rotation rates of 5–200 rpm to obtain appropriate viscosity data. The conductivity of the liquids were measured at 20 °C using a Jenway 4510 conductivity meter fitted with a temperature probe (cell constant = 1.01 cm−1). A Krüss Tensiometer/Densitometer model K9MK1 was used to measure the density data for all liquids.
2 molar ratio of ChCl: hydrogen bond donor) at 60 °C until a homogeneous, colourless liquid formed. Viscosity measurements were obtained as a function of temperature using a Brookfield DV-E Viscometer (Brookfield Instruments, USA) fitted with a temperature probe. A variety of spindles (LV1, LV2 and LV3) were used with rotation rates of 5–200 rpm to obtain appropriate viscosity data. The conductivity of the liquids were measured at 20 °C using a Jenway 4510 conductivity meter fitted with a temperature probe (cell constant = 1.01 cm−1). A Krüss Tensiometer/Densitometer model K9MK1 was used to measure the density data for all liquids.
The water content is quoted in wt% but the table below describes the corresponding approximate mole equivalents of water.
| Wt% H2O | 2.5 | 5 | 7.5 | 10 | 12.5 | 15 | 17.5 | 20 |
| Mol eq. water: DES | 0.37 | 0.76 | 1.17 | 1.60 | 2.06 | 2.55 | 3.06 | 3.61 |
PFG NMR measurements
PFG NMR diffusion measurements were conducted on a Bruker DMX 300 spectrometer, equipped with a diffusion probe capable of producing magnetic field gradient pulses up to 11.76 T m−1 in the z-direction and using a pulsed gradient stimulated echo (PGSTE) sequence with a homospoil gradient, which is usually preferred to the standard pulsed gradient spin echo or PGSE sequence, resulting in a better signal-to-noise ratio. The NMR signal attenuation, E(g)/E0, is related to the experimental variables and the diffusion coefficient D according to:19 | (1) |
Results and discussion
Fig. 1 shows the viscosity of 3 different DESs, Reline (HBD = urea), Ethaline (HBD = ethylene glycol) and Glyceline (HBD = glycerol). The viscosity of each liquid was determined using both a rotating cylinder and a quartz crystal microbalance and the data from both techniques deviated from each other by less than 1%. Data for Reline and Glyceline were in accordance with those published previously, albeit the Reline data was at higher temperatures.20,21 In the anhydrous state all liquids showed some non-Newtonian behaviour but all became Newtonian when the water content rose above 2.5 wt%. The non-Newtonian behaviour was observed through a larger error bar in the low water content data but is not discussed further in this study; all of the error bars are smaller than the plot symbol in Fig. 1. In all liquids a decrease in viscosity is observed with increasing water content; however, this is not a steady decrease and there is a pronounced and reproducible shoulder at 2.5 wt% for Glyceline and Reline, which corresponds to approximately 1 mole equivalent of water to each chloride anion, which may be significant.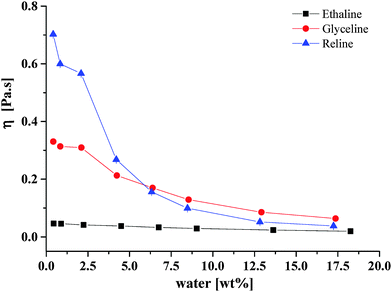 | ||
| Fig. 1 Viscosity of the three DESs at 20 °C as function of water content as determined by rotating cylinder technique. Note error bars are all within the size of the plot symbol. | ||
It is important to notice from Fig. 1 that the effect of water on the viscosity of Reline is greater than for the other two liquids. At higher water content, Glyceline has a higher viscosity than Reline, followed by Ethaline. This suggests that glycerol is the strongest HBD due solely to the fact that it has 3 OH functionalities. This is consistent with the hydrogen bond donating parameters, α, previously determined for these three liquids.22 The α-values for Reline (0.922) and Glyceline (0.937) are relatively similar to those of water (1.17) but the value for Ethaline (0.903) is lower showing that the water will preferentially solvate the chloride anion. As will be discussed later, this may also explain why there is no apparent change in the diffusion coefficient for water in Ethaline at low water content as it is bound with the chloride. This can be clearly seen by inspection of Fig. 5a, shown later.
Fig. 2 shows the plot of molar conductivity versus fluidity for the systems shown in Fig. 1. It can be seen that a relatively linear plot is observed for all systems with the exception of Reline at high water content. In all cases the charge carriers should be the same viz Ch+ and Cl−. In more dilute ionic solutions, it would be expected that ionic association would dominate molar conductivity; the linear plot observed in Fig. 2 suggests viscosity controls charge transport in most systems. As will be shown below, the dilute Reline solution shows evidence of some urea decomposition leading to the formation of NH4OH, which is probably the cause of the increase in molar conductivity at high water content.
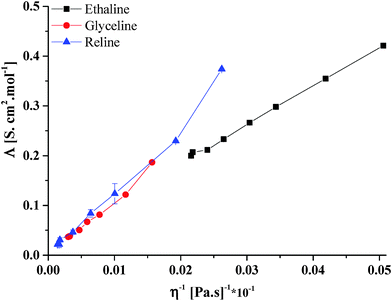 | ||
| Fig. 2 Plot of molar conductivity versus fluidity for the data in Fig. 1. | ||
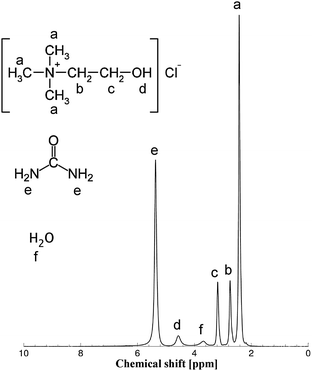
To probe the mobility of the charged and uncharged species further the self-diffusion coefficients were determined using NMR spectroscopy. Fig. 3 reports a typical NMR spectrum for the samples used in this study, together with the peak assignment. The peak assignment is consistent with the spectra previously reported for choline chloride-based DES.14 The NMR peaks are rather broad (typical linewidth values of approximately 25–30 Hz at FWHM) and this is expected given the high viscosity of such samples.
The NMR spectrum and relative peak assignment for aqueous Glyceline, with a 13 wt% fraction of water, is shown in Fig. 4a. Fig. 4b reports the PFG NMR attenuation plots for the various resonances in this sample. The much steeper slope for the water resonance indicates a much faster diffusion of water in the mixture relative to the diffusion of the chemical species of Glyceline. From Fig. 4 it is also possible to observe that the two moieties of glycerol (i.e., the hydroxyl proton and the aliphatic carbon backbone) have diffusivity values that are almost identical to the diffusivity of the hydroxyl proton of the Ch+ species, hence their PFG NMR plots overlap. The Ch+ ion is the species with the slowest diffusivity, as it can be seen by its PFG NMR plot, which shows the lowest slope amongst all species probed.
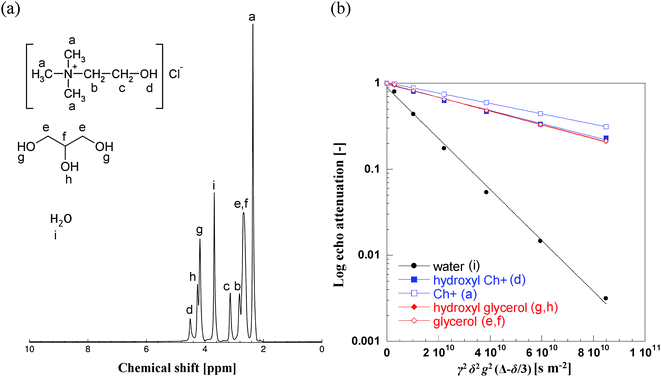 | ||
| Fig. 4 (a) 1H NMR spectrum of aqueous Glyceline at 13 wt% water content at 20 °C. The NMR peak positions are (in ppm): a = 2.40; b = 2.81; c = 3.13; d = 4.50; e,f = 2.67; g = 4.17, h = 4.25, i = 3.68. All resonances are quoted relative to the 1H resonance of tetramethylsilane (TMS). (b) PFG NMR log attenuation plots for the various species in aqueous Glyceline with a 13 wt% fraction of water. The letters in brackets in the legend refer to the peak assignment made on Fig. 4a. Note the distinctive diffusion attenuation of water relative to the other species. Solid lines are fittings using eqn (1). | ||
The experimental data in Fig. 4b were fitted using eqn (1), which allows the determination of the numerical values of self-diffusivity. In the current work we are not only interested in probing the self-diffusion coefficients of the three main components of the mixture (i.e., ChCl, HBD and water) but we are also interested in probing the diffusivities of the hydroxyl protons in both Ch+ and HBD molecules. The particular advantage of PFG NMR is that it can probe the diffusion of a certain species by measuring the signal attenuation of the NMR resonances of that species. In the absence of any exchange/interactions with other species, both aliphatic and hydroxyl 1H resonances of the molecule should yield the same diffusion coefficients (i.e., the molecule/ion moves as a whole). However, if phenomena such as interaction/pairing/exchange between hydroxyl protons of different molecules become significant, one may expect a very large difference in the diffusion coefficient values of the aliphatic and hydroxyl protons of the same molecule. In this context, PFG NMR diffusion measurements become a powerful tool to elucidate interactions between the different species within the liquids, besides their motion characteristics.23
In Fig. 5, the values of self-diffusion coefficients as a function of water content are reported for the different species present in the three different aqueous DES mixtures. It is noted that the only species that cannot be probed with our current experimental PFG-NMR set-up is the Cl− anion; this is because its detection via PFG-NMR is complicated by several factors such as the low sensitivity of chloride anions and the presence of nuclear quadrupolar interactions.
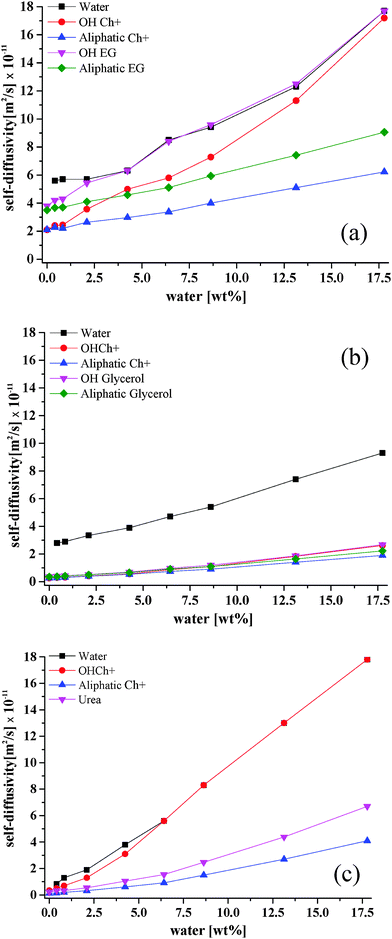 | ||
| Fig. 5 Self-diffusivity coefficients for different species in (a) Ethaline, (b) Glyceline and (c) Reline as a function of water content at 20 °C. | ||
Ethaline
In the pure liquid (i.e., in the absence of any water) the diffusivity of ethylene glycol is higher than that of Ch+. This is in agreement with previous findings14 on pure DES studies and is attributed to the larger size of the Ch+ cation relative to ethylene glycol. It can also be seen that, in each species (i.e. Ch+ and ethylene glycol) the diffusivity of the hydroxyl proton is the same as that measured for the rest of the molecule, which clearly suggests that there is no significant exchange of hydroxyl protons between the two species in the pure Ethaline sample (i.e., the hydroxyl proton remains bound to the rest of the molecule as it diffuses).When water is added to the DES, the diffusivities of both Ch+ and ethylene glycol both increase. However, we now observe a significant deviation for the hydroxyl protons diffusivity of both Ch+ and ethylene glycol relative to the diffusivity of their parent molecules; for each of these species, the hydroxyl proton diffuses faster than rest of the molecule and such a difference becomes more significant as the water content increases, with values approaching those measured for pure water. Indeed, for the highest water content, the diffusion coefficients of the hydroxyl protons of Ch+ and ethylene glycol are almost identical to that measured for water. This suggests that at higher water content both Ch+ and ethylene glycols are in equilibrium with some negatively charged species, with their hydroxyl counterpart in strong exchange with water. If that was not the case, then there should be no difference between self-diffusion of hydroxyl proton and that of the rest of the molecule, which is clearly not the case. It is noted that for the highest water content the –OH resonance of the HBD and water overlap and the diffusivity reported is the average diffusivity of both species.
Glyceline
In the pure liquid the diffusivity of glycerol is slightly higher than that of Ch+, again reflecting the differences in molecular size; however, compared to the case of Ethaline, the diffusivity of the glycerol is similar to that of Ch+ and this is also consistent with previous findings.14 Water has a significantly higher and distinct diffusion coefficient in Glyceline relative to all the other species of the DES, including the hydroxyl species of the DES components (i.e., Ch+ and HBD). This suggests that the hydroxyl protons of Ch+ and glycerol forming Glyceline do not show any significant interaction with water, otherwise a different diffusion coefficient for such protons would be observed due to chemical exchange of protons, as previously observed in alcohol–water mixtures.24 Conversely, the hydroxyl protons of both Ch+ and glycerol have a similar value of self-diffusivity, particularly for low water content. As the water content increases, a deviation of the hydroxyl proton diffusivities in both Ch+ and glycerol is observed, with values becoming higher than those measured for the rest of the molecules; however, such values are nowhere close to the values measured for water. For example, in pure Glyceline (i.e., no water added) the hydroxyl proton of Ch+ and its parent molecule (i.e., Ch+) have both a diffusivity value of 2.7 × 10⁻¹² m2 s−1; the hydroxyl proton of glycerol and its parent molecule (i.e., glycerol) have both a diffusivity value of 3.6 × 10⁻¹² m2 s−1. Conversely, for the Glyceline sample with the highest water content, the hydroxyl proton of Ch+ has a diffusivity of 2.6 × 10⁻¹¹ m2 s−1, which is higher than the 1.9 × 10⁻¹¹ m2 s−1 value measured for the Ch+; the hydroxyl proton of glycerol has a diffusivity of 2.7 × 10⁻¹¹ m2 s−1, which is higher than the 2.2 × 10⁻¹¹ m2 s−1 value measured for the rest of the glycerol molecule. However, both hydroxyl protons have diffusivities that are still significantly slower than that of water, the latter having a diffusivity of 9.3 × 10⁻¹¹ m2 s−1. This suggests that the interaction of Ch+ and the glycerol with water is minimal compared to the Ethaline case; conversely, a much stronger correlated motion between Ch+ and glycerol is observed. This could be attributed to differences in steric hindrance effects between ethylene glycol and glycerol.Reline
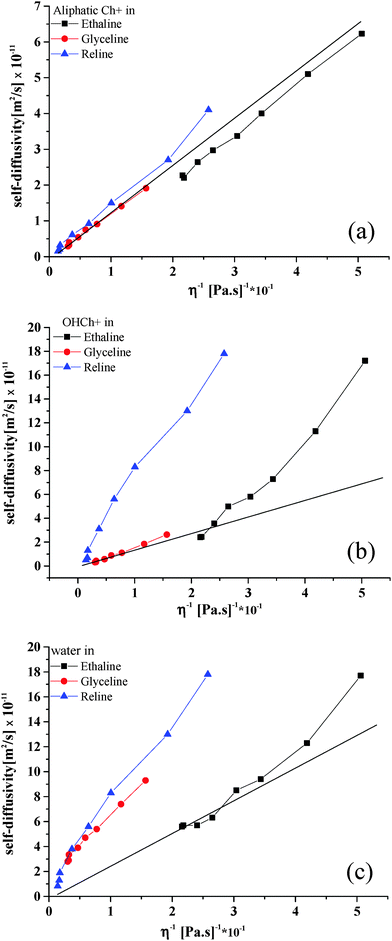
A major difference in Reline compared to Ethaline and Glyceline is that urea does not have any hydroxyl protons that may interact with other species. In pure Reline, similar considerations to those made for pure Glyceline can be made in terms of differences in diffusion coefficients between the HBD and Ch+; the diffusivity of urea is faster than that observed for Ch+, reflecting again the difference in molecular size. As water is added to the system, the diffusivity of the hydroxyl proton of Ch+ starts deviating significantly relatively to the diffusivity of the rest of the Ch+ molecule and approaches the larger diffusivity values observed for water. Above 10 wt% water, the resonances of the hydroxyl proton of Ch+ and water become closer and eventually overlap. Above this water content, the reported diffusivity values for water and the hydroxyl proton of Ch+ is that of the overlapping NMR peaks. The coalescence of these two NMR peaks indicates a fast exchange between the water protons and the hydroxyl protons of Ch+;25 in addition to the finding that the diffusion coefficients of such peaks become similar, this suggests a strong interaction between water and the hydroxyl proton of Ch+.To compare the systems more clearly the data from Fig. 1 and 5 are combined in Fig. 6. In principle, if a Stokesian model of diffusion is valid then the diffusion coefficient should be inversely proportional to the viscosity. Fig. 6a shows that for the aliphatic protons on choline this behaviour is valid, although there is a slightly different slope for the first three data points (up to 2.5 wt%). In the dry ionic liquids and DESs we have previously shown that diffusion is non-Stokesian and this may be due to the large size of the diffusing species and the lack of suitable spaces for them to diffuse into.13 Application of the Stokes–Einstein equation:
| D = kT/6πηR | (2) |
Fig. 6 shows also the theoretical line calculated for Ch+ using eqn (2) and assuming the hard sphere radius of 3.29 Å calculated using a Hartree–Fock model and used previously.1 It can be seen that the aliphatic protons all give responses very similar to those predicted by the Stokes Einstein equation. In a previous study14 it was shown that the diffusion coefficient for choline in pure Glyceline was lower than that expected from the Stokes Einstein Equation and this was related to the fact that the mass transport mechanism was limited by the availability of holes. When water is added to the liquid the smaller water molecules are able to move between these small voids and the availability of holes becomes less of an issue in mass transport.
Fig. 6b shows the response for the OH proton in Ch+ and it is clear that there is a difference between the behaviour of Glyceline and the other two liquids. At low fluidities (i.e., low water concentrations) all liquids show a behaviour which is similar to the theoretical slope for Ch+ but Ethaline and Reline deviate significantly as the water content increases above 2.5 wt% (a 1![[thin space (1/6-em)]](https://www.rsc.org/images/entities/char_2009.gif) :
:![[thin space (1/6-em)]](https://www.rsc.org/images/entities/char_2009.gif) 1 H2O
1 H2O![[thin space (1/6-em)]](https://www.rsc.org/images/entities/char_2009.gif) :
:![[thin space (1/6-em)]](https://www.rsc.org/images/entities/char_2009.gif) Cl−). At high fluidities (i.e., high water content) the diffusion coefficients become similar to those expected for water (see Fig. 6c) i.e., at low water content the water associates with the halide anion whereas at higher water contents it acts as essentially free water.
Cl−). At high fluidities (i.e., high water content) the diffusion coefficients become similar to those expected for water (see Fig. 6c) i.e., at low water content the water associates with the halide anion whereas at higher water contents it acts as essentially free water.
The data in Fig. 6b also suggest that aqueous solutions of Ethaline and Reline enable dissociation of the OH proton of Ch+, which could make the liquids more acidic than Glyceline. This, together with the much faster mobility of the hydroxyl proton of Ch+ in aqueous Ethaline and Reline, relatively to Glyceline, as shown in Fig. 5, would explain the recently reported corrosion data for steel in these solutions, which showed negligible corrosion rate for steel in aqueous Glyceline compared to aqueous Ethaline and Glyceline. Fig. 7 shows solutions of the 3 DESs containing 20 wt% water and universal indicator paper as a pH indicator. It can clearly be seen that there is a significant difference in the colour of the solutions indicating that Reline is considerably more basic than the other two liquids. Use of a pH electrode shows the pH of the three solutions each with 20 wt% water to be Ethaline = 3.97, Glyceline = 7.02 and Reline = 12.2. The Glyceline solution is approximately neutral confirming that the OH proton on the Ch+ remains associated, as shown in Fig. 5b, while the Ethaline solution is slightly acidic which is confirmed by the dissociation and larger diffusion coefficient of the OH proton relative to the Ch+, observed in Fig. 5a. The pH of Reline can only be explained by the partial decomposition of urea to form NH3/NH4OH. It should however be noted that the dissociation is relatively small with an OH− concentration of 0.016 mol dm−3. It is therefore unsurprising that only a trace NMR signal is observed.
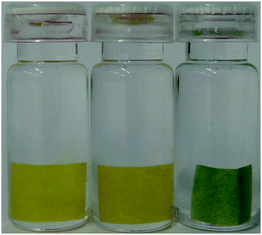 | ||
| Fig. 7 Samples of Ethaline (left) Glyceline (middle) and Reline (right) with 20 wt% water and each containing a sample of universal indicator paper. | ||
These pH data also tie in with the corrosion studies recently reported for the three liquids,18 where it was shown that almost no corrosion was observed in wet Glyceline even after one year whereas mild corrosion was noted in both wet Reline and Ethaline. The formation of NH4OH in dilute Reline would also explain the deviation from linear behaviour in Fig. 2 since there will be more charge carriers, which are considerably smaller and have a larger molar conductivity.
Fig. 6c shows the diffusion coefficient for water as a function of fluidity. The responses for Reline and Glyceline are similar and show a high diffusivity for water, which is similar in both liquids. The self-diffusion coefficient of pure water is 2.299 × 10⁻⁹ m2 s−1 at 25 °C.26 Using this value and scaling for viscosity produces the solid line seen in Fig. 6c. It can be seen that the data for Ethaline fit this quite well but the data for Glyceline and Reline are anomalously high. These results are difficult to reconcile if the liquids are homogeneous and it leads to the suggestion that the anomalous behaviour of water–DES mixtures arise because the water is not homogeneously mixed with the DESs but instead forms separate “microscopic” phases at high water concentrations. Similar studies have been carried out using hydrophobic ionic liquids. Rollet et al.27 used NMR spectroscopy to study water diffusion in 1-n-butyl-3-methylimidazolium bistriflimide [C4mim][(CF3SO2)2N] and found diffusion coefficients for water which was 25 times higher than predicted. They concluded that this was due to phase separation at a microscopic scale. This phase separation is one that has been predicted by molecular dynamics simulations and is somewhat unsurprising given the hydrophobicity of the ionic liquids.28 The hydrophilicity of DESs might lead to the assumption that aqueous mixtures are homogeneous but these diffusional studies show strongly that microscopic phase separation still occurs. The pH and the ability of water in these mixtures to form separate micro-phases could be responsible for some of the observations in biochemical and mineral processing applications e.g. the stability of enzymes in water DES mixtures.29
Conclusions
This study has shown that in anhydrous DESs the HBD and OH on Ch+ are associated and the fluidity of the liquid is controlled by the hydrogen bond interaction between the HBD and the halide anion. When water is added to the liquid the viscosity of all liquids decrease but a discontinuity is observed for all systems at about 2.5 wt% which corresponds to a 1![[thin space (1/6-em)]](https://www.rsc.org/images/entities/char_2009.gif) :
:![[thin space (1/6-em)]](https://www.rsc.org/images/entities/char_2009.gif) 1 mole equivalent of water
1 mole equivalent of water![[thin space (1/6-em)]](https://www.rsc.org/images/entities/char_2009.gif) :
:![[thin space (1/6-em)]](https://www.rsc.org/images/entities/char_2009.gif) chloride. This is the typical water content where changes in the behaviour of DESs have been observed. PFG NMR diffusion experiments revealed new insights into these liquids at a microscopic level. This study has shown that the choline cation diffuses in a Stokesian manner. However it has been shown for the first time that the addition of water can lead to the exchange of the OH proton on Ch+, which leads to mildly acidic solutions for Ethaline, i.e., when ethylene glycol is used as the HBD. Conversely, for Reline, i.e., when urea is the HBD, decomposition leads to the formation of basic solutions when NH4OH is formed. Self-diffusion data for water strongly suggest that the liquids are not homogeneous and contain distinct microscopic water-rich phases when a significant amount of water is added. In conclusion, this study show that PFG NMR diffusion measurements are a powerful tool that combined with other characterisation methods may give new microscopic insights into complex liquid mixtures, such as the DES–water mixtures used in this work and yield information on both molecular dynamics and molecular/ionic interactions between the different species within the mixture.
chloride. This is the typical water content where changes in the behaviour of DESs have been observed. PFG NMR diffusion experiments revealed new insights into these liquids at a microscopic level. This study has shown that the choline cation diffuses in a Stokesian manner. However it has been shown for the first time that the addition of water can lead to the exchange of the OH proton on Ch+, which leads to mildly acidic solutions for Ethaline, i.e., when ethylene glycol is used as the HBD. Conversely, for Reline, i.e., when urea is the HBD, decomposition leads to the formation of basic solutions when NH4OH is formed. Self-diffusion data for water strongly suggest that the liquids are not homogeneous and contain distinct microscopic water-rich phases when a significant amount of water is added. In conclusion, this study show that PFG NMR diffusion measurements are a powerful tool that combined with other characterisation methods may give new microscopic insights into complex liquid mixtures, such as the DES–water mixtures used in this work and yield information on both molecular dynamics and molecular/ionic interactions between the different species within the mixture.
Acknowledgements
Carmine D’Agostino would like to acknowledge Wolfson College, Cambridge, for supporting his research activities. The authors would also like to thank Salahaddin University (EIA) and the University of Kufa (AYMA) for funding studentships.References
- A. P. Abbott, R. C. Harris, K. S. Ryder, C. D'Agostino, L. F. Gladden and M. D. Mantle, Green Chem., 2011, 13, 82–90 RSC.
- V. Krishnakumar, N. G. Vindhya, B. K. Mandal and F. R. N. Khan, Ind. Eng. Chem. Res., 2014, 53, 10814–10819 CrossRef CAS.
- U. N. Yadav and G. S. Shankarling, J. Mol. Liq., 2014, 195, 188–193 CrossRef CAS PubMed.
- A. P. Abbott, G. Capper, D. L. Davies, K. J. McKenzie and S. U. Obi, J. Chem. Eng. Data, 2006, 51, 1280–1282 CrossRef CAS.
- H. G. Morrison, C. C. Sun and S. Neervannan, Int. J. Pharm., 2009, 378, 136–139 CrossRef CAS PubMed.
- A. P. Abbott, G. Capper, D. L. Davies, R. K. Rasheed and V. Tambyrajah, Chem. Commun., 2003, 70–71 RSC.
- E. L. Smith, C. Fullarton, R. C. Harris, S. Saleem and A. P. Abbott, Trans. Inst. Met. Finish., 2010, 88, 285–293 CrossRef CAS PubMed.
- A. P. Abbott, P. M. Cullis, M. J. Gibson, R. C. Harris and E. Raven, Green Chem., 2007, 9, 868–872 RSC.
- H.-R. Jhong, D. S.-H. Wonga, C.-C. Wana, Y.-Y. Wang and T.-C. Wei, Electrochem. Commun., 2009, 11, 209–211 CrossRef CAS PubMed.
- A. M. M. Sousa, H. K. S. Souza, N. Latona, C. K. Liu, M. P. Goncalves and L. S. Liu, Carbohydr. Polym., 2014, 111, 206–214 CrossRef CAS PubMed.
- A. P. Abbott, G. Frisch and K. S. Ryder, Annu. Rev. Mater. Res., 2013, 43, 335–358 CrossRef CAS.
- A. P. Abbott, D. Boothby, G. Capper, D. L. Davies and R. K. Rasheed, J. Am. Chem. Soc., 2004, 126, 9142–9147 CrossRef CAS PubMed.
- A. W. Taylor, P. Licence and A. P. Abbott, Phys. Chem. Chem. Phys., 2011, 13, 10147–10154 RSC.
- C. D'Agostino, R. C. Harris, A. P. Abbott, L. F. Gladden and M. D. Mantle, Phys. Chem. Chem. Phys., 2011, 13, 21383–21391 RSC.
- Y. H. Hsu, R. B. Leron and M. H. Li, J. Chem. Thermodyn., 2014, 72, 94–99 CrossRef CAS PubMed.
- Q. Zeng, Y. Wang, Y. Huang, X. Ding, J. Chen and K. Xu, Analyst, 2014, 139, 2565–2573 RSC.
- R. Esquembre, J. M. Sanz, J. G. Wall, F. del Monte, C. R. Mateo and M. L. Ferrer, Phys. Chem. Chem. Phys., 2013, 15, 11248–11256 RSC.
- A. P. Abbott, E. I. Ahmed, R. C. Harris and K. S. Ryder, Green Chem., 2014, 16, 4156–4161 RSC.
- J. E. Tanner, J. Chem. Phys., 1970, 52, 2523–2526 CrossRef CAS PubMed.
- A. Yadav and S. Pandey, J. Chem. Eng. Data, 2014, 59, 2221–2229 CrossRef CAS.
- A. Yadav, S. Trivedi, R. Rai and S. Pandey, Fluid Phase Equilib., 2014, 367, 135–142 CrossRef CAS PubMed.
- R. C. Harris, PhD thesis, University of Leicester, Leicester, 2008.
- P. S. Pregosin, Prog. Nucl. Magn. Reson. Spectrosc., 2006, 49, 261–288 CrossRef CAS PubMed.
- R. Li, C. D’Agostino, J. McGregor, M. D. Mantle, J. A. Zeitler and L. F. Gladden, J. Phys. Chem. B, 2014, 118, 10156–10166 CrossRef CAS PubMed.
- P. J. Hore, S. G. Davies, R. G. Compton, J. Evans and L. F. Gladden, Nuclear Magnetic Resonance, Oxford Science Publications, Oxford, UK, 1995 Search PubMed.
- M. Holz, S. R. Heil and A. Sacco, Phys. Chem. Chem. Phys., 2000, 2, 4740–4742 RSC.
- A.-L. Rollet, P. Porion, M. Vaultier, I. Billard, M. Deschamps, C. Bessada and L. Jouvensal, J. Phys. Chem. B, 2007, 111, 11888–11891 CrossRef CAS PubMed.
- C. G. Hanke and R. M. Lynden-Bell, J. Phys. Chem. B, 2003, 107, 10873–10878 CrossRef CAS.
- E. Durand, J. Lecomte, B. Barea, G. Piombo, E. Dubreucq and P. Villeneuve, Process Biochem., 2012, 47, 2081–2089 CrossRef CAS PubMed.
| This journal is © the Owner Societies 2015 |

