
 Open Access Article
 This Open Access Article is licensed under a Creative Commons Attribution-Non Commercial 3.0 Unported Licence
Electrochemical and spectroscopic study of Zn(II) coordination and Zn electrodeposition in three ionic liquids with the trifluoromethylsulfonate anion, different imidazolium ions and their mixtures with water
Zhen
Liu
a,
Sherif Zein
El Abedin
ab and
Frank
Endres
*a
aInstitute of Electrochemistry, Clausthal University of Technology, Arnold-Sommerfeld-Strasse 6, 38678 Clausthal-Zellerfeld, Germany. E-mail: frank.endres@tu-clausthal.de; Fax: +49 5323 722460; Tel: +49 5323 723141
bElectrochemistry and Corrosion Laboratory, National Research Centre, El Bohoth Street 33, Dokki, Giza, Egypt
First published on 1st June 2015
Abstract
In this paper we report on the use of three ionic liquids, 1-methylimidazolium trifluoromethylsulfonate ([MIm]TfO), 1-ethyl-3-methylimidazolium trifluoromethylsulfonate ([EMIm]TfO) and 1-ethyl-2,3-dimethylimidazolium trifluoromethylsulfonate ([EMMIm]TfO) containing zinc trifluoromethylsulfonate as electrolytes for zinc electrodeposition. By varying the cations from [MIm]+via [EMIm]+ to [EMMIm]+, the vibrational band in the Far-IR spectra below 200 cm−1, characterizing the cation–anion interaction, is shifted to lower wavenumbers, which suggests that the interaction between cations and anions is arranged in order of [MIm]TfO > [EMIm]TfO > [EMMIm]TfO. The coordination of Zn2+ ions in these electrolytes was investigated by Raman spectroscopy. The Raman spectra show obvious differences in terms of the solvation of Zn2+ ions in the dried electrolytes. The average number of TfO− anions bound to each Zn2+ ion is lower in [MIm]TfO than in [EMIm]TfO and in [EMMIm]TfO, respectively. In ionic liquid–water mixtures, aqueous zinc species were formed in all cases. The differences in zinc species present in the electrolytes should have an influence on their electrochemical behavior and on the morphology of the deposits. In dried ionic liquids, the cyclic voltammograms reveal that the potentials for the deposition of zinc were shifted to more negative values by varying the cations, while in ionic liquid–water mixtures, the deposition of zinc occurs at almost the same potential. The SEM and XRD results show that the surface morphology, crystal shape and size as well as crystallographic orientation of the deposits are markedly affected by varying the cations of the ionic liquids.
1. Introduction
Ionic liquids (ILs) are often called “designer solvents”, because their physical and chemical properties (e.g. melting point, conductivity, viscosity and electrochemical window) can be tuned by modification of the individual cation or anion or both. By combination of anion and cation of appropriate design, they can offer high ionic conductivity, negligible flammability, high thermal stability and large electrochemical window which makes them promising electrolytes for electrochemical devices such as batteries, capacitors, fuel cells and solar cells.1–3 They are also employed as electrolytes for the electrodeposition of metals and alloys.4,5 There is a theoretically possible number of more than 109 ILs, of which about 1000 have been described in literature.6 Therefore, it is quite difficult if not even impossible to experimentally investigate all potential cation–anion combinations without a fundamental understanding of the behavior of the species comprising the electrolytes.In practical electrodeposition processes, high solubility of metal salts in ionic liquids is required. This can be achieved by modification of the cation with a functional group (e.g. ether- or hydroxyl-functionalized ILs)7 or by increasing concentration and complexation ability of anions (e.g. dicyanamide (DCA) anion).8 Ionic liquids usually contain weakly coordinating anions, such as tetrafluoroborate (BF4−), hexafluorophosphate (PF6−), bis(trifluoromethylsulfonyl)amide (TFSA−), and trifluoromethylsulfonate (TfO−) anions and the solvation of metal cation in ionic liquids largely depends on the anion. The interaction between metal ions and ionic liquid anions influences the speciation and determines the solubility. It was e.g. reported by Abbott et al. that the electrolytes show different colors by dissolving CuCl2·2H2O in a variety of ionic liquids, indicating that different copper species are present in different liquids.9 The interaction between cation and anion in ILs also influences the solvation of metal ions. Hydrogen bonds, Coulombic force and van der Waals interactions have a considerable impact not only on the properties of the IL but also on the interactions between IL and solute molecules. The strength of intermolecular interactions between cation and anion in ILs can be comparatively studied by far infrared spectroscopy. The low frequency vibrational bands below 200 cm−1 can be assigned to the bending and stretching modes of the cation–anion interaction. The interpretation is supported by ab initio calculations.10,11 By varying the cation or the anion of ILs, the band shifts in frequency and changes intensity indicating the strength of the interaction. Therefore, the anion environment in these electrolytes and the solvation of metal ions can be comparatively investigated.
The physical and chemical properties of ILs can also be modified by mixing them with other components, such as other ILs, organic solvents or water.12–14 IL–water mixtures have attracted much attention as trace amounts of water can have a great influence on the properties of ILs such as viscosity, polarity, and surface tension.15,16 In addition, it can have an influence on the interfacial layer properties.
The differences in metal species and interfacial interactions can have a strong influence on the electrochemical process and the quality of the deposits. Therefore, understanding the relationship between metal speciation, their electrochemical performance and the morphology is critical for designing a proper ionic liquid. Our strategy is to vary the imidazolium cation by substitution of the hydrogen atom in the imidazolium ring with alkyl groups, keeping the anion the same.
In this paper we report on the use of three ILs, 1-methylimidazolium trifluoromethylsulfonate ([MIm]TfO), 1-ethyl-3-methylimidazolium trifluoromethylsulfonate ([EMIm]TfO) and 1-ethyl-2,3-dimethylimidazolium trifluoromethylsulfonate ([EMMIm]TfO) in combination with zinc trifluoromethylsulfonate as electrolytes for zinc deposition. The interaction between cation and anion was investigated by Far-IR spectroscopy and the solvation of zinc ions in the electrolytes was studied by Raman spectroscopy. Furthermore, the electrochemical behavior, morphology and phase orientation of the zinc deposit in dried ILs and IL–water mixtures were studied.
2. Experimental
The ionic liquids 1-methylimidazolium trifluoromethylsulfonate ([MIm]TfO) (98%), 1-ethyl-3-methylimidazolium trifluoromethylsulfonate ([EMIm]TfO) (99%) and 1-ethyl-2,3-dimethylimidazolium trifluoromethylsulfonate ([EMMIm]TfO) (98%) were purchased from IO-LI-TEC, Germany in the highest available quality. The ionic liquids [MIm]TfO and [EMMIm]TfO are solid at room temperature. Zinc trifluoromethylsulfonate, Zn(TfO)2 (99%) was obtained from IO-LI-TEC as well. The ionic liquids (chemical structures are shown in Fig. 1) were dried under vacuum at 120 °C to water contents of below 3 ppm and stored in closed bottles in an argon filled glove box (OMNI-LAB from Vacuum Atmospheres) before use. From the synthesis process such liquids can contain several hundred ppm of trifluoromethylsulfonic acid. The concentration of Zn(TfO)2 in those ionic liquids was adjusted to 0.2 mol L−1 (M). Ionic liquid–water mixtures were prepared by adding 30 wt% of water to 0.2 M Zn(TfO)2/IL (70 wt%).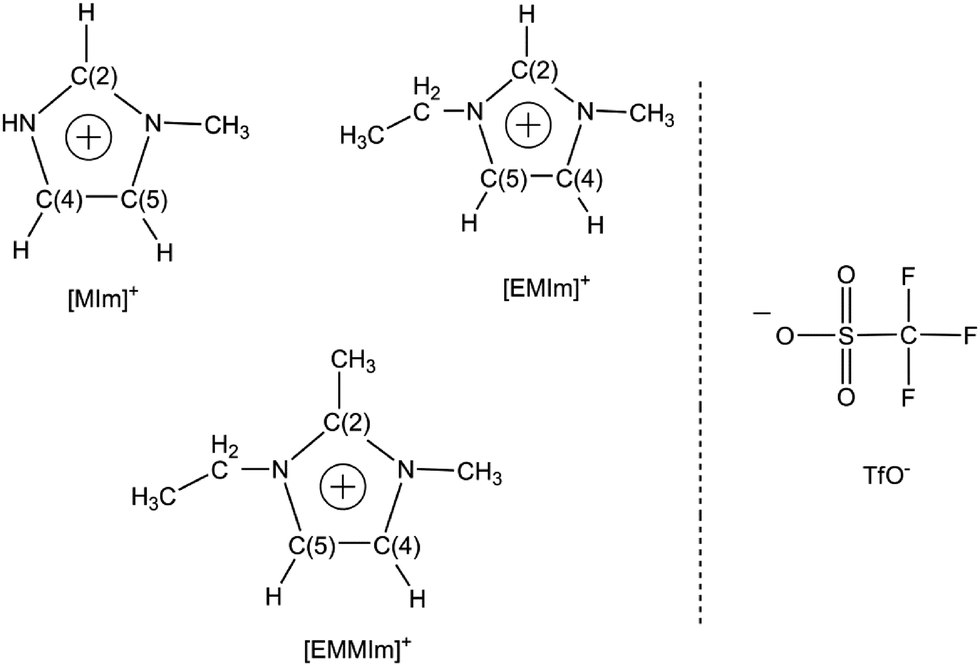 | ||
| Fig. 1 Chemical structures of [MIm]TfO, [EMIm]TfO and [EMMIm]TfO. | ||
The cyclic voltammetry and electrodeposition experiments were carried out in the glove box for dried liquids at 120 °C. A 25 mL glass beaker was employed as an electrochemical cell for the experiments. For ionic liquid–water mixtures, the experiments were done under air with a relative humidity of about 50% at 22 °C using a three-electrode cell setup. The electrochemical cell made of polytetrafluoroethylene (Teflon) was clamped over a Teflon covered Viton o-ring, thus yielding a geometric surface area of 0.3 cm2. Gold substrates (gold on glass) from Arrandee Inc., predominantly Au(111), were used as working electrodes. Platinum wires (Alfa, 99.99%) were used as counter and quasi-reference electrodes, respectively. The quasi-reference electrode is electrochemically stable enough during the experiments. The electrochemical measurements were carried out using a PARSTAT 2263 potentiostat/galvanostat controlled by PowerCV and PowerStep software. The Pt quasi-reference electrode was cleaned with isopropanol in an ultrasonic bath for 15 min and annealed in a hydrogen flame to red glow in order to remove any possible contaminations. The electrochemical cell was thoroughly cleaned in a mixture of 50/50 vol.% H2SO4/H2O2 followed by refluxing in distilled water. The reference electrode was immersed in the middle of the solution and the whole volume of the cell was referred.
The surface morphology of the deposit was characterized by high resolution SEM (Carl Zeiss DSM 982 Gemini). X-ray diffraction patterns were recorded at room temperature using a PANalytical Empyrean Diffractometer (Cabinet No. 9430 060 03002) with Cu Kα radiation. Differential scanning calorimeter (DSC) analysis was carried out using a DSC 2910 instrument (TA Instruments). Ionic liquid samples with a weight of 2–3 mg were used for the measurements. The samples were heated from room temperature to 600 °C with a heating rate of 10 °C min−1 using argon as a purge gas. The Far-IR measurements were performed on a Bruker VERTEX 70 FT-IR spectrometer equipped with an extension for measurements in the far infrared region, which consists of a multilayer mylar beam splitter, a room temperature DLATGS detector with preamplifier. The Raman measurements were carried out with a Raman module FRA 106 (Nd:YAG laser, 1064 nm) attached to a Bruker IFS 66 v interferometer with a resolution of 2 cm−1. The spectra were fitted by Voigt response functions controlled by the software PeakFit. The correlation (r2) of each fitting is more than 0.995. The viscosities of the ionic liquid electrolytes at 120 °C and ionic liquid–water mixtures at room temperature were measured by a Bohlin Germini 150 rheometer (Malvern Instruments, Ltd UK).
3. Results and discussion
3.1 Thermal stability and melting point
The thermal stability of these ionic liquids was examined by DSC between 20 and 600 °C. As shown in Fig. 2, both the ionic liquids [EMIm]TfO and [EMMIm]TfO have a thermal decomposition temperature of ∼350 °C, whereas [MIm]TfO has a decomposition temperature of ∼300 °C. In [MIm]TfO, the peak around 100 °C is due to the removal of water that was absorbed during ex situ handling. The presence of water can alter the thermal stability of the ionic liquid significantly.17 A side reaction, such as e.g. the formation of HF in the case of BF4− or PF6− is possible when water is present.18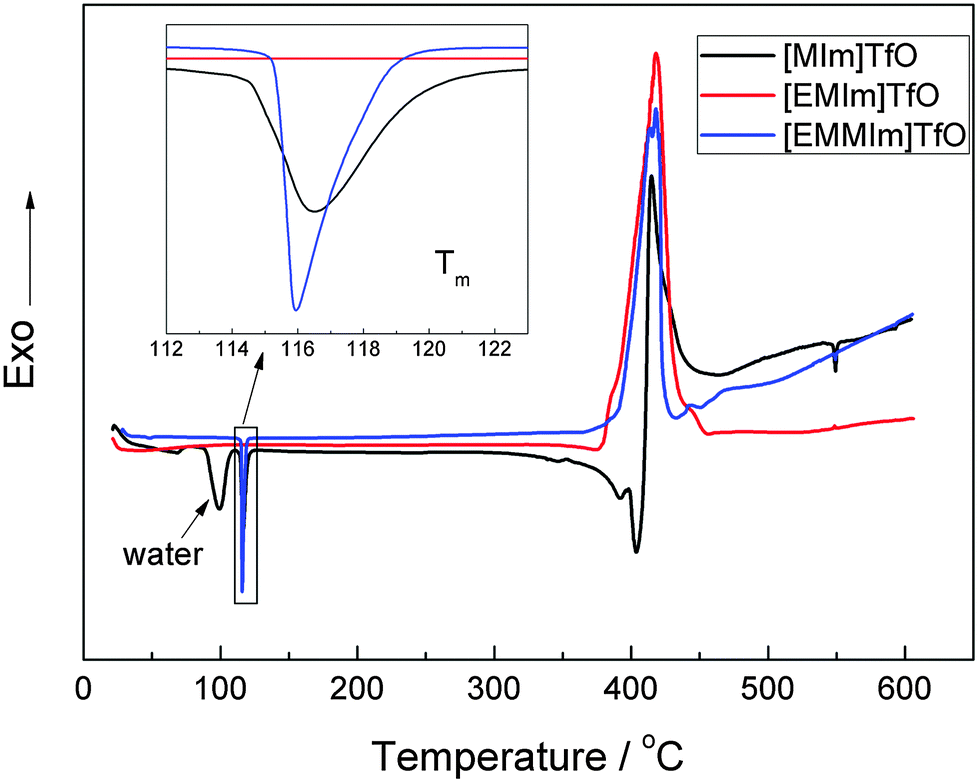 | ||
| Fig. 2 DSC curves of [MIm]TfO, [EMIm]TfO and [EMMIm]TfO. | ||
The melting point is quite an important property in the design and application of ionic liquids. The inset of Fig. 2 shows that both [MIm]TfO and [EMMIm]TfO have a melting point (Tm) of ∼116 °C, which is significantly higher than that one of [EMIm]TfO (−9 °C).19 Although some methods have been used to estimate the melting point of ionic liquids, it is still difficult to correlate and predict, because it is dependent on the arrangement of the ions in the crystal lattice and on the strength of the ion interactions.20–22 The interaction between cation and anion, such as Coulombic interactions, hydrogen bonding, van der Waals interactions and the distribution of charge can influence the melting points. However, the melting point of the IL can be reduced to below room temperature, e.g. the substitution of the methyl- by an ethyl-group in the 1-methylimidazolium cation, resulting in a melting point of below 20 °C.23
3.2 Viscosity of ionic liquid electrolytes
The viscosity of ILs ranges from about 10 to 500 mPa s at ambient temperature and plays an important role in possible industrial applications where stirring, mixing and pumping is needed.24–26 In addition, it has a strong influence on the transport properties. Therefore, many efforts were done to synthesize low viscosity ionic liquids for a variety of purposes.27–29 The structure of the ions in the IL and their interactions can affect the viscosity. Alternatively, addition of a co-solvent such as water is known to reduce the viscosity of ionic liquids. Ionic liquid–water mixtures could be more efficient electrolytes than ionic liquids alone.30,31Table 1 presents the viscosities of the dried ILs in this work containing 0.2 M Zn(TfO)2 at 120 °C and their mixtures with 30 wt% water at 25 °C, respectively. [EMIm]TfO alone has a viscosity of ∼40 mPa s at 25 °C.32,33 Increasing of the temperature can effectively reduce the viscosity by more than one order of magnitude. The viscosities of the dried electrolytes 0.2 M Zn(TfO)2/[MIm]TfO, 0.2 M Zn(TfO)2/[EMIm]TfO and 0.2 M Zn(TfO)2/[EMMIm]TfO at 120 °C are quite comparable exhibiting a viscosity of ∼3.0–3.7 mPa s. Table 1 also compares the viscosity of the mixtures of 0.2 M Zn(TfO)2/IL with 30 wt% water. These electrolytes display similar viscosity of about 4 mPa s at 25 °C.| Ionic liquid (IL) | Viscosity of 0.2 M Zn(TfO)2/IL at 120 °C (mPa s) | Viscosity of 0.2 M Zn(TfO)2/IL + 30 wt% water at 25 °C (mPa s) |
|---|---|---|
| [MIm]TfO | 3.2 ± 0.2 | 3.8 ± 0.1 |
| [EMIm]TfO | 3.7 ± 0.1 | 4.3 ± 0.1 |
| [EMMIm]TfO | 3.0 ± 0.2 | 4.0 ± 0.2 |
3.3 Interaction between cation and anion (Far-IR spectroscopy)
The FIR spectra of [MIm]TfO, [EMIm]TfO and [EMMIm]TfO between 30 and 300 cm−1 at room temperature are presented in Fig. 3. We focus on the region below 200 cm−1, which is dominated by C–H⋯A and/or N–H⋯A (anion) interactions.34,35 As can be clearly seen in Fig. 3, the maximum intensity of the measured spectrum occurs at 116 cm−1 in [MIm]TfO. Hydrogen bonds to the anion can be formed via N–H and C(2,4,5)–H. When the hydrogen atom of N–H in the imidazolium cation is substituted by an ethyl group ([EMIm]+) that is incapable of strong hydrogen bonding via the aliphatic N–H, the band is shifted to 90 cm−1 (Fig. 3b). By methylation of [EMIm]+ at C(2)–H, the formation of hydrogen bonds is only possible via C(4,5)–H and the band is shifted to 75 cm−1 (Fig. 3c). A band shift to lower wavenumbers means reduced interaction, suggesting that the strength of interaction between cation and anion is in order of [MIm]TfO > [EMIm]TfO > [EMMIm]TfO. The different interaction between cation and anion influence metal speciation and the solubility of metal salts in ionic liquids.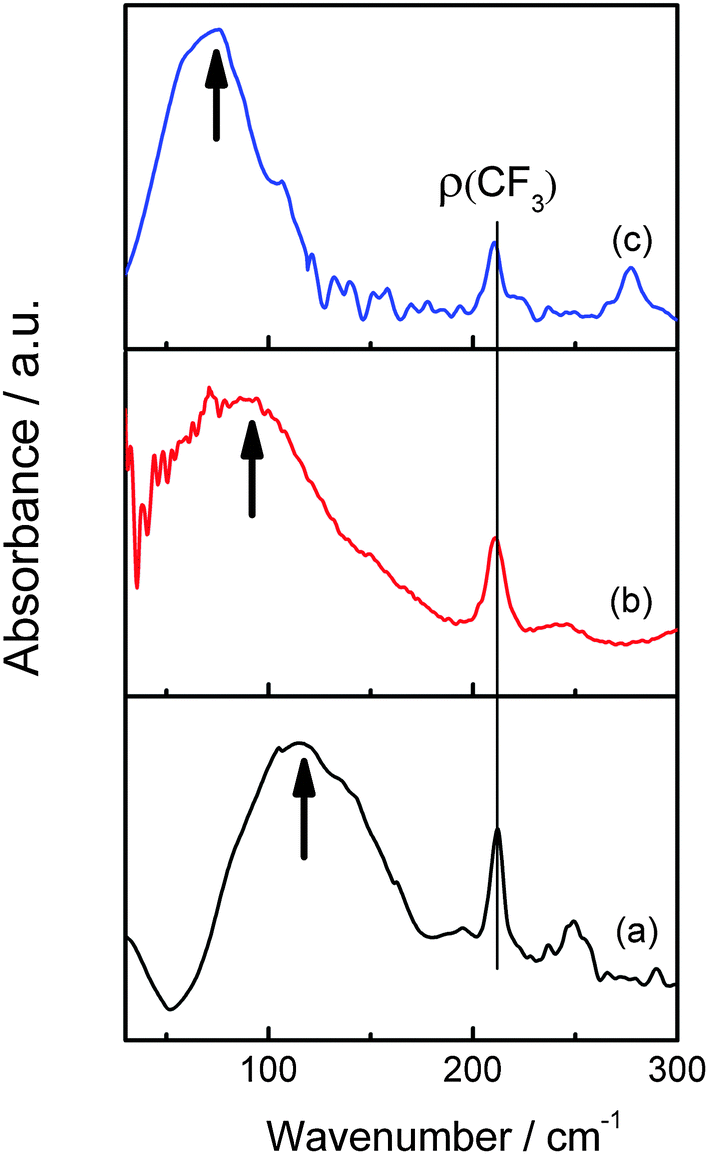 | ||
| Fig. 3 Far-IR spectra of [MIm]TfO (a), [EMIm]TfO (b) and [EMMIm]TfO (c) between 30 and 300 cm−1. | ||
3.4 The solvation of Zn2+ in ionic liquid electrolytes
The solvation of Zn2+ in the three ionic liquids was investigated by examining the vibrational mode of the CF3 symmetric deformation, δs(CF3), in Raman spectra. This signal is very sensitive to the environment and an additional signal at higher wavenumbers can be observed when TfO− anions are coordinated.36 The Raman spectra of [MIm]TfO, [EMIm]TfO and [EMMIm]TfO containing 0.2 M Zn(TfO)2, respectively, between 740 and 780 cm−1 at 120 °C are shown in Fig. 4. The peaks were deconvoluted and the fitting peak positions were marked in Fig. 4.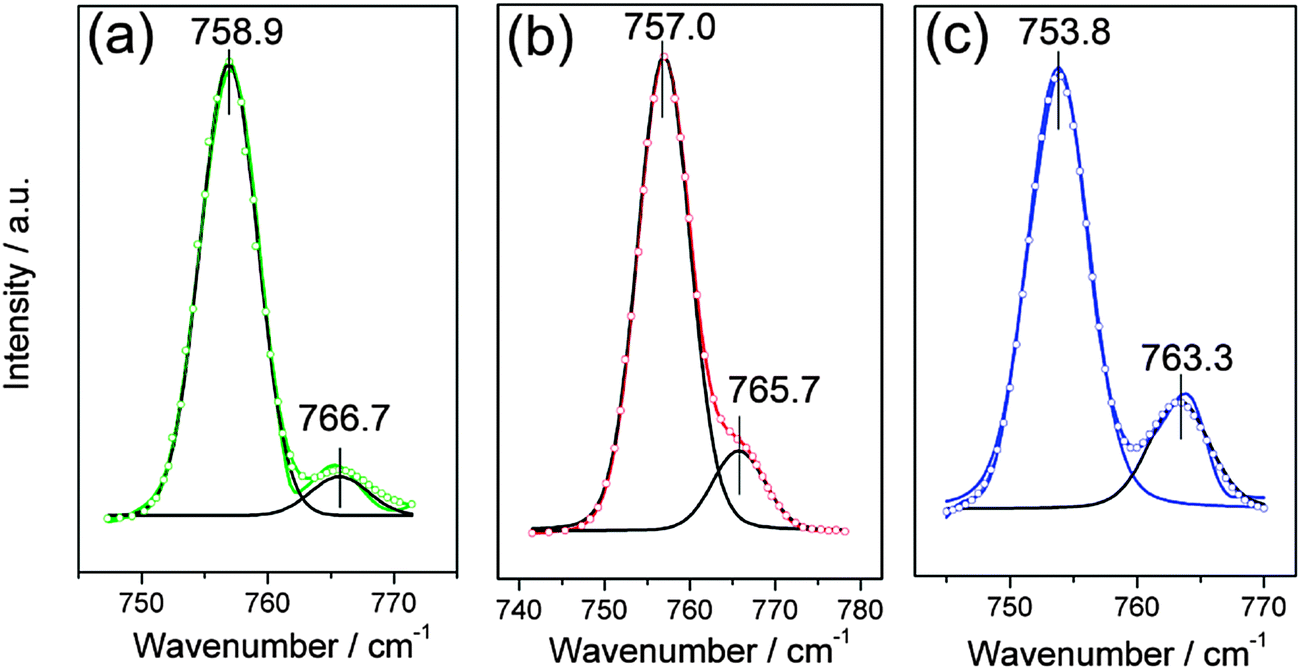 | ||
| Fig. 4 Raman spectra of 0.2 M Zn(TfO)2/[MIm]TfO (a), of 0.2 M Zn(TfO)2/[EMIm]TfO (b) and of 0.2 M Zn(TfO)2/[EMMIm]TfO (c), respectively, between 740 and 780 cm−1. Colored solid lines: original data, colored circles: fitting data and black solid lines: deconvoluted curves. The spectrum was deconvoluted into two bands. The band at low wavenumber is attributed to the vibration of free TfO− anions and the band at high wavenumber is assigned to the vibration of Zn coordinated TfO− anions. | ||
The Raman spectrum can be deconvoluted into two peaks: the peak at low wavenumbers is attributed to the vibration of “free” (uncoordinated) TfO− anions and the peak at higher wavenumbers is due to the vibration of zinc coordinated TfO− anions. The “free” TfO− anions in 0.2 M Zn(TfO)2/[MIm]TfO is centered at 758.9 cm−1 and shifted to 757.0 cm−1 in [EMIm]TfO and to 753.8 cm−1 in [EMMIm]TfO. The vibration mode of zinc coordinated TfO− anions in these electrolytes also slightly shifted to lower wavenumbers in the same order. The shifts are due to their different interactions between cations and anions.
The average number of TfO− coordination to each Zn2+ is calculated according to:37
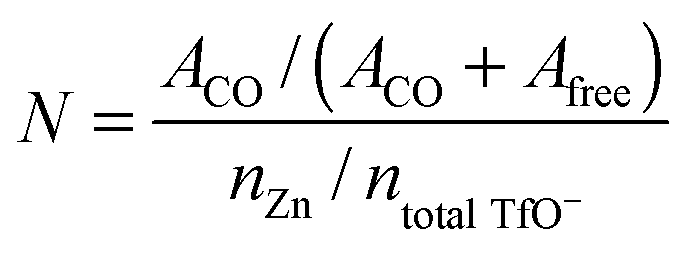
In [MIm]TfO, each Zn2+ ion is coordinated with 3 TfO− anions, which indicates that the species present is [Zn(TfO)3]−. The number was found to be 3.8 in [EMIm]TfO meaning that the dominant coordination number is 4 and [Zn(TfO)4]2− species are present. The average number of TfO− coordinated to each Zn2+ ion is 5 in [EMMIm]TfO, suggesting [Zn(TfO)5]3− complexes are present. For steric reasons [Zn(TfO)6]4− complexes seem to be less favored. It is evident that the stronger the interaction between cations and anions, the weaker the anions are associated with Zn2+ ions. We also investigated the solvation of zinc in ionic liquid–water mixtures, and no additional signal was observed. That means the zinc ion is no longer coordinated with TfO− anions, rather associated with water forming aqueous zinc species. The Raman spectra of [EMIm]TfO and of [EMIm]TfO–water mixtures containing Zn(TfO)2 and the interaction between [EMIm]TfO and water were reported in our previous work.38 The difference in the species must have an influence on the electrochemical behavior and morphology of the deposit, thus experiments were carried out both in pure ionic liquids and in ionic liquid–water mixtures.
3.5 Electrochemical behavior of zinc in dried ionic liquids
Both [MIm]TfO and [EMMIm]TfO have a melting point of ∼116 °C. Therefore, the experiments were carried out at elevated temperature. The cyclic voltammograms of the employed ionic liquids containing 0.2 M Zn(TfO)2 recorded on gold at 120 °C are shown in Fig. 5. The electrode potential was scanned cathodically from the open circuit potential (OCP) with a scan rate of 10 mV s−1. The voltammogram of neat [MIm]TfO on gold is also shown in Fig. 5 curve (â). As seen, the cathodic current in pure [MIm]TfO starts to increase at −0.6 V as a result of hydrogen evolution. In Fig. 5 curve (a) (0.2 M Zn(TfO)2/[MIm]TfO), the first cathodic peak (c1) centered at about −0.95 V vs. Pt is correlated to the reduction of Zn2+ and the peak current density reached ca. 28 mA cm−2, of which a small fraction is probably due to hydrogen evolution. In the anodic range, the peak a1 can be assigned to the oxidation of Zn and peak a2 is due to the stripping of a Au–Zn alloy. In the investigated regime of −1.5 V to +1.0 V vs. Pt, the ionic liquids [EMIm]TfO and [EMMIm]TfO are electrochemically quite stable. The CV of 0.2 M Zn(TfO)2/[EMIm]TfO (Fig. 5b) exhibits one Zn reduction peak (c1) centered at −1.05 V in the cathodic regime and four anodic peaks in the backward scan. The peaks a1, a2 and a3 are associated with the oxidation of Zn and a4 is related to the stripping of a Au–Zn alloy. A current loop was observed when the scan was reversed, indicating a nucleation process. In Fig. 5 curve (c) (0.2 M Zn(TfO)2/[EMMIm]TfO), one Zn reduction peak (c1) centered at −1.1 V with its anodic counterparts for the oxidation of Zn (a1) and of a Au–Zn alloy (a2) were found in the back scan. It can also be seen in Fig. 5 as marked with a gray bar that the zinc reduction peak potential was obviously shifted to more negative values as the cation varied from [MIm]+via [EMIm]+ to [EMMIm]+. In addition, a sharp reduction peak was observed in Fig. 5 curve (a) and a relatively flattened reduction peak was observed in Fig. 5 curve (c). As mentioned above, the three electrolytes display similar viscosity in the order of 3.0–3.6 mPa s at 120 °C. Therefore, the shift is unlikely caused by diffusion limitation, rather it can be related to the different species present in the electrolytes. The higher coordinated zinc species like [Zn(TfO)5]3− in [EMMIm]TfO are obviously more difficult to reduce and therefore higher overpotential is needed to drive the nucleation process, whereas the lower coordinated species like [Zn(TfO)3]− are more easily to reduce.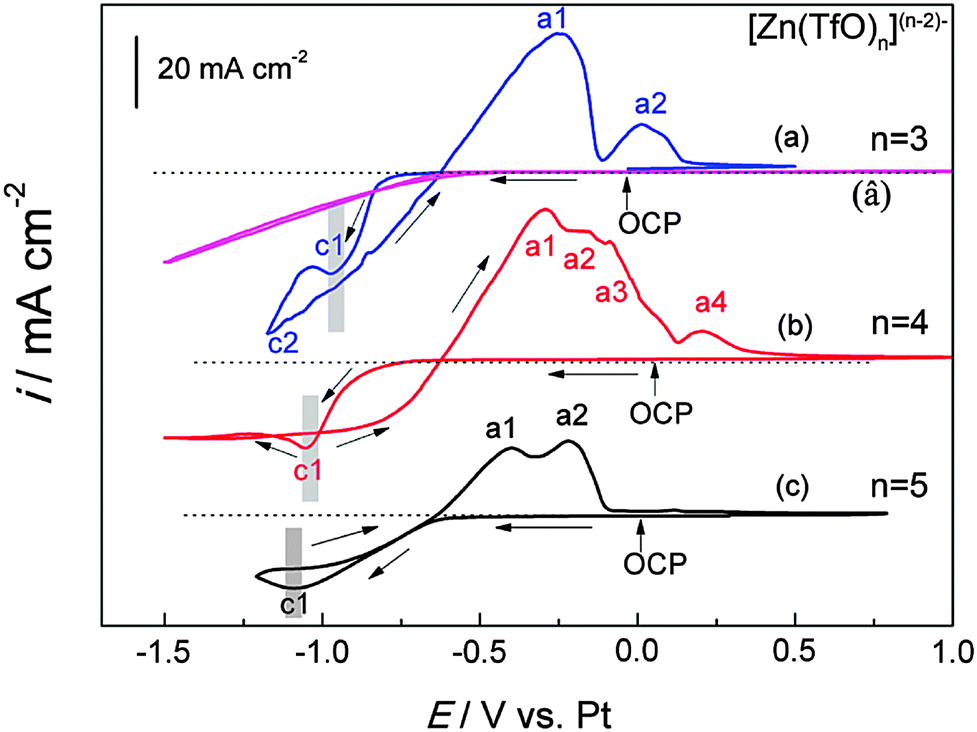 | ||
| Fig. 5 The cyclic voltammograms of pure [MIm]TfO (â), of 0.2 M Zn(TfO)2/[MIm]TfO (a), of 0.2 M Zn(TfO)2/[EMIm]TfO (b) and of 0.2 M Zn(TfO)2/[EMMIm]TfO (c), respectively, recorded on gold at 120 °C. Scan rate: 10 mV s−1. | ||
Therefore, [MIm]TfO electrolyte could be a promising solvent for zinc deposition. One concern about this liquid is its acidic nature and the evolution of hydrogen. However, it was reported that in dried protic ionic liquids the proton of the cation is not easily subject to deprotonation at room temperature and it was also show that lithium-ion batteries containing protic IL based electrolytes exhibit promising performance in terms of capacity and cycling stability and the battery materials shows no structural changes.39–42
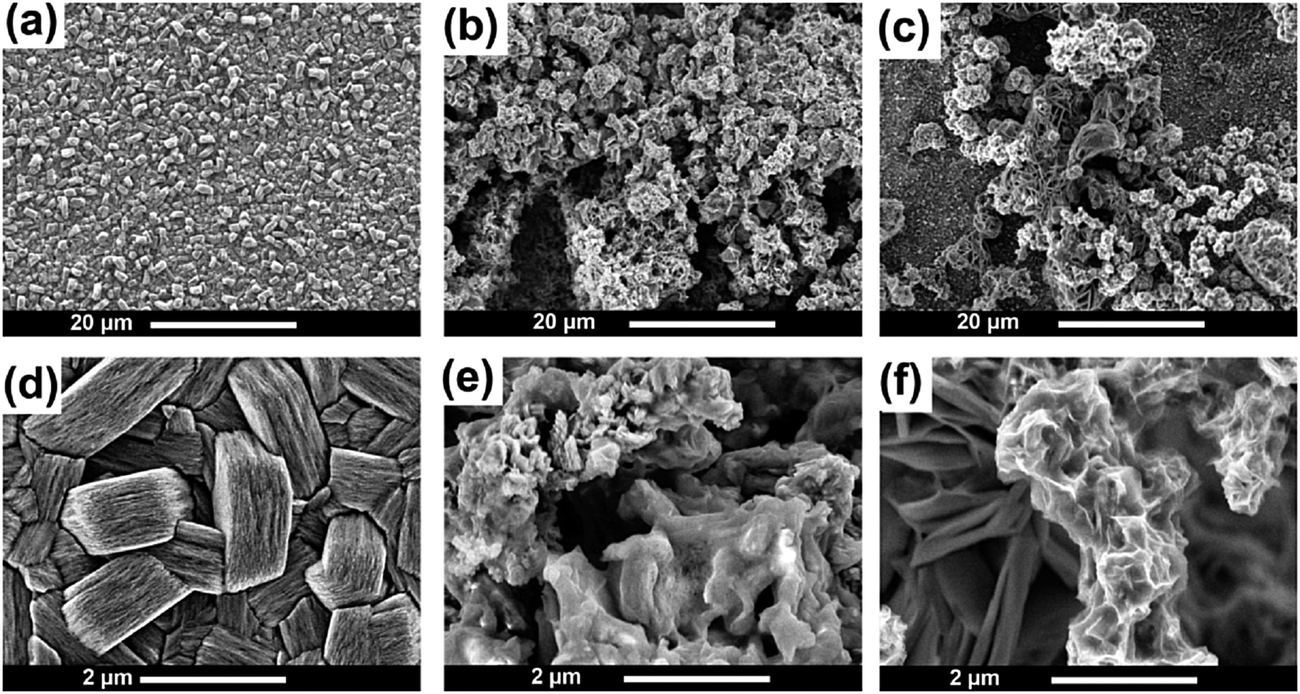
The potentiostatic electrodeposition of Zn from these electrolytes was performed on gold substrates at −0.95 V vs. Pt in [MIm]TfO, −1.05 V vs. Pt in [EMIm]TfO and −1.1 V vs. Pt in [EMMIm]TfO, respectively for 2 h at 120 °C, and the morphologies of the deposits are shown in Fig. 6. From [MIm]TfO, coarse and cubic Zn particles with sizes of approximately 10 μm are obtained (Fig. 6a and d). Rather hexagonal structured Zn with an average size of ∼ 5 μm was obtained in [EMIm]TfO (Fig. 6b and e). The deposits obtained in [EMMIm]TfO (Fig. 6c) show rather irregular and cauliflower-like agglomerates. At higher magnification (Fig. 6f), dense and uniform Zn deposits with particles size of several hundred nanometers can be seen. The particle size is remarkably influenced by varying the cation from [MIm]+ to [EMMIm]+, indicating a certain competition between nucleation and grain growth. Furthermore, [EMMIm]TfO is electrochemically more stable than [MIm]TfO and [EMIm]TfO, and the use of [EMMIm]TfO ionic liquids might provide long term stability, especially when the deposition process occurs at more negative potentials. The differences in morphology are likely due to the different zinc species present in the electrolyte and/or the adsorption of cations on the surface of the electrode, which influences the interfacial layer properties as well.
 | ||
| Fig. 6 SEM images of zinc deposits obtained from 0.2 M Zn(TfO)2/[MIm]TfO at −0.95 V for 2 h (a and d), from 0.2 M Zn(TfO)2/[EMIm]TfO at −1.05 V for 2 h (b and e) and from 0.2 M Zn(TfO)2/[EMMIm]TfO at −1.1 V for 2 h (c and f). | ||
The XRD patterns of the electrodeposited Zn obtained from these dried electrolytes on gold are shown in Fig. 7. All the patterns show diffraction peaks at 36.3°, 39.0° and 43.2°, arising from (002), (100), and (101) diffraction of hexagonal zinc (JCPDS File No. 04-0831). The diffraction peaks marked as black rectangle are corresponding to AuZn3 (JCPDS File No. 50-1336). The results reveal that Zn deposited in these electrolytes shows a preferred Zn orientation at (101) plane.
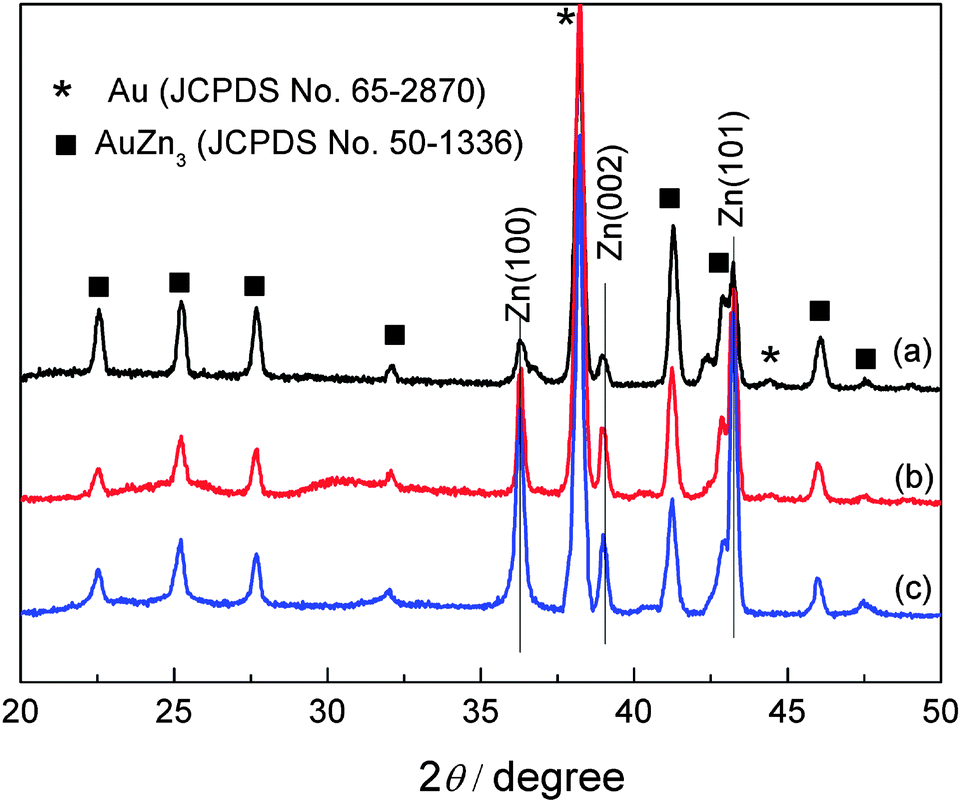 | ||
| Fig. 7 XRD patterns of zinc deposits obtained from 0.2 M Zn(TfO)2/[MIm]TfO (a), from 0.2 M Zn(TfO)2/[EMIm]TfO (b) and from 0.2 M Zn(TfO)2/[EMMIm]TfO (c). | ||
3.6 Electrochemical behavior of zinc from ionic liquid–water mixtures
Fig. 8 curve a shows the cyclic voltammogram of 0.2 M Zn(TfO)2/[MIm]TfO + 30 wt% water on gold at room temperature. The reduction peak centered at −1.67 V vs. Pt is ascribed to zinc deposition. Similar zinc reduction peak positions (centered at ∼−1.65 V) were observed in [EMIm]TfO and in [EMMIm]TfO (Fig. 8 curves b and c), respectively. In zinc salts/ILs + water mixtures, the viscosities of the electrolytes are in the same order and zinc species present in the electrolytes are also the same. Therefore, the zinc reduction occurs at the same potential in the investigated electrolytes. In all three cases, only one stripping peak was observed on the anodic branch of the cyclic voltammograms. The stripping peak is sharp and has the highest current density in [MIm]TfO–water mixtures, while the stripping peak is broad and has the lowest current density in [EMMIm]TfO–water mixtures. In addition, the onset of the stripping potential is shifted towards negative direction by varying the cations from [MIm]+ to [EMMIm]+. The differences in the stripping behaviors might be attributed to their different morphologies or due to interfacial layer properties. | ||
| Fig. 8 The cyclic voltammograms of 0.2 M Zn(TfO)2/[MIm]TfO + water (30 wt%) mixtures (a), of 0.2 M Zn(TfO)2/[EMIm]TfO + water (30 wt%) mixtures (b) and of 0.2 M Zn(TfO)2/[EMMIm]TfO + water (30 wt%) mixtures (c), respectively, recorded on gold at 120 °C. Scan rate: 10 mV s−1. | ||
Fig. 9 shows SEM images of the zinc deposits obtained at −1.65 V for 30 min at room temperature. Compact and dense zinc deposits were obtained from [MIm]TfO/water electrolytes (Fig. 9a and d). The zinc grains composed of stacked hexagonal plates, perpendicular to the substrate. The morphology then changes to a relatively rough and irregular structure in [EMIm]TfO–water mixtures (Fig. 9b). At higher magnification, the structure has a spongy-like appearance (Fig. 9e). A flake-like structure on the bottom with Zn agglomerates on the top was observed in [EMMIm]TfO–water mixtures (Fig. 9c and f). The differences in structures can be attributed to the change in the interfacial interaction in the presence of water.
 | ||
| Fig. 9 SEM images of zinc deposits obtained from 0.2 M Zn(TfO)2/[MIm]TfO + water (30 wt%) mixtures (a and d), from 0.2 M Zn(TfO)2/[EMIm]TfO + water (30 wt%) mixtures (b and e) and from 0.2 M Zn(TfO)2/[EMMIm]TfO + water (30 wt%) mixtures at −1.65 V for 30 min (c and f), respectively. | ||
The XRD patterns of Zn deposit obtained from different IL + water mixtures are shown in Fig. 10. All the patterns show diffraction peaks of hexagonal zinc (JCPDS File No. 04-0831) and of AuZn3 (JCPDS File No. 50-1336). For the deposits obtained from [MIm]TfO–water mixtures (Fig. 10 curve a), the XRD patterns show that the peak at 39.0° and 43.2° are the dominant peaks, indicating that the growth of Zn is preferentially oriented along the (002) and (101) plane. In Fig. 10 curves b and c, Zn deposits grow preferentially along the (101) plane. The changes in crystallographic orientation are probably due to the different interactions between ionic liquid–water mixtures and the substrate, originated by the water molecules present in the electrolytes, as these changes were not observed in dried ionic liquids. The ionic liquids may form different complexes with water, which can adsorb on the surface and can induce different growth mechanisms. More work is needed to reveal this assumption.
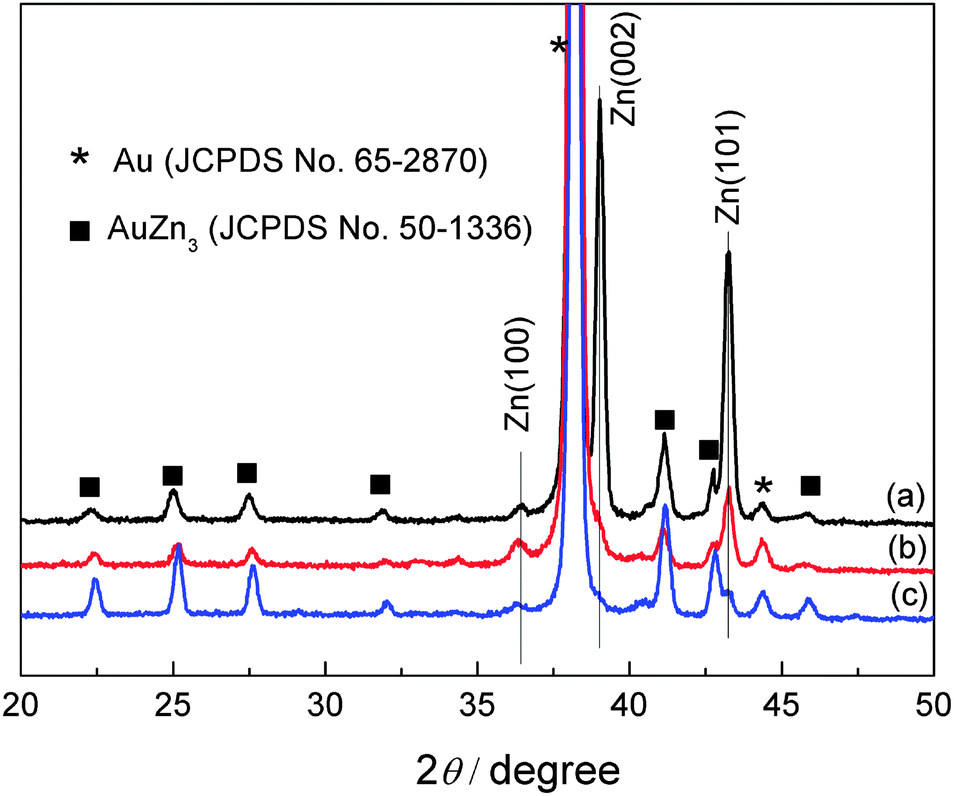 | ||
| Fig. 10 XRD patterns of zinc deposits obtained from 0.2 M Zn(TfO)2/[MIm]TfO + water (30 wt%) mixtures (a), from 0.2 M Zn(TfO)2/[EMIm]TfO + water (30 wt%) mixtures (b) and from 0.2 M Zn(TfO)2/[EMMIm]TfO + water (30 wt%) mixtures (c). | ||
4. Conclusion
In this paper, we investigated the influence of cations on the electrodeposition of zinc from dried ionic liquids and ionic liquid–water mixtures. The Far-IR spectra results show that the strength of interaction between cation and anion is in order of [MIm]TfO > [EMIm]TfO > [EMMIm]TfO. The Raman spectra show obvious differences in terms of solvation of Zn2+ ions in these ionic liquids electrolytes. The number of TfO− anions bound to each Zn2+ ion is 3.0 in 0.2 M Zn(TfO)2/[MIm]TfO, 3.8 in 0.2 M Zn(TfO)2/[EMIm]TfO and 5.1 in 0.2 M Zn(TfO)2/[EMMIm]TfO, respectively. The differences in the zinc species present in the electrolytes have a strong influence on their electrochemical performance and morphology of the deposits. In dried ionic liquids, the cyclic voltammograms reveal that the zinc deposition potential is shifted to more negative values by varying the cations from [MIm]+ to [EMMIm]+. The Zn deposits obtained from 0.2 M Zn(TfO)2/[MIm]TfO at 120 °C, exhibit a coarse and cubic morphology with particles size of approximately 10 μm. Hexagonal structured Zn was obtained and the average size of Zn particles reduced to ∼5 μm in [EMIm]TfO. Cauliflower-like agglomerates with particles size of several hundred nanometers was obtained in [EMMIm]TfO.In ionic liquid–water mixtures, the deposition of zinc occurs at almost the same potentials as a result of the presence of similar aqueous zinc species in these solutions, but different zinc morphology and phase orientation were observed. In the presence of water, the adsorption of ionic liquid–water complexes can occur at the surface and a modification of the Zn crystal growth takes place. Compact and dense zinc deposits were obtained [MIm]TfO–water mixtures. Zinc agglomerates and irregular structures were obtained in [EMIm]TfO–water and in [EMMIm]TfO–water mixtures. The XRD results revealed the preferred orientations.
Acknowledgements
Financial support by the BMBF project AKUZIL is gratefully acknowledged.References
- M. Armand, F. Endres, D. R. MacFarlane, H. Ohno and B. Scrosati, Nat. Mater., 2009, 8, 621–629 CrossRef CAS PubMed
.
- B. Scrosati, J. Hassoun and Y.-K. Sun, Energy Environ. Sci., 2011, 4, 3287–3295 CAS
- J. F. Wishart, Energy Environ. Sci., 2009, 2, 956–961 CAS
- A. P. Abbott and K. J. McKenzie, Phys. Chem. Chem. Phys., 2006, 8, 4265–4279 RSC
- F. Endres, M. Bukowski, R. Hempelmann and H. Natter, Angew. Chem., Int. Ed., 2003, 42, 3428–3430 CrossRef CAS PubMed
- S. Zhang, N. Sun, X. He, X. Lu and X. Zhang, J. Phys. Chem. Ref. Data, 2006, 35, 1475–1517 CrossRef CAS PubMed
- S. Tang, G. A. Baker and H. Zhao, Chem. Soc. Rev., 2012, 41, 4030–4066 RSC
- M.-J. Deng, P.-Y. Chen, T.-I. Leong, I. W. Sun, J.-K. Chang and W.-T. Tsai, Electrochem. Commun., 2008, 10, 213–216 CrossRef CAS PubMed
- A. P. Abbott, G. Frisch, J. Hartley and K. S. Ryder, Green Chem., 2011, 13, 471–481 RSC
- A. Wulf, K. Fumino and R. Ludwig, Angew. Chem., Int. Ed., 2010, 49, 449–453 CrossRef CAS PubMed
- K. Fumino, S. Reimann and R. Ludwig, Phys. Chem. Chem. Phys., 2014, 16, 21903–21929 RSC
- Y. Kohno and H. Ohno, Chem. Commun., 2012, 48, 7119–7130 RSC
- H. Niedermeyer, J. P. Hallett, I. J. Villar-Garcia, P. A. Hunt and T. Welton, Chem. Soc. Rev., 2012, 41, 7780–7802 RSC
- K. N. Marsh, J. A. Boxall and R. Lichtenthaler, Fluid Phase Equilib., 2004, 219, 93–98 CrossRef CAS PubMed
- K. A. Fletcher and S. Pandey, J. Phys. Chem. B, 2003, 107, 13532–13539 CrossRef CAS
- K. R. Seddon, A. Stark and M.-J. Torres, Pure Appl. Chem., 2000, 72, 2275 CrossRef CAS
- Y. Nakata, K. Kohara, K. Matsumoto and R. Hagiwara, J. Chem. Eng. Data, 2011, 56, 1840–1846 CrossRef CAS
- M. G. Freire, C. M. S. S. Neves, I. M. Marrucho, J. A. P. Coutinho and A. M. Fernandes, J. Phys. Chem. A, 2010, 114, 3744–3749 CrossRef CAS PubMed
- P. Bonhôte, A.-P. Dias, N. Papageorgiou, K. Kalyanasundaram and M. Grätzel, Inorg. Chem., 1996, 35, 1168–1178 CrossRef PubMed
- S. Trohalaki and R. Pachter, QSAR Comb. Sci., 2005, 24, 485–490 CAS
- C. Aguirre, L. Cisternas and J. Valderrama, Int. J. Thermophys., 2012, 33, 34–46 CrossRef CAS PubMed
- F. Yan, S. Xia, Q. Wang, Z. Yang and P. Ma, J. Chem. Thermodyn., 2013, 62, 196–200 CrossRef CAS PubMed
- H. Ohno and M. Yoshizawa, Solid State Ionics, 2002, 154–155, 303–309 CrossRef CAS
- O. O. Okoturo and T. J. VanderNoot, J. Electroanal. Chem., 2004, 568, 167–181 CrossRef CAS PubMed
- J. Jacquemin, P. Husson, A. A. H. Padua and V. Majer, Green Chem., 2006, 8, 172–180 RSC
- G. Yu, D. Zhao, L. Wen, S. Yang and X. Chen, AIChE J., 2012, 58, 2885–2899 CrossRef CAS PubMed
- D. R. MacFarlane, J. Golding, S. Forsyth, M. Forsyth and G. B. Deacon, Chem. Commun., 2001, 1430–1431 RSC
- G. Wang, W. Hou, F. Xiao, J. Geng, Y. Wu and Z. Zhang, J. Chem. Eng. Data, 2011, 56, 1125–1133 CrossRef CAS
- K. Tsunashima and M. Sugiya, Electrochem. Commun., 2007, 9, 2353–2358 CrossRef CAS PubMed
- J. Jeon, H. Kim, W. A. Goddard, T. A. Pascal, G.-I. Lee and J. K. Kang, J. Phys. Chem. Lett., 2012, 3, 556–559 CrossRef CAS
- T. J. Simons, P. C. Howlett, A. A. J. Torriero, D. R. MacFarlane and M. Forsyth, J. Phys. Chem. C, 2013, 117, 2662–2669 CAS
- M. G. Freire, A. R. R. Teles, M. A. A. Rocha, B. Schröder, C. M. S. S. Neves, P. J. Carvalho, D. V. Evtuguin, L. M. N. B. F. Santos and J. A. P. Coutinho, J. Chem. Eng. Data, 2011, 56, 4813–4822 CrossRef CAS
- H. Rodríguez and J. F. Brennecke, J. Chem. Eng. Data, 2006, 51, 2145–2155 CrossRef
- K. Fumino, T. Peppel, M. Geppert-Rybczynska, D. H. Zaitsau, J. K. Lehmann, S. P. Verevkin, M. Kockerling and R. Ludwig, Phys. Chem. Chem. Phys., 2011, 13, 14064–14075 RSC
- K. Fumino, A. Wulf and R. Ludwig, Angew. Chem., Int. Ed., 2008, 47, 3830–3834 CrossRef CAS PubMed
- C. M. Burba, N. M. Rocher and R. Frech, J. Phys. Chem. B, 2009, 113, 11453–11458 CrossRef CAS PubMed
- G. A. Giffin, A. Moretti, S. Jeong and S. Passerini, J. Phys. Chem. C, 2014, 118, 9966–9973 CAS
- Z. Liu, S. Zein El Abedin and F. Endres, ChemPhysChem, 2015, 16, 970–977 CrossRef CAS PubMed
- T. Vogl, S. Menne, R.-S. Kuhnel and A. Balducci, J. Mater. Chem. A, 2014, 2, 8258–8265 CAS
- A. Brandt, J. Pires, M. Anouti and A. Balducci, Electrochim. Acta, 2013, 108, 226–231 CrossRef CAS PubMed
- N. Böckenfeld, M. Willeke, J. Pires, M. Anouti and A. Balducci, J. Electrochem. Soc., 2013, 160, A559–A563 CrossRef PubMed
- S. Menne, J. Pires, M. Anouti and A. Balducci, Electrochem. Commun., 2013, 31, 39–41 CrossRef CAS PubMed
| This journal is © the Owner Societies 2015 |