 Open Access Article
Creative Commons Attribution 3.0 Unported Licence
X-ray spectroscopy characterization of azobenzene-functionalized triazatriangulenium adlayers on Au(111) surfaces†
Sandra
Ulrich
a,
Ulrich
Jung
b,
Thomas
Strunskus
c,
Christian
Schütt
a,
Andreas
Bloedorn
b,
Sonja
Lemke
b,
Eric
Ludwig
b,
Lutz
Kipp
b,
Franz
Faupel
c,
Olaf
Magnussen
b and
Rainer
Herges
*a
aInstitut für Organische Chemie, Christian-Albrechts-Universität Kiel, Otto-Hahn-Platz 4, 24118 Kiel, Germany. E-mail: rherges@oc.uni-kiel.de
bInstitut für Experimentelle und Angewandte Physik der Christian-Albrechts-Universität Kiel, Leibnizstraße 19, 24118 Kiel, Germany
cTechnische Fakultät der Christian-Albrechts-Universität Kiel, Kaiserstraße 2, 24143 Kiel, Germany
First published on 4th June 2015
Abstract
Triazatriangulenium (TATA) platform molecules allow the preparation of functionalized surfaces with well-defined lateral spacings of freestanding functional groups. Using scanning tunneling microscopy, synchrotron-based X-ray photoelectron spectroscopy, near edge X-ray absorption fine structure spectroscopy and complementary density functional theory calculations the chemical composition and orientational order of adlayers of functionalized azobenzene containing TATA platform molecules were characterized. According to these studies the molecules are chemically intact on the surface after self-assembly from solution and exhibit a well-defined adsorption geometry where the azobenzene units are oriented almost perpendicular to the surface.
Introduction
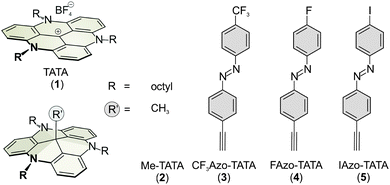
The functionalization of gold surfaces with switching units such as azobenzenes is of great interest for current surface science and has a wide range of applications.1–3 Azobenzene derivatives are one of the most frequently studied classes of switchable substances. The azobenzene functionality exhibits cis–trans isomerism.4 The thermodynamically stable trans isomer can be transformed to the cis isomer by irradiation with UV light of about 365 nm. Reisomerization to the trans isomer occurs upon irradiation with blue light of 435 nm or by thermal relaxation.5 Self-assembled adlayers of azobenzene-containing compounds on Au surfaces, in most cases basing on thiols, have been intensively studied.2,3,6We have introduced the so-called platform concept and implemented it using derivatives of the triazatriangulenium (TATA) ion (Fig. 1).7–13 The TATA platforms can be functionalized vertically at the center as well as laterally at the edges, providing a very versatile template. Adlayers of different TATA derivatives on well-defined Au(111) surfaces, mainly exhibiting an azobenzene functionality, have been intensively studied by scanning tunneling microscopy (STM), surface-enhanced Raman spectroscopy (SERS), X-ray photoelectron spectroscopy (XPS) and electrochemical methods (cyclic voltammetry).9 The TATA molecules form highly-ordered hexagonal adlayers, with the intermolecular distances controlled by the steric demand of the side groups attached at the nitrogen atoms of the platforms and the central functional groups. Based on these results, an adsorption geometry was proposed, where the platforms are lying flat on the surface and the central groups are oriented along the surface normal.
In addition to the above-mentioned structural characterization, we have demonstrated the photo-switching of a series of azobenzene-functionalized TATA adlayers on different gold substrates by electrochemical measurements (cyclic voltammetry and chronoamperometry),8,9 surface plasmon resonance spectroscopy (SPR),8,14 and infrared reflection absorption spectroscopy (PM-IRRAS).15 For the adlayers of all studied compounds, fast and highly reversible photoinduced isomerization reactions were identified. Surprisingly, the thermal cis–trans back-isomerization on these adlayers exhibits a half-life which is 4–5 orders of magnitude shorter than in solution.8,16 The decreased stability of the cis isomer could be explained by electronic coupling of the azobenzene moieties with the metal substrate. Note that the measurements in solution and the experiments on the surface are not directly comparable due to completely different chemical environments during the measurements. Despite the wealth of information, the molecular structure and vertical architecture of these adlayers still has not been unambiguously clarified. In particular, the vertical orientation of the functional groups has not been verified directly. Near-edge X-ray adsorption fine structure (NEXAFS) spectroscopy is an experimental method that can provide such data.
There are several examples of decoupled systems like azobenzene-functionalized alkanethiols, whose structures have been investigated by XPS and NEXAFS on gold surfaces.17,18 Azobenzenes lying flat on metal surfaces are also well studied by these measurements.19–21
Previous XPS results on functionalized TATA platform adlayers, obtained by us with an Al Kα X-ray source, already indicate that a monolayer of intact molecules can be adsorbed.9 But the limited resolution and the relatively poor signal-to-noise ratio only allowed a comparably superficial analysis. For example, it was not possible to distinguish between different carbon species.9 Here we present detailed synchrotron XPS data on these adlayers, which allow, in combination with results from NEXAFS experiments, a precise structural analysis of this kind of adlayers.
Results and discussion
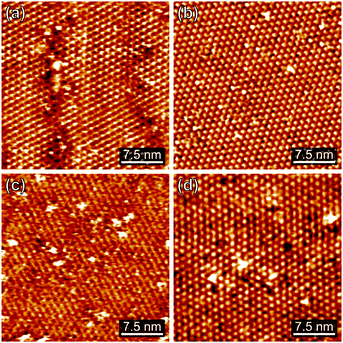
All molecules were characterized by STM, XPS and NEXAFS. These are on the one hand the bare TATA cation on the other hand the functionalized TATA platforms, as shown in Fig. 1.STM images of adlayers of the various TATA derivative discussed in this paper are shown in Fig. 2. The results for some species already have been published previously,10,12,13 but are also shown here again for direct comparison. All TATA derivatives form highly ordered hexagonal adlayers on the Au(111) surface. The measured lattice constants (Me-TATA: (12.2 ± 0.5) Å, CF3Azo-TATA: (12.7 ± 0.5) Å, FAzo-TATA: (12.1 ± 0.5) Å, IAzo-TATA: (12.7 ± 0.5) Å) are in good agreement with other STM results of different octyl-TATA derivatives and correspond to a commensurate  R 23.4° superstructure. The bright spots in the STM images are assigned to molecules adsorbed on top of the monolayer.12
XPS results
All XPS and NEXAFS measurements were performed for mono- and multilayers of the different TATA derivatives on Au(111) single crystals, prepared by adsorption of the respective target molecules onto the crystals from solutions. We note that in all measurements a small sulfur S 2p line indicative of elemental sulfur contamination is observed. This contamination is caused by the wet chemical preparation and flame annealing of the single crystal prior to adsorption of the molecules.In Fig. 3 a survey spectrum (a) and high resolution spectra of the C 1s (b) and N 1s (c) lines of the bare TATA cation monolayer are displayed. The survey spectrum shows a large increase on the high binding energy side caused by low energy secondary electrons. The most prominent signals are the Au 4f lines at 84 and 88 eV. Besides the Au 3d lines at 335 eV and 354 eV only the C 1s peak at 285 eV is clearly visible in the survey spectrum. Other expected lines exhibit only a very weak intensity because of the smaller number of atoms present in the monolayer. For that reason high resolution spectra of the different regions with acquisition times up to one hour have been measured (Table 1). The results of the F 1s region (Fig. 3d) show that in contrast to the multilayer (Fig. 4d) no fluorine is detectable for the monolayer. This demonstrates that the BF4− anion is not present in the TATA monolayer. We attribute this behavior to a strong interaction of the monolayer with the Au(111) substrate, leading to a screening of the positive charge of the cation and removal of the corresponding anion after adsorption of the monolayer.
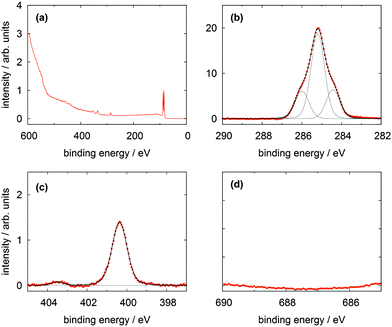 | ||
| Fig. 3 XP spectra of a TATA (1) monolayer on Au(111) showing (a) a survey spectrum, (b) the C 1s, (c) the N 1s and (d) the F 1s region. | ||
| Element | Binding energya/eV | Relative intensitya | Calc. stoichiometry | Assignment |
|---|---|---|---|---|
| a Only the direct fitting errors are given. The total error cannot be inferred in a straight-forward manner and is estimated to be 15%. | ||||
| C 1s | 284.4 ± 0.1 | 0.205 ± 0.007 | 0.209 | Arom. |
| 285.2 ± 0.1 | 0.600 ± 0.017 | 0.558 | Aliph. | |
| 286.0 ± 0.1 | 0.195 ± 0.006 | 0.233 | C–N | |
| N 1s | 400.4 ± 0.1 | 0.045 ± 0.001 | 0.070 | All N atoms |
| 403.5 ± 0.1 | 0.002 ± 0.001 | Shake up | ||
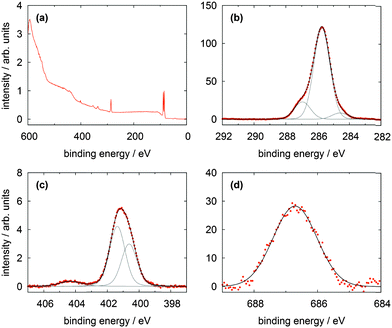 | ||
| Fig. 4 XP spectra of a TATA (1) multilayer on Au(111) showing (a) the survey spectrum, (b) the C 1s, (c) the N 1s and (d) F 1s lines. | ||
The high resolution C 1s and N 1s XP spectra of the TATA platform molecule 1 are displayed in Fig. 3b and c. The C 1s spectrum consists of one main line with two shoulders of about equal intensity located to higher and lower binding energies, respectively. The TATA platform consists of 43 carbon atoms and can be grouped as follows to roughly fit the XPS results: The main line at 285.2 eV originates from the 21 carbon atoms of the three octyl groups which are not directly bonded to nitrogen and the central carbon atom. The peak at a binding energy of 284.4 eV is assigned to the aromatic carbon atoms of the benzene group not bonded to nitrogen atoms (in total twelve carbon atoms). This peak is shifted to lower binding energy than expected. A possible explanation of this shift could be a charge-balancing effect of the gold surface. The calculation of the TATA platform on top of a gold cluster (PBE/SVP) shows that many of the molecular orbitals exhibit a significant overlap with orbitals from the gold surface atoms (see ESI†). The peak at 286.0 eV is due to the nine carbon atoms connected to the electron withdrawing nitrogen atoms. The binding energies of the different carbon atoms in the monolayer (Table 1) differs from that in the multilayer (Table 2) and lead thus to a different assignment of the fitted carbon lines (see Fig. 4). Besides slightly shifted binding energies also different relative intensities are observed for the multilayers. The surface effect and thus the charge compensation decreases with each layer. This results in a shift to higher binding energies and a change of the intensity distribution. The signal intensity of the twelve aromatic carbon atoms decreases and the main component intensity increases. Without interaction with the surface the aromatic and aliphatic carbon atoms of the molecules show a very similar binding energy resulting in an overlapping signal.
| Element | Binding energya/eV | Relative intensitya | Calc. stoichiometry | Assignment |
|---|---|---|---|---|
| a Only the direct fitting errors are given. The total error cannot be inferred in a straight-forward manner and is estimated to be 15%. | ||||
| C 1s | 284.6 ± 0.1 | 0.054 ± 0.004 | 0.209 | Arom. |
| 285.7 ± 0.1 | 0.795 ± 0.041 | 0.558 | Aliph. | |
| 287.0 ± 0.1 | 0.151 ± 0.008 | 0.233 | C–N | |
| N 1s | 400.6 ± 0.1 | 0.020 ± 0.001 | 0.070 | Monolayer |
| 401.4 ± 0.1 | 0.028 ± 0.001 | Multilayer | ||
| 404.4 ± 0.1 | 0.002 ± 0.001 | Shake up | ||
The N 1s signal of the monolayer shows a single line indicating that the three nitrogen atoms remain electronically equivalent upon adsorption on the Au(111) surface. The peak is located at 400.4 eV. This is higher than expected for a purely physisorbed secondary amine species and indicates a reduced electron density at the nitrogen atoms caused by a charge transfer from the nitrogen atoms to the gold surface. In addition, a shake-up feature located at 403.5 eV is clearly visible in the N 1s spectrum. The difference of 3.1 eV to the main line is equivalent to the calculated HOMO–LUMO gap of the free molecule (π–π* transition) of 3.2 eV (B3LYP/6-31G*). The thin multilayer N 1s signal shows two main lines at 400.6 and 401.4 eV and one shake up feature at 404.4 eV. The second main line is caused by the molecules not directly adsorbed on the gold surface which has negligible interactions with them. Therefore the cationic character of the molecule is preserved and the electron density on the nitrogen atoms is even lower than in the monolayer. This interpretation is supported by the presence of the counter ion (see Fig. 4d).
In Fig. 5 the XP spectra of a monolayer of the Me-TATA molecule on a Au(111) surface are shown. In contrast to the TATA cation the Me-TATA platform is already initially a non-ionic species and is a TATA platform functionalized by a methyl group, which has just a small additional contribution to the XP spectra of a TATA platform. Therefore, it can be regarded as a simplified model substance for the later discussed azobenzene-functionalized TATA platforms. The survey spectrum does not differ from the bare TATA cation survey spectrum. It also shows the signals from the substrate and the C 1s signal. The high resolution spectra of the C 1s consists of one main signal at 284.6 eV and only one additional signal at 285.4 eV, which is caused by nine carbon atoms directly connected to nitrogen. The contributions of the twelve aromatic and of the 23 aliphatic carbon atoms not bonded to nitrogen coincide because the adsorbed molecules are charge-neutral unlike the bare TATA cation. Therefore the interaction of the cation with the charge equalizing metal surface does not exist and the line shape is changed. The N 1s signal arises from the three equivalent nitrogen atoms and is centered at 399.5 eV (Table 3). This shift of the binding energy compared to the TATA cation is in good agreement with the complete lack of a positive charge in the Me-TATA platform. In this case the assignments of the different carbon and nitrogen atoms and their relative intensities of the monolayer are comparable to those of the multilayer. Consequently, this model system reflects the behavior of an uncharged TATA platform. This is necessary to interpret more complex systems such as azobenzene-functionalized TATA platform molecules.
 | ||
| Fig. 5 XP spectra of a Me-TATA (2) monolayer on Au(111) showing (a) the survey spectrum, (b) the C 1s, and (c) the N 1s lines. | ||
| Element | Binding energya/eV | Relative intensitya | Calc. stoichiometry | Assignment |
|---|---|---|---|---|
| a Only the direct fitting errors are given. The total error cannot be inferred in a straight-forward manner and is estimated to be 15%. | ||||
| C 1s | 284.6 ± 0.1 | 0.842 ± 0.060 | 0.795 | Arom. + aliph. |
| 285.4 ± 0.1 | 0.158 ± 0.016 | 0.205 | C–N | |
| N 1s | 398.9 ± 0.1 | 0.052 ± 0.004 | 0.068 | All N atoms |
It is known from previous STM investigations that azobenzene-functionalized TATA molecules without a headgroup on the azobenzene unit tend to form bilayers, while derivatives with a headgroup attached to the azobenzene form better defined monolayers.12 We therefore focused on the latter type of molecules. As additional XPS marker groups, fluorine, trifluoromethyl, and iodine were used to modify the azobenzene moiety.
The two fluorine terminated molecules gave rather similar XPS results except for the differences caused by the endgroups themselves. Therefore only the results of the CF3-functionalized derivative are discussed in detail as a typical representative of the complete series of functionalized TATA platform molecules (the results for all other adlayers can be found in the ESI†).
In Fig. 6 the XP spectra of the CF3Azo-TATA platform are shown. In the survey spectrum displayed in Fig. 6a a noticeable larger secondary electron background and weaker gold lines are found. This is attributed to the increased thickness of the adlayer (see the calculated values for the different adlayers summarized in Table 5), which leads to an attenuation of the gold lines and a more effective creation of slow electrons. Again as for the other platforms high resolution C 1s and N 1s spectra were measured. In the C 1s signal all carbon atoms are essentially located in the main line at 284.5 eV, except the carbon atoms bonded to the nitrogen atoms located in the peak at 285.5 eV and the aliphatic carbon atom bonded to three fluorine atoms centered at 292.8 eV. This is in good agreement with the results of the Me-TATA molecule. The carbon atoms of the azobenzene unit coincide with the carbon atoms of the platform. This is also expected because of their comparable chemical and electronical environments. The stoichiometry of the different carbon species correlates with the theoretical values.
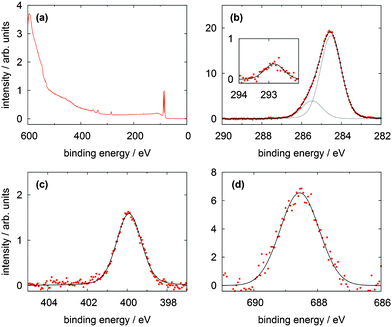 | ||
| Fig. 6 XP spectra of a CF3Azo-TATA (3) monolayer on Au(111) showing (a) the survey spectrum, (b) the C 1s, (c) the N 1s and (d) the F 1s lines. | ||
The N 1s line is broadened because of the signals of the three nitrogen atoms of the TATA platform and the signals of the two nitrogen atoms of the azobenzene units show a strong overlap and cannot be resolved energetically. In analogy to the Me-TATA platform the N 1s line is shifted to lower binding energies at 399.9 eV (Table 4).
| Element | Binding energya/eV | Relative intensitya | Calc. stoichiometry | Assignment |
|---|---|---|---|---|
| a Only the direct fitting errors are given. The total error cannot be inferred in a straight-forward manner and is estimated to be 15%. | ||||
| C 1s | 284.5 ± 0.1 | 0.809 ± 0.063 | 0.793 | Arom. + aliph. |
| 285.5 ± 0.1 | 0.175 ± 0.015 | 0.190 | C–N | |
| 292.8 ± 0.1 | 0.016 ± 0.002 | 0.017 | C–F | |
| N 1s | 399.9 ± 0.1 | 0.070 ± 0.005 | 0.086 | All N atoms |
| F 1s | 688.6 ± 0.1 | 0.126 ± 0.031 | 0.052 | All F atoms |
| Substance | d max/nm | d exp/nm |
|---|---|---|
| TATA (1) | 0.57–0.93 | 0.78 |
| Me-TATA (2) | 0.66–0.93 | 0.72 |
| CF3Azo-TATA (3) | 1.99 | 1.19 |
| FAzo-TATA (4) | 1.84 | 1.31 |
| IAzo-TATA (5) | 2.01 | 1.01 |
Fig. 6d shows that a clear F 1s line can be observed indicative of the three fluorine atoms. The presence of the marker atom or group (in this case CF3) provides clear evidence for the adsorption of the intact molecule. Trifluoromethyl marker groups are often reported in literature, but problems with radiation damage are sometimes described.17,18,22 In our experiments no changes in the measured spectra with time were observed, indicating that beam damage is negligible. The used beamline has a comparatively small photon flux on a large spot, which helps to reduce radiation damage significantly.18
The analysis of the XP spectra of all investigated molecules further show that different to multilayers almost no water is co-adsorbed with the monolayer. This can be already seen by the absence of a line in the O 1s region around 532 eV in the survey spectra.
Due to the geometric structure of the molecules on the gold surface and the very high surface sensitivity of the XPS measurements it is not expected that the stoichiometric ratios will fit exactly. Depending on the location of an atom relative to other atoms its XPS signal can be more or less attenuated by elastic or inelastic scattering of the photoelectrons on surrounding atoms. The hydrocarbon side groups are expected to be not completely flat on the surface, rather they stick out of the surface layer and can even cover atoms of the neighboring molecules. Hence they could also contribute to scattering effects and therefore could influence the observed intensity ratios, for example between carbon and nitrogen. Furthermore, the mainly perpendicularly oriented azobenzene unit (see below) should lead to signal attenuation from lower lying atoms, whereas the signal of the headgroup should be not attenuated. On the other hand due to the wide spacing of the azobenzene units the attenuation cannot be simply estimated by assuming a homogeneous monolayer with a well-defined electron mean free path and the exact attenuation will depend on the local conformation of the adsorbed molecules on the Au(111) surface and is thus very hard to be taken into account. For these reasons it is not surprising that the stoichiometry between the carbon and the nitrogen atoms in the mono- and the multilayer does not fit exactly. The nitrogen signal shows a lower intensity than expected. Furthermore, after background removal, a broad feature at high binding energy in the N 1s spectra appears in some monolayer samples (FAzo-TATA and IAzo-TATA). This could be attributed to a π–π* shake-up which is expected for conjugated aromatic systems. However, due to its apparently very low intensity and inherently broad lineshape it is generally not well distinguishable from the background and is frequently not observable after background subtraction. It was thus only included in the fitting process when a significant signal remained on the high binding energy side after background removal.
The ratio of fluorine to carbon in the monolayers shows a too large fluorine value compared to the stoichiometric value which is attributed to the negligible attenuation of the fluorine signal headgroup (see above). In contrast, the multilayers exhibit a slightly too small fluorine content, because the polar groups are expected to be located below the surface to reduce the surface energy (in the physisorbed multilayer the molecules can orient themselves in a way that the unpolar hydrocarbon side groups will be located on the surface). Note that the quantitative analysis of multilayers is even more difficult because they show typically a very inhomogeneous thickness distribution as well as a much higher degree of impurities, e.g. water. In addition, solvent molecules could be trapped in thicker layers.
The thickness of the adlayers can be roughly estimated from the ratios of the relative intensities of the C 1s/Au 4f7/2 signals and a reference substance (here dodecylthiol with a known thickness of 1.7 ± 0.1 nm23). Table 5 shows the determined thickness of all discussed monolayers. Since the arrangement of the alkyl chains is not exactly known, a range is given for the bare cation and the Me-TATA platform, which represents the lower and upper theoretically possible adlayer thickness (see ESI† for details). The adlayer thickness of a TATA and a Me-TATA monolayer determined by XPS is in good agreement with the theoretical range. The calculated heights of azobenzene-TATA platforms are given by the distance from the plane of the gold surface atoms to the highest atom of the headgroup of the free molecule. The exact arrangement of the alkyl chains can be neglected, because the azobenzene group on top of the platform is higher than the maximal height of the upstanding alkyl chain. The obtained thickness values for the adlayers of these functionalized TATA molecules are clearly higher than for the bare platforms. However, in comparison to the calculated heights, they are lower than expected. This is likely caused by the lower packing density of TATA molecules and the corresponding low density of the vertical functional groups on surfaces compared to dodecylthiol SAMs, which should lead to a systematic underestimation of the adlayer thickness. All in all the values are (within the ∼25% error of the thickness estimation) fully consistent with the presence of intact and commensurable monolayers.
NEXAFS results
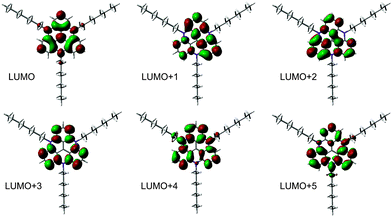
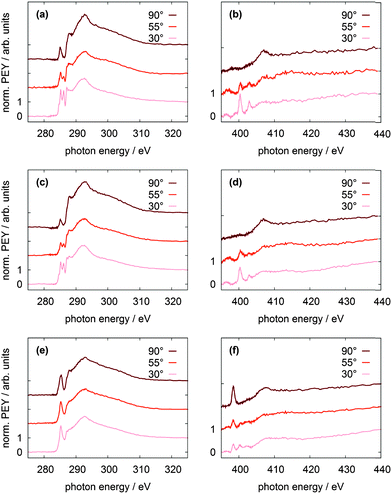
NEXAFS spectra have been measured at the carbon and nitrogen K-edges for monolayers and multilayers on Au(111) single crystals of all discussed TATA platforms. To assign the various π* resonances, DFT calculations of the free molecules were performed (B3LYP/6-31G*). The calculations do not take into account the presence of the core-hole in the NEXAFS excited state, the interaction between the molecule and the surface, therefore they can only give rough estimates for the excited state orbitals and the energy differences between different NEXAFS resonances. The contour plots of the lowest unoccupied molecular orbital (LUMO) up to the LUMO+5 of the bare TATA platform are shown in Fig. 7.The NEXAFS spectra of the bare TATA cation are shown in Fig. 8a and b. The C K-edge spectrum of the TATA platform monolayer, shown in Fig. 8a, exhibits four pre-edge π* resonances. Above the edge several broad σ* resonances can be observed, the most pronounced one located at 293 eV. The first, very small π* resonance located at 284.7 eV can be assigned to the LUMO transition. The contour plot shows that carbon and nitrogen are similarly involved in this molecular orbital. This resonance exhibits a clear angular dependency, i.e. it decreases at larger angles of incidence. The second π* resonance located at 285.2 eV can be assigned to the degenerated LUMO+1 and LUMO+2. The intensity of this resonance decreases at larger angles as well, but doesn't vanish completely. There is a significant intensity left at 90°, which may be caused by distortion of the molecular orbitals due to the adsorption process on the gold surface. The third π* resonance at 286.1 eV can be attributed to LUMO+3 and seems to vanish completely at 90°. The last π* resonance located at 287.0 eV can be assigned to the LUMO+4/+5 which are also degenerated. Solely on the basis of the carbon edge the orientation cannot be clearly considered to be planar on the surface, because of the distinct intensities remaining in the 90° spectra. However, since NEXAFS probes the transition dipole moment into unoccupied orbitals there could also be an effect of the changes at these orbitals due to the interaction with the gold surfaces, e.g. a distortion of the dipole orientation of the orbitals. Another contribution could originate from the adsorption of molecules in a tilted configuration at defects (step edges etc.). The N K-edge NEXAFS spectra provide more extensive information about the orientation. The counter plots of LUMO+1, LUMO+2, and LUMO+3 show that the heterocyclic nitrogen has no influence on these orbitals. Only LUMO and LUMO+4/+5 transitions include the nitrogen atoms. At the N K-edge these two π* resonances located at 400.3 eV and 403.0 eV are both observed in the monolayer (Fig. 8b) and the multilayer (see ESI†). They also exhibit a strong angular dependence with vanishing intensity at 90°. The orientation angles of the molecular orbitals (parallel to the surface) as determined from fitting are shown in Table 6. These angles indicate that the nitrogen-containing part of the TATA platform adsorbs almost flat on the surface.
| Resonance | C 1s (Δ) | Angle | N 1s (Δ) | Angle | Δ calc. |
|---|---|---|---|---|---|
| LUMO | 284.7 (0.0) | 15.3 ± 25.8 | 400.3 (0.0) | 10.5 ± 11.8 | 0.0 |
| LUMO+1/+2 | 285.2 (0.5) | 32.0 ± 1.7 | 1.3 | ||
| LUMO+3 | 286.1 (1.4) | 14.2 ± 4.2 | 1.7 | ||
| LUMO+4/+5 | 287.0 (2.3) | 23.6 ± 8.3 | 403.0 (2.7) | 22.9 ± 4.4 | 3.0 |
The C K-edge NEXAFS spectrum of the Me-TATA platform (Fig. 8c) is similar to that of the bare TATA cation. There are no significant differences between the spectra, suggesting that the TATA cation is not adsorbed as a pure cation onto the gold surface. This is supported by the N K-edge spectra of both platforms, which also are very similar. Furthermore, these observations are in good agreement with the XPS results (see above), which clearly indicate that the BF4− anions are not coadsorbed with the TATA monolayer. For a more detailed physical interpretation of this observation one needs to consider that both XPS and NEXAFS measurements start with the creation of a core hole and thus may be affected by significant final state effects. Specifically, charge transfer from the gold surface to the TATA platform may be caused by the creation of a core hole, leading to an apparent reduction in larger cationic character.
The only difference between TATA and Me-TATA platforms in the NEXAFS analysis is the assignment of the resonances to the individual calculated LUMOs of the free molecule. In functionalized TATA platforms the LUMOs cannot be resolved unambiguously. The spectra and the calculated molecular orbitals are shown in the ESI.†
The C K-edge of the CF3Azo-TATA (Fig. 8e) shows just one broadened π* resonance. By fitting this signal, three resonances could be identified. The first π* resonance is located at 284.3 eV, the second at 285.3 eV and the third at 286.5 eV (Table 7). The calculated orbitals are shown in Fig. 9. The assignment of the observed resonances to the calculated molecular orbitals of functionalized TATA platforms is more difficult than in the case of the bare TATA cation. Since the chemical shifts of the different transitions are very similar, there is a large overlap. Only the transition to the LUMO can be assigned. LUMO+1 to LUMO+2 and LUMO+3 to LUMO+5 cannot be individually resolved. In addition, the expected surface effect, causing distortions of the molecular orbitals, further complicates the assignment.
| Resonance | C 1s (Δ) | Angle | N 1s (Δ) | Angle |
|---|---|---|---|---|
| π1 | 284.3 (0.0) | 45.1 ± 3.4 | 398.5 (0.0) | 83.6 ± 16.4 |
| π2 | 285.3 (1.0) | 53.4 ± 2.0 | 400.4 (1.9) | 13.5 ± 6.6 |
| π3 | 286.5 (2.2) | 43.4 ± 0.1 | — | |
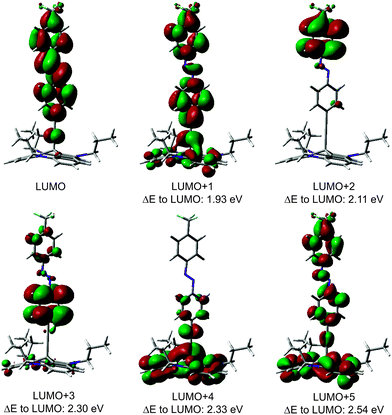 | ||
| Fig. 9 Contour plots of LUMO up to LUMO+5 transitions of the CF3Azo-TATA platform with calculated energies given as differences to the LUMO transition (B3LYP/6-31G*). | ||
The measurements with different angles of incidence indicate an angular dependency, where the intensity slightly decreases at an angle of 90°. The intensity at 90° is much higher than the one of the TATA platform without an azobenzene unit. This can be explained by the overlap of the π* resonances of the flat lying TATA platform and the perpendicular standing azobenzene unit. In this case it is impossible to obtain exact information about the orientation of the molecule on the surface. The spectrum of the N K-edge of the CF3Azo-TATA platform (Fig. 8f) exhibits two π* resonances. The calculations show that for the LUMO only the nitrogen atoms of the azobenzene unit are involved, but not those of the platform. A transition to the LUMO should appear in the first resonance. In addition, the energy position of the first π* resonance corresponds well to the characteristic π* resonance reported in the literature for azobenzene units,19–21 and is thus with high certainty assigned to a N 1s–π* transition of the azobenzene unit. The intensity of this resonance depends strongly on the angle of the incident polarized X-ray beam. Note that variation of the angle of incidence causes a change of the direction of the electric field vector of the incident polarized light relative to the direction of the transition dipole moment of the excitation from the N 1s core hole to the LUMO. From a quantitative analysis of the data an angle of 84 ± 16° between the molecular axis of the azobenzene groups and the surface is obtained, indicating that the azobenzene unit is standing perpendicular to the surface. The second, very small resonance originates from the platform nitrogens and shows the same polarization as observed for the pure platform molecule.
Comparing the different azobenzene-TATA molecules there is a clear similarity of the observed resonances. The energy positions of the observed resonances are in good agreement with the calculated values. The C K-edges are very similar to each other indicating a similar electronic structure of the different azobenzene TATA platforms. But the strong overlap of resonances from the platform and the azobenzene unit does not allow a clear statement about the orientation of the molecules relative to the surface. In contrast, the LUMO resonance at the N K-edge located only on the azobenzene unit indicates an almost perpendicular standing azobenzene unit.
Experimental
Synthesis and adlayer preparation
TATA platform synthesis11,24 (for Me-TATA platform see ESI†) and monolayer preparation10 has been described in detail in our previous publications. All compounds were characterized by NMR and mass spectroscopy and exhibit a purity of >99%.Au(111) single crystals with surface diameters of 12 mm, oriented within 0.3° (MaTecK) were employed as substrates. The crystals were annealed in a butane gas flame for 5 min. For preparation of the monolayers the cleaned substrates were immersed into solutions of the TATA molecules in ethanol (TATA cation) or toluene (functionalized TATA platforms) (Merck, p.a.) with concentrations of 1 to 100 μmol for 30 to 60 min. Typically, the preparation was carried out at room temperature, but in some experiments the solutions were kept at 80 °C during immersion to increase the surface mobility of the adsorbate molecules. Afterwards, excess TATA molecules were removed by immersing the adlayer-modified substrates for several seconds to 15 min into the pure solvent, which was again heated in some experiments. For multilayer preparation 50 to 200 μl of 100 μmol solutions of the TATA molecules, corresponding to 25 to 100 ideal TATA monolayers were dried on the substrates surfaces. Finally, the samples were dried under ambient conditions, transferred to the beamline in a clean, airtight container, and directly afterwards introduced into the experimental setup.
Instrumentation
The measurements were performed at the BESSY II synchrotron radiation facility at the HE-SGM beamline. The energy resolution ΔE/E of the used beamline setup is ∼1/800, corresponding to a resolution in the range of 350–700 meV in the mainly used photon energy range from 280–540 eV. The incoming light shows a linear polarization of 0.91 as previously determined with a HOPG sample.25 The polarization direction can be varied by rotating the sample around the polar axis of the manipulator. The XPS measurements were performed using a hemispherical VG Scienta R3000 photoelectron analyzer in a normal emission geometry. To record the NEXAFS data a partial electron yield setup was used, using retarding voltages of −150 V and −250 V for measurements of the C K and N K absorption edges, respectively.Analysis
 | (1) |
Conclusions
Adlayers of the Triazatriangulenium (TATA) cation and its azobenzene-functionalized derivatives on Au(111) were characterized by synchrotron-based X-ray photoelectron spectroscopy (XPS) and near edge X-ray absorption fine structure (NEXAFS). All these adlayers exhibit a well-defined molecular arrangement with a highly ordered hexagonal structure with commensurate lattice parameters according to STM measurements. The quantitative XPS analysis allows an assignment of the individual carbon and nitrogen species, which is in rather good agreement with the expectations. Fluorine or iodine head groups could be detected as well. The assignment of the NEXAFS resonances was supported by DFT calculations. Although the C K-edge spectra of all molecules are not very conclusive with respect to the orientation of the molecule on the surface, the first N K-edge resonance, which can be assigned to the LUMO located solely on the azobenzene unit clearly indicates a perpendicular standing azobenzene unit. In summary, the measurements show that this novel class of molecules adsorb intact on the surface from solution and in a well-defined geometry with the central functional groups oriented along the surface normal.Acknowledgements
We gratefully acknowledge financial support by Deutsche Forschungsgemeinschaft via Sonderforschungsbereich 677. We further thank Christof Wöll (KIT, Karlsruhe) for providing the Prevac endstation and the HE-SGM CRG as well as the BESSY staff for technical support of the XPS and NEXAFS measurements.References
- (a) V. Balzani, A. Credi and M. Venturi, ChemPhysChem, 2008, 9, 202–220, DOI:10.1002/cphc.200700528; (b) W. R. Browne and B. L. Feringa, Annu. Rev. Phys. Chem., 2009, 60, 407–428, DOI:10.1146/annurev.physchem.040808.090423; (c) K. Tamada, H. Akiyama, T.-X. Wei and S.-A. Kim, Langmuir, 2003, 19, 2306–2312, DOI:10.1021/la0258493; (d) V. Ferri, M. Elbing, G. Pace, M. D. Dickey, M. Zharnikov, P. Samorì, M. Mayor and M. A. Rampi, Angew. Chem., Int. Ed., 2008, 47, 3407–3409, DOI:10.1002/anie.200705339.
- S. Krakert and A. Terfort, Aust. J. Chem., 2010, 63, 303 CrossRef CAS.
- P. Tegeder, J. Phys.: Condens. Matter, 2012, 24, 394001 CrossRef PubMed , http://stacks.iop.org/0953-8984/24/i=39/a=394001.
- G. S. Hartley, J. Chem. Soc., 1938, 633–642, 10.1039/JR9380000633.
- F. Hamelmann, U. Heinzmann, U. Siemeling, F. Bretthauer and J. Vor der Brüggen, Appl. Surf. Sci., 2004, 222, 1–5 CrossRef CAS , http://www.sciencedirect.com/science/article/pii/S0169433203010031.
- (a) M. Elbing, A. Błaszczyk, C. von Hänisch, M. Mayor, V. Ferri, C. Grave, M. A. Rampi, G. Pace, P. Samorì, A. Shaporenko and M. Zharnikov, Adv. Funct. Mater., 2008, 18, 2972–2983, DOI:10.1002/adfm.200800652; (b) T. Weidner, F. Bretthauer, N. Ballav, H. Motschmann, H. Orendi, C. Bruhn, U. Siemeling and M. Zharnikov, Langmuir, 2008, 24, 11691–11700, DOI:10.1021/la802454w; (c) R. Klajn, Pure Appl. Chem., 2010, 82, 2247–2279 CrossRef; (d) T. Kondo and K. Uosaki, J. Photochem. Photobiol., C, 2007, 8, 1–17 CrossRef CAS , http://www.sciencedirect.com/science/article/pii/S138955670700024X; (e) P. S. Weiss, Acc. Chem. Res., 2008, 41, 1772–1781, DOI:10.1021/ar8001443; (f) U. Jung, O. Filinova, S. Kuhn, D. Zargarani, C. Bornholdt, R. Herges and O. Magnussen, Langmuir, 2010, 26, 13913–13923, DOI:10.1021/la1015109; (g) V. Ferri, M. Elbing, G. Pace, M. D. Dickey, M. Zharnikov, P. Samorì, M. Mayor and M. A. Rampi, Angew. Chem., Int. Ed., 2008, 47, 3407–3409, DOI:10.1002/anie.200705339.
- (a) U. Jung, B. Baisch, D. Kaminski, K. Krug, A. Elsen, T. Weineisen, D. Raffa, J. Stettner, C. Bornholdt, R. Herges and O. Magnussen, J. Electroanal. Chem., 2008, 619–620, 152–158 CrossRef CAS , http://www.sciencedirect.com/science/article/pii/S0022072808001484; (b) U. Jung, M. Müller, N. Fujimoto, K. Ikeda, K. Uosaki, U. Cornelissen, F. Tuczek, C. Bornholdt, D. Zargarani, R. Herges and O. Magnussen, J. Colloid Interface Sci., 2010, 341, 366–375 CrossRef CAS PubMed , http://www.sciencedirect.com/science/article/pii/S0021979709012533; (c) S. Lemke, S. Ulrich, F. Claußen, A. Bloedorn, U. Jung, R. Herges and O. M. Magnussen, Surf. Sci., 2015, 632, 71–76 CrossRef CAS , http://www.sciencedirect.com/science/article/pii/S0039602814002611.
- U. Jung, J. Kubitschke, R. Herges and O. Magnussen, Electrochim. Acta, 2013, 112, 869–880 CrossRef CAS , http://www.sciencedirect.com/science/article/pii/S0013468613012292.
- U. Jung, S. Kuhn, U. Cornelissen, F. Tuczek, T. Strunskus, V. Zaporojtchenko, J. Kubitschke, R. Herges and O. Magnussen, Langmuir, 2011, 27, 5899–5908, DOI:10.1021/la104654p.
- B. Baisch, D. Raffa, U. Jung, O. M. Magnussen, C. Nicolas, J. Lacour, J. Kubitschke and R. Herges, J. Am. Chem. Soc., 2008, 131, 442–443, DOI:10.1021/ja807923f.
- J. Kubitschke, C. Näther and R. Herges, Eur. J. Org. Chem., 2010, 5041–5055, DOI:10.1002/ejoc.201000650.
- S. Kuhn, B. Baisch, U. Jung, T. Johannsen, J. Kubitschke, R. Herges and O. Magnussen, Phys. Chem. Chem. Phys., 2010, 12, 4481–4487, 10.1039/B922882A.
- S. Kuhn, U. Jung, S. Ulrich, R. Herges and O. Magnussen, Chem. Commun., 2011, 47, 8880–8882, 10.1039/C1CC12598B.
- M. Müller, U. Jung, V. Gusak, S. Ulrich, M. Holz, R. Herges, C. Langhammer and O. Magnussen, Langmuir, 2013, 29, 10693–10699, DOI:10.1021/la401825f.
- H. Jacob, S. Ulrich, U. Jung, S. Lemke, T. Rusch, C. Schutt, F. Petersen, T. Strunskus, O. Magnussen, R. Herges and F. Tuczek, Phys. Chem. Chem. Phys., 2014, 16, 22643–22650, 10.1039/C4CP03438D.
- U. Jung, C. Schütt, O. Filinova, J. Kubitschke, R. Herges and O. Magnussen, J. Phys. Chem. C, 2012, 116, 25943–25948, DOI:10.1021/jp310451c.
- R. Schmidt, E. McNellis, W. Freyer, D. Brete, T. Gießel, C. Gahl, K. Reuter and M. Weinelt, Appl. Phys. A: Mater. Sci. Process., 2008, 93, 267–275, DOI:10.1007/s00339-008-4829-z.
- D. Brete, D. Przyrembel, C. Eickhoff, R. Carley, W. Freyer, K. Reuter, C. Gahl and M. Weinelt, J. Phys.: Condens. Matter, 2012, 24, 394015 CrossRef PubMed , http://stacks.iop.org/0953-8984/24/i=39/a=394015.
- E. Ludwig, T. Strunskus, S. Hellmann, A. Nefedov, C. Woll, L. Kipp and K. Rossnagel, Phys. Chem. Chem. Phys., 2013, 15, 20272–20280, 10.1039/C3CP53003E.
- E. R. McNellis, C. Bronner, J. Meyer, M. Weinelt, P. Tegeder and K. Reuter, Phys. Chem. Chem. Phys., 2010, 12, 6404–6412, 10.1039/C001978J.
- R. Schmidt, S. Hagen, D. Brete, R. Carley, C. Gahl, J. Dokic, P. Saalfrank, S. Hecht, P. Tegeder and M. Weinelt, Phys. Chem. Chem. Phys., 2010, 12, 4488–4497, 10.1039/B924409C.
- (a) S. Frey, K. Heister, M. Zharnikov and M. Grunze, Phys. Chem. Chem. Phys., 2000, 2, 1979–1987, 10.1039/A910314G; (b) M. Zharnikov, S. Frey, K. Heister and M. Grunze, Langmuir, 2000, 16, 2697–2705, DOI:10.1021/la991034r.
- T. Kondo, M. Yanagida, K. Shimazu and K. Uosaki, Langmuir, 1998, 14, 5656–5658, DOI:10.1021/la980517c.
- (a) Bo. W. Laursen and F. C. Krebs, Chem. – Eur. J., 2001, 7, 1773–1783, DOI:10.1002/1521-3765(20010417)7:8<1773::AID-CHEM17730>3.0.CO;2-F; (b) T. Tellkamp, Dissertation: Synthese neuer Photoschalter zur Funktionalisierung von Triazatriangulenen auf Goldoberflächen, 2014 Search PubMed.
- F. Chesneau, H. Hamoudi, B. Schüpbach, A. Terfort and M. Zharnikov, J. Phys. Chem. C, 2011, 115, 4773–4782, DOI:10.1021/jp111710x.
- J. J. Yeh and I. Lindau, At. Data Nucl. Data Tables, 1985, 32, 1–155 CrossRef CAS , http://www.sciencedirect.com/science/article/pii/0092640X85900166.
- (a) O. Dannenberger, K. Weiss, H.-J. Himmel, B. Jäger, M. Buck and C. Wöll, Thin Solid Films, 1997, 307, 183–191 CrossRef CAS , http://www.sciencedirect.com/science/article/pii/S0040609097002800; (b) H.-J. Himmel, K. Weiss, B. Jäger, O. Dannenberger, M. Grunze and C. Wöll, Langmuir, 1997, 13, 4943–4947, DOI:10.1021/la970121l.
Footnote |
| † Electronic supplementary information (ESI) available. See DOI: 10.1039/c5cp01447f |
| This journal is © the Owner Societies 2015 |

