
 Open Access Article
 This Open Access Article is licensed under a
 Creative Commons Attribution 3.0 Unported Licence
The rate constant of the reaction NCN + H2 and its role in NCN and NO modeling in low pressure CH4/O2/N2-flames
Nancy
Faßheber
a,
Nathalie
Lamoureux
*b and
Gernot
Friedrichs
*a
aInstitut für Physikalische Chemie, Christian-Albrechts-Universität zu Kiel, Max-Eyth-Str. 1, 24118 Kiel, Germany. E-mail: friedrichs@phc.uni-kiel.de
bLaboratoire PC2A, UMR8522 CNRS/Université Lille 1, 59655 Villeneuve d'Ascq, France. E-mail: nathalie.lamoureux@univ-lille1.fr
First published on 19th May 2015
Abstract
Bimolecular reactions of the NCN radical play a key role in modeling prompt-NO formation in hydrocarbon flames. The rate constant of the so-far neglected reaction NCN + H2 has been experimentally determined behind shock waves under pseudo-first order conditions with H2 as the excess component. NCN3 thermal decomposition has been used as a quantitative high temperature source of NCN radicals, which have been sensitively detected by difference UV laser absorption spectroscopy at ![[small nu, Greek, tilde]](https://www.rsc.org/images/entities/i_char_e0e1.gif) = 30383.11 cm−1. The experiments were performed at two different total densities of ρ ≈ 4.1 × 10⁻⁶ mol cm−3 and ρ ≈ 7.4 × 10⁻⁶ mol cm−3 (corresponding to pressures between p = 324 mbar and p = 1665 mbar) and revealed a pressure independent reaction. In the temperature range 1057 K < T < 2475 K, the overall rate constant can be represented by the Arrhenius expression k/(cm3 mol−1 s−1) = 4.1 × 10¹³ exp(−101 kJ mol−1/RT) (Δlog
= 30383.11 cm−1. The experiments were performed at two different total densities of ρ ≈ 4.1 × 10⁻⁶ mol cm−3 and ρ ≈ 7.4 × 10⁻⁶ mol cm−3 (corresponding to pressures between p = 324 mbar and p = 1665 mbar) and revealed a pressure independent reaction. In the temperature range 1057 K < T < 2475 K, the overall rate constant can be represented by the Arrhenius expression k/(cm3 mol−1 s−1) = 4.1 × 10¹³ exp(−101 kJ mol−1/RT) (Δlog![[thin space (1/6-em)]](https://www.rsc.org/images/entities/char_2009.gif) k = ±0.11). The pressure independent reaction as well as the measured activation energy is consistent with a dominating H abstracting reaction channel yielding the products HNCN + H. The reaction NCN + H2 has been implemented together with a set of reactions for subsequent HNCN and HNC chemistry into the detailed GDFkin3.0_NCN mechanism for NOx flame modeling. Two fuel-rich low-pressure CH4/O2/N2-flames served as examples to quantify the impact of the additional chemical pathways. Although the overall NCN consumption by H2 remains small, significant differences have been observed for NO yields with the updated mechanism. A detailed flux analysis revealed that HNC, mainly arising from HCN/HNC isomerization, plays a decisive role and enhances NO formation through a new HNC → HNCO → NH2 → NH → NO pathway.
k = ±0.11). The pressure independent reaction as well as the measured activation energy is consistent with a dominating H abstracting reaction channel yielding the products HNCN + H. The reaction NCN + H2 has been implemented together with a set of reactions for subsequent HNCN and HNC chemistry into the detailed GDFkin3.0_NCN mechanism for NOx flame modeling. Two fuel-rich low-pressure CH4/O2/N2-flames served as examples to quantify the impact of the additional chemical pathways. Although the overall NCN consumption by H2 remains small, significant differences have been observed for NO yields with the updated mechanism. A detailed flux analysis revealed that HNC, mainly arising from HCN/HNC isomerization, plays a decisive role and enhances NO formation through a new HNC → HNCO → NH2 → NH → NO pathway.
1 Introduction
Nitrogen oxides (NOx) are atmospheric pollutants formed as byproducts in combustion processes. Especially under fuel rich conditions, NO is favorably formed over the so-called prompt-NO pathway, which is initiated by the reaction of small hydrocarbon radicals with molecular nitrogen from the combustion air. According to the traditional Fenimore mechanism,1 it has been assumed for a long time that prompt-NO formation is mainly initiated by the reaction| CH(2Π) + N2(1Σ+) → N(4S) + HCN(1Σ+). | (1a) |
Even though the formation of the products N + HCN is spin-forbidden and despite the fact that theoretical estimates2,3 for the rate constant k1a turned out to be inconsistent with the experimentally determined high temperature rate constants for the overall CH + N2 reaction,4,5reaction (1a) is still used in some flame modeling studies. Already in the year 2000, based on quantum-chemical and RRKM calculations, Moskaleva et al.6 suggested the alternative spin-conserved reaction channel
| CH(2Π) + N2(1Σ+) → H(2S) + NCN(3Σg−) | (1b) |
Surprisingly, despite rather high H2 concentrations in the flame front, the title reaction
| NCN + H2 → products | (2) |
2 Experimental
The used shock tube apparatus has been described in more detail elsewhere.26 Briefly, the experiments have been performed in an overall 8.3 m long stainless steel shock tube with a 4.4 m long electropolished test section that could be evacuated to pressures of p ≈ 10−7 mbar by a combination of an oil-free turbo-molecular drag and a diaphragm pump. The test section and the driver section were separated by aluminum membranes of 30, 80 or 100 μm thickness. Hydrogen or hydrogen/nitrogen gas mixtures have been used as driver gas. The experimental conditions behind the incident and reflected shock waves were calculated from pre-shock conditions and the shock wave velocity, which was measured using four fast piezoelectronic sensors (PCB Piezotronics M113A21), by using a frozen-chemistry code.Storage gas mixtures of 500 ppm to 1000 ppm NCN3 in argon were prepared using the partial pressure method. The reaction mixtures were prepared using calibrated mass flow controllers (Aera, FC-7700CU; 10, 50, and 1000 sccm). Pure H2 (Air Liquide, ≥99.999%) and the NCN3 mixtures were further diluted with argon (Air Liquide, ≥99.999%) in a flow system and were passed into the test section of the shock tube. The section was flushed with the test gas mixture for about 5 min to minimize possible gas adsorption effects on the shock tube walls. High H2 mole fractions of up to 9.6% were necessary in the reaction gas mixtures to achieve a fast NCN consumption due to reaction (2). At such high mole fractions, vibrational relaxation effects may compromise a simple frozen-chemistry calculation of the experimental conditions. Equilibration of the Boltzmann population of H2 in its ν = 0 and ν = 1 vibrational states may cause a noticeable, gradual decrease of the temperature behind the shock wave. However, on the one hand the vibrational relaxation time of H2 in argon is known to be rather short, about 9 μs at p = 700 bar and T = 1750 K,27 and hence close to the time resolution of the experiments. On the other hand, due to the high vibrational quanta of H2, the fraction of H2 in the ν = 1 state and with it the overall temperature effect remains small. At a typical experimental temperature of T = 1750 K, the ratio H2(ν = 1)/H2(ν = 0) = 0.03. Calculation of shock wave conditions assuming fully and non-relaxed H2 showed that even at the highest experimental temperatures and H2 concentrations used in this work, the maximum expected temperature effect was ΔT < 5 K. This is within the 1% uncertainty of the temperature calculation from the shock wave velocity. Consequently, due to the fast relaxation and the overall small temperature effect, it could be safely assumed that H2 relaxation did not interfere with the rate constant measurements.
NCN precursor
It has been shown by Dammeier et al.28,29 that the thermal decomposition of cyanogen azide (NCN3) serves as a quantitative source of NCN radicals. NCN3 thermal decomposition yields NCN in its first electronically excited singlet state, which is rapidly converted to the triplet ground state by collision induced intersystem crossing (CIISC).| NCN3 + M → 1NCN + N2 + M | (3) |
| 1NCN + M → 3NCN + M | (4) |
exp[−Ea/RT], given in units of cm3, mol−1, s−1 and kJ. Except for reactions (3) and (4), all reactions have been duplicated for 1NCN to take 1NCN chemistry approximately into account. In addition to the listed reactions, the GDFkin3.0 mechanism12 was used as a background mechanism
| No. | Reaction | A | n | E a | Ref. |
|---|---|---|---|---|---|
| 2 | NCN + H2 → products | 4.1 × 10¹³ | 101 | This work | |
| 3 | NCN3 → 1NCN + N2 | 4.9 × 10⁹ | 71 | ρ = 3 × 10⁻⁶ mol cm−3,29 | |
| 7.5 × 10⁹ | 71 | ρ = 6 × 10⁻⁶ mol cm−3,29 | |||
| 4 | 1NCN → NCN | 2.0 × 10⁶ | 31 | ρ = 3.5 × 10⁻⁶ mol cm−3,29 | |
| 5a | NCN + H → HCN + N | 7.94 × 10¹² | 0.41 | 22.8 | 22 |
| 5b | NCN + H → CH + N2 | 4.2 × 10¹⁵ | −0.69 | 2.0 | 22 |
| 6 | NCN + M ⇌ C + N2 + M | 8.9 × 10¹⁴ | 260 | 21 | |
| 7 | NCN + NCN ⇌ CN + CN + N2 | 3.7 × 10¹² | 21 | ||
| 8 | NCN + C ⇌ CN + CN | 1.0 × 10¹⁴ | 21 | ||
| 9 | NCN + N ⇌ N2 + CN | 1.0 × 10¹³ | 6 | ||
| 10 | NCN + CN ⇌ C2N2 + N | 1.25 × 10¹⁴ | 33.5 | 6 | |
| 11 | NCN + H ⇌ HNCN | 2.98 × 10¹⁸ | −9.28 | 27 | 760 Torr,19 |
The extremely explosive and toxic precursor NCN3 cannot be purified by freeze–pump cycles. It has therefore been synthesized directly in high purity in the gas phase, according to BrCN(g) + NaN3(s) → NCN3(g) + NaBr(s), using a method described in detail in ref. 22. After an 8 h reaction time the remaining BrCN impurities were usually <3% according to FTIR analysis. The pure NCN3 was diluted in argon and was used within three days since NCN3 tends to slowly form solid polymers. The actual initial NCN3 concentrations in the reaction gas mixtures were determined from the NCN absorption signal plateaus behind the incident shock waves (for experiments behind the reflected shock wave) or by fitting the maximum of the NCN concentration profile (for experiments behind the incident shock wave). In all cases, the determined concentration was consistent with the concentration calculated from the expected NCN3 mole fraction in the storage gas mixture.
NCN detection scheme
The narrow-bandwidth laser absorption setup for time-resolved radical detection behind shock waves has been described in detail elsewhere.22 Briefly, about 1 mW of UV radiation was generated by intra-cavity frequency doubling of a frequency-stabilized continuous-wave ring-dye laser (Coherent 899) operated with DCM-special as dye and pumped using 8 W at λ = 532 nm from a Nd:YVO4 solid state laser (Coherent Verdi V10). The UV laser beam was split into a detection and a reference beam using a 50:50 beam splitter plate. The detection beam was focused, passed the shock tube through two quartz windows, and was coupled into an optical fiber connected to a balance photo-detector and amplifier (Thorlabs PDB 150A-EC). The reference beam intensity could be precisely adjusted using a variable neutral density filter to match the intensity of the detection beam. The resulting difference signal (ΔI) and the monitor signal of the detection beam (I0) were stored by an analog input board (Measurement Computing PCI-DAS4020/12, 12 bit, 20 MHz) for further data processing.
Triplet NCN has been detected at = 30381.11 cm−1 (λ = 329.1302 nm) on the maximum of an absorption band stemming from the superposition of the 3Π1 sub-band of the Ã3Πu(000)–![[X with combining tilde]](https://www.rsc.org/images/entities/i_char_0058_0303.gif) 3Σg(000) transition with the Q1 band head of the vibronic 3Σ+(010)–3Π(010) transition.30 NCN concentration–time profiles were calculated using the previously reported temperature-dependent absorption cross section, which has been measured with an accuracy of ±25% using the same apparatus at similar temperatures and pressures as used in this work.28 As the (010) vibrational state becomes significantly populated at combustion temperatures, the absorption cross sections were comparatively high (e.g., σ(1500 K, base e) = 4.5 × 107 cm2 mol−1). Hence, with a detection limit of 4 × 10⁻¹² cm3 mol−1 (corresponding to 1.5 × 10⁻³ absorption at T = 1500 K, p = 500 mbar, and an electronic time-resolution of Δt ≈ 1 μs), NCN could be detected with high signal-to-noise ratios even at NCN mole fractions as low as a few ppm.
3Σg(000) transition with the Q1 band head of the vibronic 3Σ+(010)–3Π(010) transition.30 NCN concentration–time profiles were calculated using the previously reported temperature-dependent absorption cross section, which has been measured with an accuracy of ±25% using the same apparatus at similar temperatures and pressures as used in this work.28 As the (010) vibrational state becomes significantly populated at combustion temperatures, the absorption cross sections were comparatively high (e.g., σ(1500 K, base e) = 4.5 × 107 cm2 mol−1). Hence, with a detection limit of 4 × 10⁻¹² cm3 mol−1 (corresponding to 1.5 × 10⁻³ absorption at T = 1500 K, p = 500 mbar, and an electronic time-resolution of Δt ≈ 1 μs), NCN could be detected with high signal-to-noise ratios even at NCN mole fractions as low as a few ppm.
Numerical methods
Numerical simulations of NCN concentration–time profiles from the shock tube experiments were performed using the Chemkin-II program package31 in combination with GDFkin3.0_NCN as a detailed background mechanism. In order to be consistent with a previous shock tube work, rate constants for NCN reactions have been replaced or added according to our directly measured rate constant data set.20–22 The most important reactions for modeling the shock tube experiments are listed in Table 1. For sensitivity analysis, the sensitivity coefficient σ(i,t) for reaction i at time t was normalized with respect to the maximum concentration [NCN]max over the time history, σ(i,t) = 1/[NCN]max × (∂[NCN]/∂lnki).
Flame modeling was performed with the Chemkin/Premix code31,32 and the detailed mechanism GDFkin3.0_NCN.12 As will be further outlined below, the mechanism has been modified to take into account reaction (2) and subsequent chemistry of HNCN and HNC. Rate-of-production (ROP) and the N-atom flux analyses have been accomplished at the NCN peak locations using a homemade post processor that relies mostly on the Chemkin subroutines.31 Atom flux analysis has been performed with the program Kinalc, and the reaction fluxes were plotted using the included FluxViewer visualisation tool.33 Thermodynamic data were adopted from GDFkin3.012 with updated NCN thermochemistry as described in ref. 13. Hence, in agreement with recent experimental work,22 the controversial value of the enthalpy of formation of NCN34 was set to  . For HNCN and HNC, thermodynamic data were extracted from the Goos/Ruscic database.35
Quantum chemical calculations were carried out using the Gaussian 09 suite of programs.36 The transition state of the reaction NCN + H2 → HNCN + H was located and verified by using a synchronous transit-guided quasi-Newton method (QST3 option) and an intrinsic reaction coordinate as follows.
3 Results and discussion
Shock tube experiments
The rate constant of reaction (2), NCN + H2, has been measured behind incident and reflected shock waves with reaction gas mixtures containing 3–27 ppm NCN3 and 0.8–9.6% H2 in argon. k2 values have been obtained in the temperature and pressure ranges of 1057 K ≤ T ≤ 2475 K and 324 mbar ≤ p ≤ 1665 mbar, at two total densities of ρ ≈ 4.1 × 10⁻⁶ and 7.4 × 10⁻⁶ mol cm−3. Under these experimental conditions the reaction NCN + H2 was always the most important reaction for NCN consumption. Experimental temperature limits were set by the thermal decomposition of NCN, which becomes the dominant reaction above 2500 K, and by the rate of reaction (2) itself, which becomes too slow at temperatures T < 1000 K to be measured with sufficient sensitivity.Fig. 1a shows a typical NCN concentration–time profile behind the incident shock wave at T = 1582 K and a total density of ρ = 4.13 × 10⁻⁶ mol cm−3. The NCN profile reveals a rather slow NCN consumption with a half-life of t1/2 ≈ 200 μs. Since there are no studies on the possible reaction channels of the reaction NCN + H2, numerical simulations of the experimental NCN profiles have been performed assuming different sets of reaction products. Potential reaction products of reaction (2) include:
 | ||
| Fig. 1 (a) Typical experimental NCN concentration–time profile in comparison with numerical simulations. T = 1582 K, p = 544 mbar, ρ = 4.13 × 10⁻⁶ mol cm−3, [H2] = 4.0%, [NCN3] = 8.2 ppm, k2e(NCN + H2 → HNCN + H) = 1.8 × 1010 cm3 mol−1 s−1 (best fit, solid curve). (b) Corresponding sensitivity analysis of NCN. | ||
|
|
|||
|---|---|---|---|
| 3NCN + 1H2 | → 1H2NCN | −317.2 | (2a) |
| → 1HNCNH | −304.2 | (2b) | |
| → 3CH2 + 1N2 | −59.0 | (2c) | |
| → 1HCN + 3NH | 38.4 | (2d) | |
| → 2HNCN + 2H | 83.6 | (2e) | |
| → 1HNC + 3NH | 100.5 | (2f) | |
| → 2NH2 + 2CN | 174.7 | (2g) | |

The formation of the thermodynamically most favorable products H2NCN (2a) and HNCNH (2b) is spin-forbidden and hence their formation constitutes a presumably unimportant pathway. All other increasingly endothermic channels are spin-allowed and may become accessible at combustion temperatures. Except for reaction (2e), the assumed product sets require the formation of an unlikely collision complex on the triplet surface followed by several rearrangement steps. This is in particular the case for reaction (2c), where a feasible reaction pathway can hardly be imagined. Actually, reactions (2a) and (2g) may become important for the corresponding 1NCN reaction as singlet radicals are known to prefer insertion reactions. For the triplet radical, however, reaction (2e) constitutes the by far most probable reaction channel. Next to the decomposition of a 3HNCNH intermediate, this reaction can take place as a direct activation controlled H abstraction reaction as well. It is known that H abstraction channels often become the dominating pathway at high temperatures even if complex-forming pathways are accessible.26,37 Therefore, the most reasonable reaction products HNCN + H have been assumed for the target reaction NCN + H2 in the first round of data evaluation. The effect of assuming different product sets will be further discussed below. The experimental NCN concentration–time profiles have been simulated based on a detailed mechanism assembled from our previous work (Table 1). Except for reactions (3) and (4), all reactions have been duplicated for 1NCN to take 1NCN chemistry approximately into account. Moreover, the reaction model was complemented by the extensive GDFkin3.0 mechanism.12,13 Subsequent HNCN chemistry is only partly accounted for. Next to the reverse of reaction (2e), H + HNCN, only the thermal decomposition of HNCN has been included in the mechanism by the reverse of reaction (11). For the latter, the rate expression used for atmospheric pressure has been adopted from the recent work of Teng et al.;19 a formerly reported rate expression for the low pressure limit of the unimolecular decomposition reaction (−11) by Moskaleva and Lin,6 which is implemented into the Konnov0.6 mechanism, turned out to yield unrealistic high rate constant values. Other rate constant data for bimolecular HNCN loss reactions such as HNCN + C/CN/N are not available in the literature, however, these reactions are not expected to play significant roles for modeling the shock tube experiments.
In Fig. 1a, the solid curve represents the best numerical simulation of the NCN profile using k2e = 1.8 × 1010 cm3 mol−1 s−1. Variation of k2e by a factor of two yields the two dotted curves that fail to reproduce the experiment. The sensitivity analysis in Fig. 1b reveals that reaction (2e) is by far the most important reaction for NCN consumption. Only at reaction times t > 250 μs, the reaction NCN + H gains some influence. Its high temperature rate constant and branching ratio, however, have been directly measured recently.22 The sole other sensitive reaction, which is important to model the initial NCN formation at short reaction times, is the CIISC process (4). It has been studied in some detail by Dammeier et al.29 and its rate constant value is dependent on the composition of the reaction gas mixture. Here, k4 has been used as an adjustable parameter and was varied within the error limits reported in ref. 29 in order to model the initial increase of the NCN signal. Finally, an alternative rate constant determination by fitting the NCN decay assuming a simple pseudo-first order exponential decay without applying any reaction mechanism has been performed as well. As expected for negligible secondary chemistry, very similar rate constant values are obtained. For example, for the experiment shown in Fig. 1 a rate constant of k2 = 1.9 × 1010 cm3 mol−1 s−1 has been obtained over the interval 25 μs ≤ t ≤ 250 μs, which is very close to the k2e = 1.8 × 1010 cm3 mol−1 s−1 value from the numerical simulation mentioned above.
In order to analyze a possible influence of the assumed products of reaction (2), the experimental NCN concentration–time profiles have been simulated using different product sets. Fig. 2a illustrates an experimental NCN profile at a reflected shock wave temperature of T = 2123 K. Assuming reaction channel (2e) with the radical products HNCN + H yields a rate constant of k2e = 1.3 × 1011 cm3 mol−1 s−1 (red curve). The sensitivity analysis of the chosen high temperature experiment reveals that the influence of secondary chemistry is more pronounced than for the previously discussed T = 1582 K experiment (Fig. 1). For example, the thermal decomposition of NCN, NCN + M → C + N2 + M starts to play a significant role. Its rate constant has been measured in two independent studies and highly consistent values have been reported.21,24 Hence, a sensitive determination of k2 is still possible. Next, the same value for the rate constant k2 but the alternative recombination product HNCNH of channel (2b) has been used instead of the products HNCN + H. The resulting simulated curve predicts a somewhat too slow NCN decay (black curve). As no additional HNCNH chemistry has been included into the mechanism and hence HNCNH has been treated as a stable species, the difference between the two simulations reflects the impact of the secondary reactions resulting from the radical products formed in the case of channel (2e) products. Similar results are obtained when assuming reaction channel (2a). In contrast, simulations with the other potential radical forming reaction channels (2c), (2d), (2f) or (2g) yielded more or less the same k2 values as for channel (2e). In Fig. 2a, the blue curve represents the simulation using the products of channel (2f), HNC + NH, as an example. Within error limits it is identical to the simulation using channel (2e).
 | ||
| Fig. 2 (a) Comparison of numerical simulations assuming HNCN + H (2e), HNC + NH (2f), or HNCNH (2b) as alternative products of the reaction NCN + H2. T = 2123 K, p = 719 mbar, ρ = 4.08 × 10⁻⁶ mol cm−3, [H2] = 1.5%, [NCN3] = 25 ppm. k2 = 1.3 × 1011 cm3 mol−1 s−1 has been used for all three simulations. (b) Corresponding sensitivity analysis assuming the products HNCN + H. | ||
Total rate constant values for reaction (2) have been extracted from 36 shock tube experiments. The experimental conditions of all the experiments are listed in Table 2, an Arrhenius plot of the obtained k2 values is given in Fig. 3. The symbols correspond to the results assuming HNCN + H as the reaction products. Within the scattering, the obtained data for the two different total densities of ρ ≈ 4.1 × 10⁻⁶ mol cm−3 (open squares) and 7.4 × 10⁻⁶ mol cm−3 (star symbols) agree, showing that the reaction is not significantly pressure dependent. The data points can be nicely represented by a two-parameter Arrhenius expression.

| T/K | p/mbar | ρ/10−6 mol cm−3 | H2/% | NCN/ppm | k 2e/cm3 mol−1 s−1 | T/K | p/mbar | ρ/10−6 mol cm−3 | H2/% | NCN/ppm | k 2e/cm3 mol−1 s−1 |
|---|---|---|---|---|---|---|---|---|---|---|---|
| Incident shock wave, ρ ≈ 4.06 × 10⁻⁶ mol cm−3 | Reflected shock wave, ρ ≈ 4.12 × 10⁻⁶ mol cm−3 | ||||||||||
| 1057 | 324 | 3.69 | 2.81 | 13 | 5.0 × 10⁸ | 1866 | 588 | 3.86 | 1.48 | 27 | 5.1 × 10¹⁰ |
| 1171 | 371 | 3.81 | 2.81 | 10 | 1.3 × 10⁹ | 1936 | 638 | 3.97 | 1.48 | 23 | 7.5 × 10¹⁰ |
| 1402 | 466 | 4.00 | 2.81 | 10 | 7.0 × 10⁹ | 2076 | 704 | 4.08 | 1.48 | 24 | 1.0 × 10¹¹ |
| 1433 | 489 | 4.10 | 6.34 | 4.5 | 8.5 × 10⁹ | 2123 | 719 | 4.08 | 1.48 | 25 | 1.3 × 10¹¹ |
| 1449 | 498 | 4.13 | 7.48 | 5.3 | 9.0 × 10⁹ | 2161 | 748 | 4.16 | 1.48 | 23 | 1.3 × 10¹¹ |
| 1503 | 510 | 4.08 | 9.63 | 3.2 | 1.2 × 10¹⁰ | 2264 | 794 | 4.22 | 1.48 | 25 | 2.7 × 10¹¹ |
| 1520 | 518 | 4.10 | 3.38 | 6.8 | 1.2 × 10¹⁰ | 2365 | 835 | 4.25 | 0.83 | 24 | 3.3 × 10¹¹ |
| 1525 | 520 | 4.10 | 3.64 | 7.6 | 1.3 × 10¹⁰ | 2475 | 891 | 4.33 | 0.83 | 21 | 2.6 × 10¹¹ |
| 1533 | 526 | 4.13 | 5.06 | 6.0 | 1.7 × 10¹⁰ | Incident shock wave, ρ ≈ 6.48 × 10⁻⁶ mol cm−3 | |||||
| 1534 | 523 | 4.10 | 3.15 | 5.6 | 1.3 × 10¹⁰ | 1244 | 669 | 6.47 | 2.81 | 7 | 2.8 × 10⁹ |
| 1534 | 525 | 4.11 | 3.17 | 4.2 | 1.4 × 10¹⁰ | 1260 | 680 | 6.49 | 2.81 | 9 | 4.3 × 10⁹ |
| 1535 | 527 | 4.13 | 4.31 | 8.6 | 1.8 × 10¹⁰ | Reflected shock wave, ρ ≈ 7.67 × 10⁻⁶ mol cm−3 | |||||
| 1537 | 526 | 4.11 | 3.17 | 5.5 | 1.3 × 10¹⁰ | 1247 | 652 | 6.29 | 2.93 | 10 | 5.0 × 10⁹ |
| 1560 | 537 | 4.14 | 3.19 | 2.7 | 1.6 × 10¹⁰ | 1543 | 916 | 7.14 | 2.93 | 12 | 2.0 × 10¹⁰ |
| 1578 | 537 | 4.10 | 2.10 | 5.8 | 1.6 × 10¹⁰ | 1705 | 1066 | 7.52 | 2.93 | 13 | 2.2 × 10¹⁰ |
| 1579 | 539 | 4.11 | 2.36 | 8.3 | 1.8 × 10¹⁰ | 1824 | 1178 | 7.77 | 2.93 | 10 | 4.9 × 10¹⁰ |
| 1582 | 544 | 4.13 | 3.95 | 8.2 | 1.8 × 10¹⁰ | 2044 | 1388 | 8.17 | 2.93 | 9.3 | 9.0 × 10¹⁰ |
| 1623 | 558 | 4.13 | 2.81 | 10 | 1.9 × 10¹⁰ | 2062 | 1405 | 8.19 | 2.81 | 12 | 1.5 × 10¹¹ |
| 1626 | 529 | 3.91 | 2.93 | 5 | 2.7 × 10¹⁰ | 2330 | 1665 | 8.59 | 2.81 | 9.0 | 3.0 × 10¹¹ |
 | ||
| Fig. 3 Arrhenius plot of the rate constant for the reaction NCN + H2 → products. Experimental data at two different total densities ρ ≈ 4.1 × 10⁻⁶ mol cm−3 (open squares) and ρ ≈ 7.4 × 10⁻⁶ mol cm−3 (star symbols) and corresponding Arrhenius fit (solid line) for an evaluation assuming radical products (channel (2c)–(g)) are shown. The dashed line depicts an Arrhenius fit obtained for an alternative data evaluation (corresponding data points are not shown) assuming stable reaction products (channels (2a) and (2b)). | ||
The error bars in Fig. 3 exemplify the cumulative uncertainty of k2 resulting from different error sources. Simulations show that a pessimistic ±25% error estimate for the initial NCN3 concentration, which arises from the 25% error of the used NCN absorption cross section,28 results in a ±6% uncertainty in k2. Varying the most important background reactions within their error limits sum up to ±8%. Finally, the uncertainty of the H2 concentration was ±2% and the statistical error of the Arrhenius fit of the scattered data amounts to ±8% (2σ standard error of the mean). A reasonable total error estimate in the middle of our temperature range at T ≈ 1750 K is therefore ±24%, corresponding to Δlogk2 = ±0.11. The dashed line in Fig. 3 corresponds to the Arrhenius expression k2/(cm3 mol−1 s−1) = 6.5 × 10¹³ × exp(−105 kJ mol−1/RT) that has been obtained by assuming the unlikely formation of a stable reaction product (i.e., channel (2a) or (2b)). Such an evaluation yields data (not shown) that start to deviate from the evaluation assuming radical products (i.e., channels (2c)–(g)) at temperatures T > 1700 K with a maximum deviation of +30% at T = 2480 K.
A comparison with a similar reaction and quantum-chemical calculations show that the obtained activation energy is roughly consistent with a reaction that is dominated by an H abstraction pathway according to channel (2e). On the one hand, a comparable H abstraction reaction of the N-centered triplet species, 3NH, NH + H2 → NH2 + H, exhibits an activation energy, which is 33 kJ mol−1 higher than the corresponding reaction enthalpy of  .38 Accordingly, an activation energy of Ea ≈ 84 kJ mol−1 + 33 kJ mol−1 = 117 kJ mol−1 would be expected for reaction (2e). On the other hand, an estimate of the activation enthalpy of channel (2e) based on quantum-chemical calculations using G4 level of theory yields a similar result. This method provides a reaction enthalpy for channel (2e) of
  , which is close to the value of 84 kJ mol−1 from thermodynamic data taken from the literature. The calculated energy of the H2⋯NCN transition state (H2 is bonded to one of the N atoms and is oriented essentially perpendicular to the slightly bended NCN moiety) yields ΔH‡(T = 1750 K) = 101 kJ mol−1. Accordingly, taking into account the simple transition state theory expression Ea ≈ ΔH‡ + 2RT, an activation energy of about 130 kJ mol−1 can be estimated for channel (2e) at T = 1750 K. However, a more detailed comparison with theory should be based on more advanced multi-reference quantum-chemical and kinetic calculations including tunneling corrections as well as a complete RRKM/master equation analysis of the possible role of additional complex-forming reaction pathways. Given that accurate energy calculation of NCN related species turned out to be very challenging,34 such an analysis would have been beyond the scope of this paper.
Flame modeling
The reaction NCN + H2 turns out to be comparatively fast. With a rate constant of k2 = 3.2 × 1010 cm3 mol−1 s−1 at a typical flame temperature of T = 1700 K, it is about a factor of 300 faster than the reaction NCN + O2. Therefore, in order to assess the potential influence of reaction (2) on NOx formation in flames, reaction (2) as well as other NCN reactions have been implemented into the GDFkin3.0_NCN12,13 flame mechanism. Arrhenius parameters of all reactions that have been added to the original mechanism are listed in Table 3. Simulations have been performed with HNCN + H, HCN + NH, and HNC + NH as the respective sole products of reaction (2).exp[−Ea/RT] in units of cm3, mol−1, s−1 and kJ
| No. | Reaction | A | n | E a | Ref. |
|---|---|---|---|---|---|
| 2 | NCN + H2 → (d) HCN + NH, (e) HNCN + H, (f) HNC + NH | 4.1 × 10¹³ | 101 | This work | |
| 6 | NCN + M ⇌ C + N2 + M | 8.9 × 10¹⁴ | 260 | 21 | |
| 7 | NCN + NCN ⇌ CN + CN + N2 | 3.7 × 10¹² | 29 | ||
| 8 | NCN + C ⇌ CN + CN | 1.0 × 10¹⁴ | 29 | ||
| 9 | NCN + N ⇌ N2 + CN | 1.0 × 10¹³ | 6 | ||
| 10 | NCN + CN ⇌ C2N2 + N | 1.25 × 10¹⁴ | 33.5 | 6 | |
| 11 | NCN + H ⇌ HNCN | 1.78 × 1041 | −9.58 | 21.9 | 100 Torr,19 |
| 12a | HNCN + O → NO + HNC | 1.22 × 10¹⁴ | −0.05 | 0.3 | 39 |
| 12b | HNCN + O → NH + NCO | 5.60 × 10¹³ | −0.05 | 0.3 | 39 |
| 12c | HNCN + O → CN + HNO | 9.36 × 10¹² | −0.05 | 0.3 | 39 |
| 13 | HNCN + O2 → HO2 + NCN | 1.26 × 10⁸ | 1.28 | 101.3 | 39 |
| 14 | HNCN + OH → H2O + NCN | 1.04 × 10⁵ | 2.48 | −7.9 | 40 |
| 15 | HCN (+M) → HNC (+M) | 3.5 × 10¹³ | 197.5 | k ∞,41 | |
| 1.60 × 1026 | −3.23 | 207.5 | k 0,41 | ||
| 16 | HNC + H → HCN + H | 7.8 × 10¹³ | 15 | 42 | |
| 17 | HNC + O → NH + CO | 4.6 × 10¹² | 9.2 | 41 | |
| 18 | HNC + OH → HNCO + H | 2.8 × 10¹³ | 15.5 | 41 | |
| 19 | HNC + CN → C2N2 + H | 1.0 × 10¹³ | 43 | ||
Consideration of HNCN + H as main products implies an update of the mechanism with respect to HNCN reactions as well. HNCN species may rapidly react with O atoms (reactions (12)) generating HNC species. Consequently, two new blocks of reactions have been added to account for possible HNCN and HNC chemistry. In order to be coherent with the experimental rate constant determination, some additional NCN consumption reactions, (6) to (11), have also been considered in the detailed mechanism. In the following, this updated mechanism is named up-GDFkin3.0_NCN (up-GDF for short) in contrast to the original mechanism GDFkin3.0_NCN (GDF for short). Calculations were performed to simulate species profiles in selected low pressure premixed flames where the reaction NCN + H2 may play an important role in the prompt-NO pathway. Two fuel rich flames of CH4/O2/N2 have been considered numerically. Both flames were simulated at low pressure (5.0 kPa) with the same total volumetric flow rate (300 L h−1, under the standard conditions of temperature and pressure) and nitrogen dilution ratio (60%), but a different richness equal to ϕ = 1.3 and ϕ = 1.5, respectively. Imposed temperature profiles were identical for each flame. The temperature in the burned gas was limited to remain lower than 1850 K, hence thermal-NO contribution was reduced and prompt-NO formation was promoted.
Considering the original GDF mechanism, simulated temperature and species profiles of NO, NCN and H2 are reported in Fig. 4. In the burned gases, NO mole fractions are equal to 24.5 and 38.3 ppm for ϕ = 1.3 and ϕ = 1.5, respectively. As shown in Fig. 4a, the NO mole fraction in the burned gases is hardly affected at ϕ = 1.3, but is increased by 8% at ϕ = 1.5 when the calculations are performed with the up-GDF mechanism instead. H2 and NCN profiles are reported in Fig. 4b using the up-GDF mechanism. The profiles show that at the NCN peak location (height above burner, HAB (ϕ = 1.3) = 5.3 mm and HAB (ϕ = 1.5) = 6.8 mm) the mole fractions of H2 with x(ϕ = 1.3) = 0.064 and x(ϕ = 1.5) = 0.091 are high. NCN peak mole fractions are quite similar in the two flames with peak values close to 145 ppb, but the shape of the NCN profile is much thinner at ϕ = 1.3.
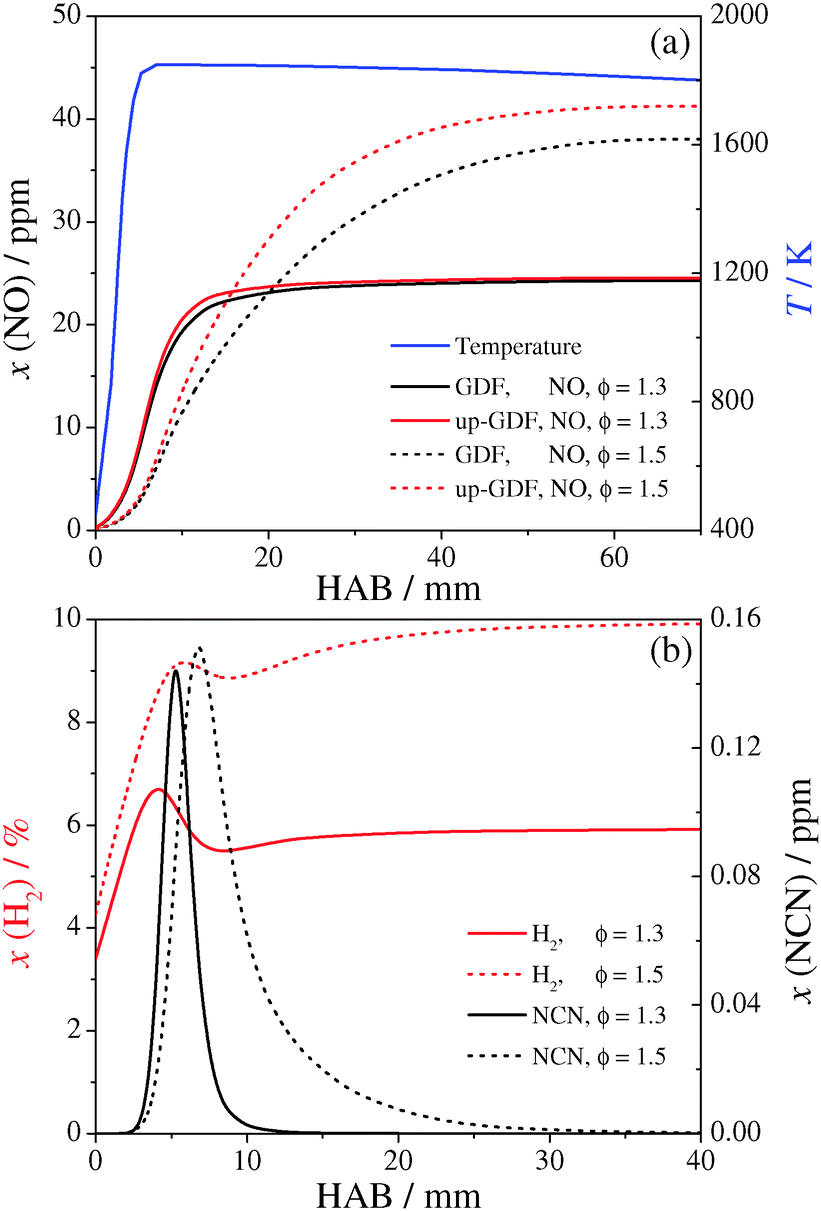 | ||
| Fig. 4 (a) NO profiles simulated for the low pressure flames (see text) at a richness of ϕ = 1.3 and ϕ = 1.5. The results are shown for both the GDF and up-GDF mechanisms. (b) Corresponding H2 and NCN profiles simulated with the up-GDF mechanism. | ||
N-atom flux analysis was performed after all the reactions have been declared in a non-reversible format. In this way the atom flux reveals the flux in both directions of reversible reactions (forward and backward) separately. Some results at the NCN peak locations for both flames are presented in Table 4. Only NCN losses in the direction of the prompt-NO formation pathway (forward flux) are included. As expected, the reaction NCN + H → HCN + N is the most important NCN loss reaction that dominates the NCN forward flux, followed by the reaction with O atoms (yielding CN + NO). Nevertheless, about 1.8% of the NCN radicals are consumed through reaction (2) at ϕ = 1.3 and 3.5% at ϕ = 1.5. The so-far neglected reaction with H2 ranks third place and its contribution is even three orders of magnitude higher than for the reaction NCN + O2. Note that the N-flux analysis reveals that next to reaction (2) also reaction (8), NCN + C, which was omitted in the original mechanism as well, becomes more important than other, already implemented bimolecular reactions such as NCN + OH/HO2/NO/M that are negligible under the assumed flame conditions.
| Forward flux % | Ha | O | H2 | C | H2O | OH | HO2 | O2 | NO | M |
|---|---|---|---|---|---|---|---|---|---|---|
| a For NCN + H (yielding either CH + N2 or HCN + N, with a relative ratio of 77/23) only the HCN + N forming channel contributes to the forward flux along the prompt-NO formation pathway. | ||||||||||
| ϕ = 1.3 | 69.21 | 25.68 | 1.76 | 1.36 | 1.33 | 0.44 | 0.21 | <0.01 | <0.01 | <0.01 |
| ϕ = 1.5 | 79.33 | 12.54 | 3.52 | 2.17 | 1.96 | 0.33 | 0.13 | <0.01 | <0.01 | 0.03 |
Although it turned out that the implementation of reaction (2) is important, its rather low contribution to the forward flux is in seemingly contrast to the mentioned significant change in the overall NO yield. Obviously, other reactions added to the updated mechanism must be responsible for this prominent effect. A complete reaction pathway diagram for the ϕ = 1.5 flame using the up-GDF mechanism is shown in Fig. 5. New reaction pathways that are absent in the corresponding diagram using the original GDF mechanism (not shown) are highlighted in red color. These pathways include the formation and loss reactions of the newly included species HNCN and HNC. Once formed, HNCN reacts quickly with O-atoms through reaction (12). According to theoretical calculations, the products of the reaction HNCN + O are mostly HNC + NO.39 HNC then reacts with OH radicals yielding HNCO + H, and HNCO reacts with H atoms yielding NH2 + CO. However, it becomes clear from the flux diagram that HNC radicals are formed primarily from HCN and only secondly from HNCN. In fact, the HCN/HNC isomerization according to reactions (15), which is close to its low-pressure limit, and the H atom initiated isomerization reaction (−16), HNC + H → HCN + H, represent 12% and 20% of the HCN consumption at ϕ = 1.3 and ϕ = 1.5, respectively. This finding is also reflected in the HCN profiles shown in Fig. 6 for the ϕ = 1.5 flame. HCN mole fraction peak values obtained with the updated mechanism decrease by 20%. According to the ROP, HCN is mainly consumed through the reaction HCN + O ⇌ NCO + H and reaction (−16), both being three times more important than the reactions HCN + OH ⇌ HOCN + H and HNC (+M) ⇌ HCN (+M). The combined effect of HNC formation from reactions (−16) and (12a) results in a substantial increase of HNCO by a factor of two (Fig. 6). This increase is followed by a comparable increase of the peak values of NH2 as well.
 | ||
| Fig. 5 N-atom flux analysis at the NCN peak location in the ϕ = 1.5 CH4/O2/N2 flame using the up-GDF mechanism. The pathways highlighted in red color are absent in a corresponding flux analysis using the original GDF mechanism.13 | ||
 | ||
| Fig. 6 Comparison of HCN, HNCO, and NH2 profiles of the ϕ = 1.5 flame calculated with the original GDF (dashed curves) and the up-GDF (solid curves) mechanisms. | ||
To sum up, although the implementation of reaction (2) has indeed a significant impact on NO formation through a new HNC → HNCO → NH2 → NH → NO pathway, it is in fact the HCN/HNC isomerization and not the reaction NCN + H2 that is mainly responsible for the distinct changes obtained with the up-GDF mechanism. Note that the rate constant of the H initiated isomerization reaction (16), H + HNC → HCN + H, is based on a theoretical QRRK estimate42 and, to the best of our knowledge, has not been experimentally confirmed yet. Therefore, our interesting preliminary finding calls for a more detailed analysis to better constrain and verify the role of the HNC initiated pathway for NO formation in flames.
The possible influence of the assumed products of reaction (2) for the NO formation in flames has also been analyzed. Whatever channel (d–f) of reaction (2) was assumed, simulated NO profiles are identical to each other. However, considering channel (2d), implementation of reactions (12–19) could be removed since HCN and NH species are already declared in GDF.13 In that case, simulated NO profiles would be identical to those obtained with the original GDF mechanism. Again, this clearly highlights the potential importance of the HCN/HNC isomerization pathway through reactions (15) and (−16).
4 Conclusion
The rate constant of reaction (2), NCN + H2 → products, has been measured for the first time. Shock wave experiments with time-resolved NCN radical detection by narrow-bandwidth laser UV absorption were carried out under nearly pseudo-first order reaction conditions with H2 as the excess component. The total rate constant has been measured at temperatures 1057 K ≤ T ≤ 2475 K and can be represented by the Arrhenius expression
No pressure dependence could be observed between p = 324 mbar and p = 1665 mbar. Quantum-chemical calculations show that the activation energy is roughly consistent with the formation of the products HNCN + H, hence the most likely direct abstraction pathway. Still, detailed quantum-chemical calculations in combination with RRKM/TST/ME modeling are desirable to further assess the role of complex-forming reaction pathways.
The detailed reaction mechanism GDFkin3.0_NCN has been updated to assess the potential influence of the so-far neglected reaction (2) on prompt-NO formation in flames. Next to reaction (2), HNC and HNCN submechanisms have been implemented as well to describe the subsequent chemistry of the reaction products. Two fuel-rich low-pressure methane flames served as a model case and it was shown that the contribution of reaction (2) on the overall NCN loss in the direction of prompt-NO is on the order of a few percent. Of course, the reaction may become even more important for other flame conditions and, therefore, needs to be included in detailed flame mechanisms. The flame simulation also highlights the fact that the reaction NCN + C ⇌ CN + CN, which was also omitted in the original GDFkin3.0_NCN mechanism should be considered in the future as well. As yet the rate constant for NCN + C has only been roughly determined experimentally, improved direct measurements are required. Moreover, as a pronounced impact of HCN/HNC isomerization on NO formation has been found in this study, a critical assessment and experimental verification of the role of this new HNC → HNCO → NH2 → NH → NO prompt-NO formation pathway is important. A thorough validation of the updated mechanism going along with the implementation of other new experimental rate constant data that recently have become available for several bimolecular reactions of NCN is currently underway.
Acknowledgements
Financial support from the German Science Foundation (DFG-FR 1529/4) and the University Lille1 through a BQR International 2014 sponsorship is gratefully acknowledged. We also thank Johannes Dammeier for help and support with the shock tube experiments and Pascale Desgroux for fruitful discussion.References
- C. P. Fenimore, Formation of nitric oxide in premixed hydrocarbon flames, Proc. Combust. Inst., 1971, 13, 373–380 Search PubMed.
- Q. Cui and K. Morokuma, The spin-forbidden reaction CH(2Π) + N2 → HCN + N(4S) revisited. I. Ab initio study of the potential energy surfaces, Theor. Chem. Acc., 1999, 102, 127–133 CrossRef CAS.
- Q. Cui, K. Morokuma, J. M. Bowman and S. J. Klippenstein, The spin-forbidden reaction CH(2Π) + N2 → HCN + N(4S) revisited. II. Nonadiabatic transition state theory and application, J. Chem. Phys., 1999, 110, 9469–9482 CrossRef CAS PubMed.
- D. Lindackers, M. Burmeister and P. Roth, Perturbation studies of high temperature carbon and CH reactions with nitrogen and nitrogen oxide (NO), Proc. Combust. Inst., 1991, 23, 251–257 CrossRef.
- A. J. Dean, R. K. Hanson and C. T. Bowman, High temperature shock tube study of reactions of CH and carbon-atoms with nitrogen, Proc. Combust. Inst., 1991, 23, 259–265 CrossRef.
- L. V. Moskaleva and M. C. Lin, The spin-conserved reaction CH + N2 → H + NCN: A major pathway to prompt NO studied by quantum/statistical theory calculations and kinetic modeling of rate constant, Proc. Combust. Inst., 2000, 28, 2393–2401 CrossRef CAS.
- G. P. Smith, Evidence of NCN as a flame intermediate for prompt NO, Chem. Phys. Lett., 2003, 367, 541–548 CrossRef CAS.
- J. A. Sutton, B. A. Williams and J. W. Fleming, Laser-induced fluorescence measurements of NCN in low-pressure CH4/O2/N2 flames and its role in prompt NO formation, Combust. Flame, 2008, 153, 465–478 CrossRef CAS PubMed.
- N. Lamoureux, X. Mercier, C. Western, J. F. Pauwels and P. Desgroux, NCN quantitative measurement in a laminar low pressure flame, Proc. Combust. Inst., 2009, 32, 937–944 CrossRef CAS PubMed.
- V. Vasudevan, R. K. Hanson, C. T. Bowman, D. M. Golden and D. F. Davidson, Shock Tube Study of the Reaction of CH with N2: Overall Rate and Branching Ratio, J. Phys. Chem. A, 2007, 111, 11818–11830 CrossRef CAS PubMed.
- A. A. Konnov, Implementation of the NCN pathway of prompt-NO formation in the detailed reaction mechanism, Combust. Flame, 2009, 156, 2093–2105 CrossRef CAS PubMed.
- N. Lamoureux, P. Desgroux, A. E. Bakali and J. Pauwels, Experimental and numerical study of the role of NCN in prompt-NO formation in low-pressure CH4-O2-N2 and C2H2-O2-N2 flames, Combust. Flame, 2010, 157, 1929–1941 CrossRef CAS PubMed.
- N. Lamoureux, H. E. Merhubi, L. Gasnot, C. Schoemaecker and P. Desgroux, Measurements and modelling of HCN and CN species profiles in laminar CH4/O2/N2 low pressure flames using LIF/CRDS techniques, Proc. Combust. Inst., 2015, 35, 745–752 CrossRef CAS PubMed.
- N. Lamoureux, X. Mercier, J. F. Pauwels and P. Desgroux, NCO quantitative measurement in premixed low pressure flames by combining LIF and CRDS techniques, J. Phys. Chem. A, 2011, 115, 5346–5353 CrossRef CAS PubMed.
- P. Glarborg, M. U. Alzueta, K. Dam-Johansen and J. A. Miller, Kinetic Modeling of Hydrocarbon/Nitric Oxide Interactions in a Flow Reactor, Combust. Flame, 1998, 115, 1–27 CrossRef CAS.
- R. S. Zhu and M. C. Lin, Ab Initio Study of the Oxidation of NCN by O2, Int. J. Chem. Kinet., 2005, 37, 593–598 CrossRef CAS PubMed.
- R. S. Zhu and M. C. Lin, Ab Initio Study on the Oxidation of NCN by O (3P): Prediction of the Total Rate Constant and Product Branching Ratios, J. Phys. Chem. A, 2007, 111, 6766–6771 CrossRef CAS PubMed.
- R. S. Zhu, H. M. T. Nguyen and M. C. Lin, Ab Initio Study on the Oxidation of NCN by OH: Prediction of the Individual and Total Rate Constants, J. Phys. Chem. A, 2009, 113, 298–304 CrossRef CAS PubMed.
- W.-S. Teng, L. V. Moskaleva, H. Chen and M. C. Lin, Ab Initio Chemical Kinetics for H + NCN: Prediction of NCN Heat of Formation and Reaction Product Branching via Doublet and Quartet Surfaces, J. Phys. Chem. A, 2013, 117, 5775–5784 CrossRef CAS PubMed.
- J. Dammeier and G. Friedrichs, Direct Measurements of the Rate Constants of the Reactions NCN + NO and NCN + NO2 Behind Shock Waves, J. Phys. Chem. A, 2011, 115, 14382–14390 CrossRef CAS PubMed.
- J. Dammeier, N. Faßheber and G. Friedrichs, Direct measurements of the high temperature rate constants of the reactions NCN + O, NCN + NCN, and NCN + M, Phys. Chem. Chem. Phys., 2012, 14, 1030–1037 RSC.
- N. Faßheber, J. Dammeier and G. Friedrichs, Direct measurements of the total rate constant of the reaction NCN + H and implications for the product branching ratio and the enthalpy of formation of NCN, Phys. Chem. Chem. Phys., 2014, 16, 11647–11657 RSC.
- A. Busch, M. Olzmann, Shock-Tube Study of the Thermal Decomposition of NCN, Proc. Eur. Combust. Meeting, 2009 Paper P810138, Vienna, Austria.
- A. Busch, N. González-García, G. Lendvay and M. Olzmann, Thermal Decomposition of NCN: Shock-Tube Study, Quantum Chemical Calculations, and Master-Equation Modeling, J. Phys. Chem. A, 2015 DOI:10.1021/acs.jpca.5b01347.
- A. E. Bakali, L. Pillier, P. Desgroux, B. Lefort, L. Gasnot, J. F. Pauwels and I. da Costa, NO prediction in natural gas flames using GDF-Kin 3.0 mechanism. NCN and HCN contribution to prompt-NO formation, Fuel, 2006, 85, 896–909 CrossRef PubMed.
- M. Colberg and G. Friedrichs, Room Temperature and Shock Tube Study of the Reaction HCO + O2 Using the Photolysis of Glyoxal as an Efficient HCO Source., J. Phys. Chem. A, 2006, 110, 160–170 CrossRef CAS PubMed.
- J. E. Dove and H. Teitelbaum, The vibrational relaxation of H2. I. Experimental measurements of the rate of relaxation by H2, He, Ne, Ar, and Kr, Chem. Phys., 1974, 6, 431–444 CrossRef CAS.
- J. Dammeier and G. Friedrichs, Thermal Decomposition of NCN3 as a High-Temperature NCN Radical Source: Singlet-Triplet Relaxation and Absorption Cross Section of NCN(3Σ), J. Phys. Chem. A, 2010, 114, 12963–12971 CrossRef CAS PubMed.
- J. Dammeier, B. Oden and G. Friedrichs, A consistent model for the thermal decomposition of NCN3 and the singlet–triplet relaxation of NCN, Int. J. Chem. Kinet., 2013, 45, 30–40 CrossRef CAS PubMed.
- N. Lamoureux, C. M. Western, X. Mercier and P. Desgroux, Reinvestigation of the spectroscopy of the A3Πu–X3Σg− transition of the NCN radical at high temperature: Application to quantitative NCN measurement in flames, Combust. Flame, 2013, 160, 755–765 CrossRef CAS PubMed.
- R. J. Kee, F. M. Ruply, J. A. Miller, Chemkin-II: A Fortran Chemical Kinetics Package for the Analysis of Gas- Phase Chemical Kinetics, Sandia Report SAND89-8009, Sandia National Laboratories, Livermore, California (Sept. 1989) http://www.sandia.gov/chemkin/index.html, accessed april 24, 2015.
- R. Kee, J. Grcar, M. Smooke, J. Miller, Premix: A fortran program for modelling steady laminar one-dimensional premixed flames, Sandia report SAND85-8240, 1985.
- KINALC: program for the kinetic analysis of combustion mechanisms, http://garfield.chem.elte.hu/Combustion/kinalc.htm, accessed april 24, 2015.
- E. Goos, C. Sickfeld, F. Mau, L. Siedel, B. Ruscic, A. Burcat and T. Zeuch, Prompt NO formation in flames: The influence of NCN thermochemistry, Proc. Combust. Inst., 2013, 34, 657–666 CrossRef CAS PubMed.
- E. Goos, A. Burcat, B. Ruscic, Extended Third Millenium Ideal Gas and Condensed Phase Thermochemical Database for Combustion with Updates from Active Thermochemical Tables, (2009) http://garfield.chem.elte.hu/Burcat/burcat.html, accessed march 6, 2015.
- M. J. Frisch, G. W. Trucks, H. B. Schlegel, G. E. Scuseria, M. A. Robb, J. R. Cheeseman, G. Scalmani, V. Barone, B. Mennucci, G. A. Petersson, H. Nakatsuji, M. Caricato, X. Li, H. P. Hratchian, A. F. Izmaylov, J. Bloino, G. Zheng, J. L. Sonnenberg, M. Hada, M. Ehara, K. Toyota, R. Fukuda, J. Hasegawa, M. Ishida, T. Nakajima, Y. Honda, O. Kitao, H. Nakai, T. Vreven, J. A. Montgomery, Jr., J. E. Peralta, F. Ogliaro, M. Bearpark, J. J. Heyd, E. Brothers, K. N. Kudin, V. N. Staroverov, R. Kobayashi, J. Normand, K. Raghavachari, A. Rendell, J. C. Burant, S. S. Iyengar, J. Tomasi, M. Cossi, N. Rega, J. M. Millam, M. Klene, J. E. Knox, J. B. Cross, V. Bakken, C. Adamo, J. Jaramillo, R. Gomperts, R. E. Stratmann, O. Yazyev, A. J. Austin, R. Cammi, C. Pomelli, J. W. Ochterski, R. L. Martin, K. Morokuma, V. G. Zakrzewski, G. A. Voth, P. Salvador, J. J. Dannenberg, S. Dapprich, A. D. Daniels, Ö. Farkas, J. B. Foresman, J. V. Ortiz, J. Cioslowski and D. J. Fox, Gaussian 09, Revision D.01, Gaussian Inc., Wallingford, CT, 2009 Search PubMed.
- J. Dammeier, M. Colberg and G. Friedrichs, Wide temperature range (T = 295 K and 770–1305 K) study of the kinetics of the reactions HCO + NO and HCO + NO2 using frequency modulation spectroscopy, Phys. Chem. Chem. Phys., 2007, 9, 4177–4188 RSC.
- A. Fontijn, S. M. Shamsuddin, D. Crammond, P. Marshall and W. R. Anderson, Kinetics of the NH reaction with H2 and reassessment of HNO formation from NH + CO2, H2O, Combust. Flame, 2006, 145, 543–551 CrossRef CAS PubMed.
- S. Xu and M. C. Lin, Ab initio chemical kinetics for the reactions of HNCN with O(3P) and O2, Proc. Combust. Inst., 2009, 32, 99–106 CrossRef CAS PubMed.
- S. Xu and M. C. Lin, Ab Initio Chemical Kinetics for the OH + HNCN Reaction, J. Phys. Chem. A, 2007, 111, 6730–6740 CrossRef CAS PubMed.
- A. M. Dean and J. W. Bozzelli, in Combustion chemistry of nitrogen, ed. W. C. Gardiner, Gasphase Combustion Chemistry, Springer, New York, 2000 Search PubMed.
- R. Sumathi and M. T. Nguyen, A theoretical study of the CH2N system: reactions in both lowest lying doublet and quartet states, J. Phys. Chem. A, 1998, 102, 8013–8020 CrossRef CAS.
- S. Petrie and Y. Osamura, NCCN and NCCCCN Formation in Titan’s Atmosphere: 2. HNC as a Viable Precursor, J. Phys. Chem. A, 2004, 108, 3623–3631 CrossRef CAS.
| This journal is © the Owner Societies 2015 |