 Open Access Article
Creative Commons Attribution 3.0 Unported Licence
Structure and dynamics of aqueous 2-propanol: a THz-TDS, NMR and neutron diffraction study†
James
McGregor‡
 *a,
Ruoyu
Li
a,
J. Axel
Zeitler
 a,
Carmine
D'Agostino
a,
James H. P.
Collins
a,
Mick D.
Mantle
a,
Haresh
Manyar
b,
John D.
Holbrey
b,
Marta
Falkowska
b,
Tristan G. A.
Youngs§
c,
Christopher
Hardacre
b,
E. Hugh
Stitt
d and
Lynn F.
Gladden
a
a,
Carmine
D'Agostino
a,
James H. P.
Collins
a,
Mick D.
Mantle
a,
Haresh
Manyar
b,
John D.
Holbrey
b,
Marta
Falkowska
b,
Tristan G. A.
Youngs§
c,
Christopher
Hardacre
b,
E. Hugh
Stitt
d and
Lynn F.
Gladden
a
aDepartment of Chemical Engineering and Biotechnology, University of Cambridge, Cambridge CB2 3RA, UK. E-mail: james.mcgregor@sheffield.ac.uk
bSchool of Chemistry and Chemical Engineering, Queen's University Belfast, Belfast BT9 5AG, UK
cSchool of Mathematics and Physics, Queen's University Belfast, Belfast BT9 5AG, UK
dJohnson Matthey Catalysts, P.O. Box 1, Belasis Avenue, Billingham, Cleveland TS23 1LB, UK
First published on 23rd October 2015
Abstract
Aqueous liquid mixtures, in particular, those involving amphiphilic species, play an important role in many physical, chemical and biological processes. Of particular interest are alcohol/water mixtures; however, the structural dynamics of such systems are still not fully understood. Herein, a combination of terahertz time-domain spectroscopy (THz-TDS) and NMR relaxation time analysis has been applied to investigate 2-propanol/water mixtures across the entire composition range; while neutron diffraction studies have been carried out at two specific concentrations. Excellent agreement is seen between the techniques with a maximum in both the relative absorption coefficient and the activation energy to molecular motion occurring at ∼90 mol% H2O. Furthermore, this is the same value at which well-established excess thermodynamic functions exhibit a maximum/minimum. Additionally, both neutron diffraction and THz-TDS have been used to provide estimates of the size of the hydration shell around 2-propanol in solution. Both methods determine that between 4 and 5 H2O molecules per 2-propanol are found in the 2-propanol/water clusters at 90 mol% H2O. Based on the acquired data, a description of the structure of 2-propanol/water across the composition range is presented.
1. Introduction
Aqueous solutions of alcohols have provided a rich seam for scientific research for many years. Such binary mixtures are ubiquitous in many fields, including fuel cell technology and bioscience.1–4 In the latter field, alcohols also serve as model compounds for more complex amphiphiles such as proteins, with the influence of the solute on the structure of water being of significant interest. Elsewhere, alcohol/water mixtures are employed as solvents for chemical processes, including catalytic reactions, with 2-propanol/water systems of particular interest. A parallel and complementary work specifically explores the role of aqueous 2-propanol as a solvent in the heterogeneous catalytic hydrogenation of 2-butanone.5 In the present contribution we report an investigation of the structure and dynamics of 2-propanol/water mixtures, with the aim of contributing to a better understanding of the molecular-scale processes occurring in such systems. To this end we have employed nuclear magnetic resonance (NMR) spectroscopy, neutron scattering combined with empirical potential structure refinement (EPSR) analysis and terahertz time-domain spectroscopy (THz-TDS). THz-TDS allows access to the fast (ps and sub-ps) processes which take place within aqueous mixtures. The methodology presented is relevant to a wide range of liquid systems.1.1 Background
It is well established that upon mixing, aqueous alcohol solutions display anomalous transport and thermodynamic behaviour, such as a less than expected increase in entropy. Excess functions are also observed for other thermodynamic properties: free energy and enthalpy. For 2-propanol/water mixtures at 303 K a maximum negative excess enthalpy is observed at ∼90 mol% H2O.6 The observed maxima in the thermodynamic functions are co-incidental with maxima and minima in the physical properties of such mixtures. For instance, the viscosity of alcohol/water mixtures achieves a maximum,7,8 with a corresponding minimum for the diffusion coefficient.9 Despite the apparent simplicity of alcohol/water systems there has been much debate as to the physical basis of these effects.10 However, a consensus has now emerged supporting the view that it is the hydrogen bond (HB) dynamics, and, therefore, the dynamical structure of the solutions, that are the origin of these phenomena.10–15The earliest analyses, including the seminal work by Frank and Evans,16 proposed that the origin of the anomalous effects observed upon mixing alcohols and water was a consequence of the water structure becoming “enhanced”, or more “ice-like” in the presence of a hydrophobic entity such as the alkyl group of an alcohol. Neutron diffraction studies, however, have demonstrated that there is no need to invoke such an “iceberg theory”. Instead, taking methanol/water mixtures as a representative example, the excess thermodynamic properties may be explained as arising from incomplete mixing on the molecular level.12,17 Dougan and co-workers have demonstrated that around the composition where excess thermodynamic properties are at their maxima, methanol and water form separate, bi-percolating liquid-networks.18 Furthermore, from simulations based on experimental neutron diffraction data it has been demonstrated that the excess entropy associated with water/methanol mixtures, and the dependence of this on composition, can be quantitatively explained through this segregation of methanol and water at the molecular level.19 The lifetime of the methanol and water clusters formed is on average 3 ps, indicating that the origin of these effects is indeed dynamical. Recently, Artola et al., have applied a range of techniques including neutron diffraction and NMR to water/2-methyl-2-propanol mixtures, identifying hydrogen bonding as the driving force behind the observed mesoscopic structural organisation.20 Elsewhere Juurinen and co-workers have employed X-ray Raman scattering to interrogate water/alcohol mixtures for a range of short-chained alcohols.21
1.2 THz-TDS studies
THz-TDS is ideally suited to the study of HB dynamics as such processes occur on the picosecond timescale. Such short timescales are readily probed by THz-TDS. Aqueous solutions of methanol, acetone and acetonitrile have previously been studied using THz spectroscopy by Venables et al.11,22 The non-ideality of such solutions was readily apparent from the acquired terahertz spectroscopy data, with an enhancement in structure observed relative to the individual components. Additionally, the dynamical HB breaking/forming processes occurring on ps timescales were quantitatively identified. Such systems bear a close resemblance to the 2-propanol/water mixtures studied in the present work. More recently we have applied THz-THS to the study of mesoscopic structuring in aqueous solutions of primary alcohols.15 This work identified critical compositions corresponding to changes in the hydrogen-bonding structure of the mixtures. Considering proton transfer in aqueous solutions, Tielrooij et al. have employed THz-TDS to demonstrate that a large number of water molecules are involved in such processes, thereby indicating that such a mechanism is likely to be limited to situations where a large excess of water molecules is present.23 Elsewhere, aqueous solutions of biologically relevant molecules, and in particular their hydration, has been the subject of study.4,24–291.3 NMR studies
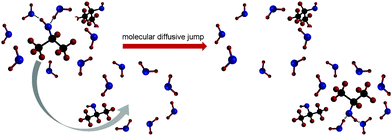
NMR measurements, like terahertz spectroscopy, have also previously been employed to study aqueous solutions of alcohols. Corsaro and co-workers performed 1H NMR experiments in which the spin–lattice (T1) and spin–spin (T2) relaxation times were measured for methanol/water mixtures.1 These measurements supported the conclusion that the thermodynamic properties of these mixtures are governed by HB dynamics, with the lifetime and stability of HBs being dependent upon the liquid composition. Additionally, the results were consistent with the presence of local clusters at temperatures above 245 K. Elsewhere, an analysis of the rotational correlation time of water molecules around benzene based on T1 measurements has demonstrated that rotational dynamics are correlated with HB strength. Water molecules in the hydration shell of benzene were concluded to form stronger HBs and to have slower correlation times than those in the bulk water phase.30 Measurements of diffusion times using PFG NMR related these results to translation motions. PFG NMR has also been applied alongside THz-TDS to measure diffusion coefficients in binary primary alcohol/water systems correlating a minimum in the measured diffusivity with the formation of extended alcohol–water networks.15In the present work NMR relaxation time analysis has been conducted to support THz-TDS studies. Specifically, 1H NMR relaxation time analysis has been employed to determine the activation energy for the alkyl group of 2-propanol to undergo a molecular diffusive jump.31,32T1 is correlated to the motional correlation time, τc, and hence a measurement of T1 reveals information on the motion and reorientation of the molecules under study, i.e. a change in their interaction with neighbouring molecules.33 This process is indicated schematically in Fig. 1.
1.4 Neutron diffraction studies
Neutron diffraction techniques have not previously been employed in structural investigations of 2-propanol/water mixtures, however, their applicability for such studies is evident from previous investigations on both single-component liquids: water, methanol, ethanol and 2-propanol; and binary methanol/water, ethanol/water and 2-methyl-2-propanol/water mixtures.20,34–37 Misawa et al. have studied 1-propanol/water mixtures using SANS in the low Q region combined with large-scale reverse Monte Carlo (RMC) analysis of the data and describe the mesoscale structure of the liquids in terms of polydispersed water and alcohol clusters in which most of the molecules reside at interfaces between the clusters; however, no direct atomistic information can be extracted from these data.38 Tanaka et al. performed a neutron diffraction study of deuterated methanol and determined the geometry of molecules within the liquid.34 O–D, C–O and C–D bond lengths of 0.990 ± 0.010, 1.435 ± 0.005 and 1.085 ± 0.005 Å, respectively, were established. Zetterstrom et al. investigated the structure of 2-propanol by neutron diffraction35 and the bond lengths obtained were found to be in good agreement with those reported for methanol and ethanol.36 More recently, Takamuku and co-workers combined X-ray and neutron scattering studies to investigate the structure of methanol, methanol/water and ethanol/water mixtures.37 For the alcohol/water mixtures, the tetrahedral-like structure of water was predominant at ≥90 mol% H2O, whilst water and alcohol clusters coexist in the mixtures from ∼90–∼30 mol% H2O. Below 30 mol% H2O alcohol clusters are predominant. Dixit and co-workers have studied methanol/water mixtures using neutron diffraction and showed that most of the water molecules exist as small hydrogen bonded clusters surrounded by close-packed methyl groups, with water clusters bridging neighbouring methanol hydroxyl groups through hydrogen bonding.17 Investigating more hydrophobic alcohols, Bowron and co-workers have shown how addition of even small quantities of water perturbs the liquid structure of tertiary butanol through preferential hydrogen-bonding of the alcohol OH-group to water.39–412. Experimental
THz-TD and NMR spectroscopy measurements have been conducted across the entire 2-propanol/water composition range, while small angle neutron scattering data have been collected on sets of H/D isotopically substituted 2-propanol/water mixtures at two representative compositions of 70 and 90 mol% H2O.2.1 THz time-domain spectroscopy
 | (1) |
As described in our earlier work (conducted at 293 K as opposed to at 303 K in the present study),15 in our analysis, τ1 and τ2 were constrained to the values of the relaxation times of pure water and pure 2-propanol; these values were determined to be 7.6 and 26.6 ps, respectively, at 303 K. The relaxation strengths ε1 and ε2 are then assumed to represent the relative number of molecules present within the respective structural domains. As discussed by Li et al.,15 whilst the interpretation of ε1 is as a measure of the number of water molecules present, ε2 is taken to represent both the bulk alcohol and alcohol–water mixtures. ε3 and τ3 are associated with the femtosecond relaxation component which has been considered to be associated with the fast process of hydrogen bond formation and decomposition.11,22 The relaxation strength of the femtosecond term is extremely small and, therefore, discussion is focussed only on the two picosecond terms. It should be noted that three modes have previously been identified in the dielectric relaxation spectrum of pure 2-propanol,14,44 and that some previous work has employed two-component models to analyse aqueous solutions.11,22 It is, therefore, important to note that the aim of this work is not to determine absolute relaxation times (τ), but to use this parameter to separate the spectral response into distinct domains with different physical properties characterised by their relaxation strength (ε). Further details of this approach are provided by Li et al.15
2.2 NMR relaxation time analysis
The activation energy to a molecular reorientation, or diffusive jump,32,45 has been evaluated in this work by conducting measurements of T1 at a series of temperatures, followed by the application of an Arrhenius-type expression: | (2) |
Measurements of T1 between 298–343 K were carried-out as follows: NMR measurements were conducted using a Diff30 diffusion probe with a 10 mm r.f. coil on a Bruker DMX 300 spectrometer, operating at a 1H resonance frequency of 300.13 MHz. After heating to the desired temperature, 20 min was allowed prior to measurement to ensure thermal equilibrium. Temperature stability was ±1 K. T1 was measured using a standard inversion-recovery pulse sequence.47 The 90° and 180° pulse lengths were 10 ± 1 μs and 20 ± 2 μs, respectively. The precise pulse lengths vary with temperature and chemical system under study, hence the exact 90° and 180° pulse lengths were calibrated for each sample at each temperature studied.
2.3 Neutron diffraction
Neutron-scattering data were collected using SANDALS at the ISIS pulsed neutron and muon source at the Rutherford Appleton Laboratory, UK. The instrument has a wavelength range of 0.05 to 4.5 Å, and data were collected over a Q range of 0.1 to 50 Å−1. Each sample was contained in “null scattering” Ti0.68Zr0.32 flat plate cells with internal geometries of 1 × 35 × 35 mm, with a wall thickness of 1 mm. During measurements, the samples were maintained at a temperature of 298 K using a recirculating Julabo FP50 water bath. Measurements were made on each of the empty sample holders, the empty spectrometer, and a 3.1 mm thick vanadium standard sample for the purposes of data normalisation.Data were collected from five isotopically-substituted 2-propanol/water mixtures (2-propanol/D2O, 2-propanol-d8/H2O, 2-propanol-d8/D2O, 2-propanol-d6/D2O, 2-propanol/H2O) at 70 and 90 mol% water, and five neat 2-propanol samples (2-propanol-d8, 2-propanol-d6, 2-propanol, and 2-propanol-d8/2-propanol in 2![[thin space (1/6-em)]](https://www.rsc.org/images/entities/char_2009.gif) :
:![[thin space (1/6-em)]](https://www.rsc.org/images/entities/char_2009.gif) 1 and 1
1 and 1![[thin space (1/6-em)]](https://www.rsc.org/images/entities/char_2009.gif) :
:![[thin space (1/6-em)]](https://www.rsc.org/images/entities/char_2009.gif) 2 ratios).
2 ratios).
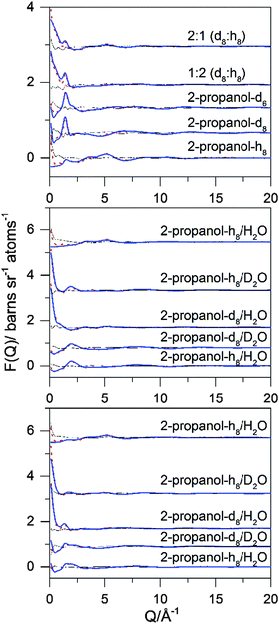
Data analysis was performed using GUDRUN,48,49 to produce a differential scattering cross section for each sample. The experimental sample densities and scattering levels were consistent with the actual isotopic compositions of the samples. Analysis of the data proceeded via refinement of atomistic models of the target systems using EPSR,50–52 and all quantities were calculated using either EPSR or dlputils.53 This refinement consists of a Monte Carlo simulation using Lennard-Jones potentials with atom-centred point charges comparing the residuals from the simulated data with experimental values in Q-space. The simulating process combines these data with basic information about the structure of the compounds and total atomic densities of the system to constrain the simulation in a chemically and physically reliable manner. The experimental total structure factors, F(Q), were measured for each of the five isotopically distinct samples at each composition.
The EPSR refinements were initialised using equilibrated Monte Carlo simulations at 298 K containing 500 molecules in a cubic box of sides 39.97, 27.11, and 30.58 Å for the neat 2-propanol, 90 and 70 mol% systems, respectively. These correspond to atomic densities of 0.0940, 0.0979, and 0.0997 atoms Å−3, derived from the experimentally determined molecular densities of the fully protiated liquids. Atom types and parameters for the reference potential used in EPSR were taken from the OPLS-AA54 and SPC/E55 force fields (see ESI,† Table S1).
3. Results
3.1 THz-TDS
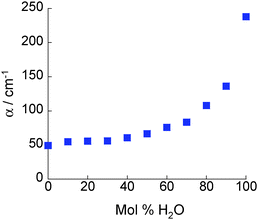
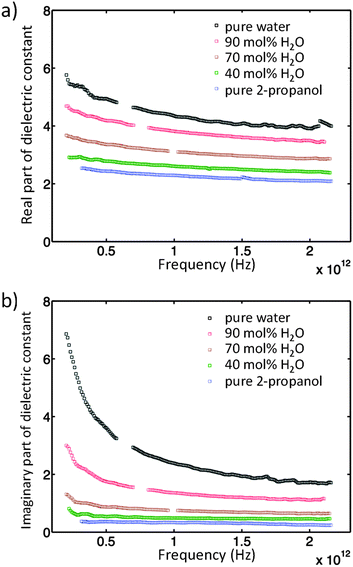
The absorption coefficients, α, of 2-propanol/water mixtures were calculated according to the Beer–Lambert law. At all concentrations a monotonic increase in α with frequency is observed. The variation in α with composition provides a measurement of the structural differences between solutions on the molecular level. Fig. 2 shows how α, determined at a frequency of 1 THz, changes with composition. Data at other frequencies also show the same trend. It is clear that a rapid increase in α is observed for water concentrations in excess of ∼90 mol% H2O.The concentration dependence of the complex dielectric spectra determined in the THz region are shown in Fig. 3. Dielectric relaxation analysis of the THz spectroscopy data has been carried out in order to differentiate between the different structural domains present in the mixtures. Fig. 4(a) shows the theoretical variation of relaxation strength (ε) with composition if the only domains present were bulk water and bulk 2-propanol structures, i.e. the ideal case in which no interactions between alcohol and water molecules and consequently no 2-propanol/water networks exist. Fig. 4(b) shows the data derived from the experimental system. While the relaxation times of components 1 and 2 were fixed to the experimentally derived values of τwater = 7.6 ps and τ2-propanol = 26.6 ps, respectively, the third component was a free variable and was determined to have a characteristic relaxation time (τ) of the order of femtoseconds, ranging from a minimal value of 107 fs (pure water) to a maximum of 161 fs (15 mol% H2O), as shown in Table S2 (ESI†). Table S2 (ESI†) indicates the dielectric relaxation parameters obtained through fitting the model. This approach follows the methodology introduced by Li et al. and further details can be found therein.15 This fs term can be assigned to the fast small rotations and translations of individual molecules or small, highly local structures.56–58 Due to the small relative relaxation strength of ε3 as compared to ε1 and ε2, the number of molecules with this relative relaxation strength is treated as negligible in the following discussions.15,57
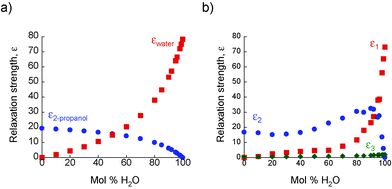 | ||
| Fig. 4 (a) The relative relaxation strength of bulk water: εwater (■) and bulk 2-propanol: ε2-propanol (●) based on the ideal non-interacting model described in the text. (b) The relative relaxation strength of the three components in eqn (1): ε1 (■), ε2 (●) and ε3 (◆) from experimental THz-TDS measurements. | ||
When comparing the results from the three-component Debye model (Fig. 4b) with the results from the non-interacting model (Fig. 4a) it is seen that ε1 is lower than εwater over the entire concentration range. As the relaxation time for this component was fixed as τwater, this indicates the presence of 2-propanol/water networks in the mixture; thereby reducing the number of water molecules existing as bulk water. The assignment of ε2 as representing the amount of both bulk alcohol and alcohol–water structures arises from the observation that ε2 takes higher values than the ideal values, ε2-propanol, derived from the non-interacting model, with a maximum at ∼90 mol% H2O. As described previously,15 and in line with the results of other workers, it is recognised that in alcohol-rich mixtures the picosecond contributions from pure alcohol and alcohol–water networks are indistinguishable in the THz data. Therefore, through an examination of the difference between the calculated value of ε2-propanol and the measured value of ε2, the structural changes occurring in 2-propanol/water mixtures become apparent. At low water concentrations the system is dominated by bulk 2-propanol structures with little or no bulk water structures present. This implies that most of the available water molecules are involved in 2-propanol/water networks. As the water concentration increases, bulk water structures emerge, with all three distinct structural domains co-existing. The number of alcohol and water molecules associated with 2-propanol/water networks increases as the number of water molecules increases (as inferred from Fig. 4, where ε2 > ε2propanol and ε1 < εwater) reaching a maximum at ∼90 mol% H2O. Above this value, little or no bulk-like 2-propanol remains; instead the alcohol molecules present are associated with water molecules. Therefore, this indicates that 2-propanol/water networks exist across the entire composition range. The presence of significant 2-propanol/water networks is consistent with previous small angle neutron scattering data acquired at 0.87 mol% H2O59 and with calculations based on the Kirkwood–Buff model which confirm alcohol–water clustering at high water concentrations.60 It is also noteworthy that it is only at these high water concentrations that a significant excess of bulk-like water exists, and, therefore, that efficient proton transfer will occur.23
Dielectric relaxation analysis has confirmed the presence of 2-propanol/water clusters and by extension the non-ideal nature of the solutions. Alcohol/water mixtures are well known to mix non-ideally, with the extent of the deviation from ideality being quantified through parameters such as excess thermodynamic functions.6 This “excess” is with regard to what would be expected from an ideal solution. In the same manner, the absorption coefficient as measured by THz-TDS deviates from that expected from an ideal solution. In order to quantify this deviation, the absorption relative to an ideal mixture was calculated. This is defined as the deviation of the measured absorption coefficients from the calculated values. The calculated values are based on measurements of single-component liquids and the non-interacting binary model, as shown in eqn (3) and (4):
| αideal(ω) = ρreal/ρideal[Vwaterαwater(ω) + Vipaαipa(ω)] | (3) |
| αrelative = αideal − αreal | (4) |
Fig. 5(a) shows the change in relative absorption coefficient as a function of composition in the 2-propanol/water mixtures. It is clear that at all compositions, the absorption coefficient of the real mixture is lower than that of the ideal mixtures. The extent of this difference, i.e. αideal − αreal or relative absorption coefficient, has previously been shown to correlate with rotational dynamics and structuring in liquids.11,15,22 A greater relative absorption coefficient indicates more retarded rotational dynamics and an increase in the structuring of extended hydrogen-bonded networks between alcohol and water molecules. 2-Propanol/water mixtures, therefore, exhibit greater structure than an ideal solution, as would be expected from the well-established excess thermodynamic properties of this mixture, with a maximum occurring at ∼90 mol% H2O.
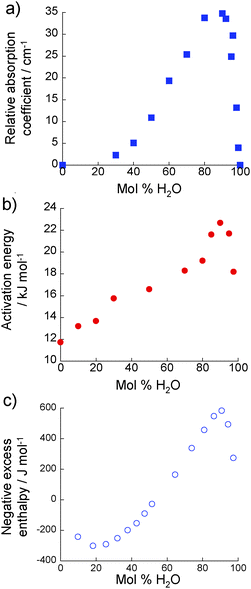 | ||
| Fig. 5 (a) Relative absorption coefficient of 2-propanol/water mixtures (303 K) at 1 THz as evaluated from THz-TDS measurements. (b) Activation energy for a molecular diffusive jump of 2-propanol in 2-propanol/water mixtures as determined using NMR relaxation time analysis. (c) Negative excess enthalpy associated with 2-propanol/water mixtures at 303 K, from ref. 6. | ||
3.2 NMR measurements
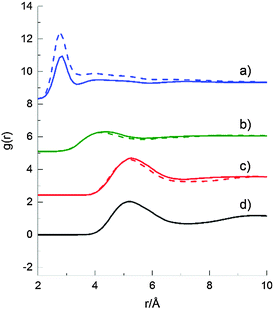
Molecule–molecule centre of mass radial distribution functions (RDFs) of 2-propanol/2-propanol, 2-propanol/water and water/water at the two compositions are shown in Fig. 7, and are compared with the corresponding RDF from neat 2-propanol. Overall, the RDF profiles at the two 2-propanol/water compositions are similar; however, there is a noticeable difference in the amplitude of the peak for the water–water partial RDF. This is largely a result of the decreased number density of water molecules in the 70 mol% H2O system, resulting in a stronger weighting of the corresponding RDFs.
The water–water near neighbour coordination number, however, (as determined from the integral under the curve between 0 and 3.4 Å) was ∼3.4 for 70 mol% H2O and ∼3.9 for 90 mol% H2O 2-propanol/water mixtures, and is a simple result of the lower alcohol concentration in the latter sample. The second broad peak centred around ∼4.5 Å, is characteristic of the hydrogen bonded network present in pure water which is largely preserved in both position and amplitude in both the 70 and 90 mol% H2O 2-propanol/water mixtures.
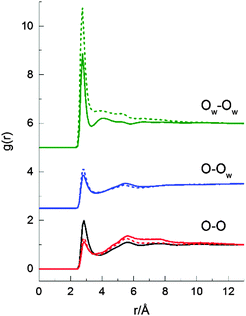
Fig. 8 shows the three oxygen–oxygen site–site RDFs from the two 2-propanol/water mixtures (70 and 90 mol% H2O) and the corresponding RDF from neat 2-propanol. O denotes the oxygen atom of a 2-propanol molecule, while OW denotes the oxygen atom of a water molecule. Information about the local oxygen–oxygen structure, association, and the presence of hydrogen bonding networks in the mixtures can be determined through examination of these RDFs. In both mixtures, the relative profiles of the three RDFs are again similar, consistent with the total RDFs shown in Fig. 7. These indicate that there are no major changes in the local structuring around either the water or 2-propanol alcohol groups. The amplitude of the first peak of the OW–OW RDF for the 70 mol% H2O 2-propanol/water mixture is larger than the corresponding peak for the 90 mol% H2O mixture; however, the position and shape are similar. The second-neighbour peaks (a signature of the hydrogen bonded network) for the O–O and, to a lesser extent, the O–OW RDFs are similar for both concentrations indicating no significant change in the extended network structure. Interestingly, a slightly better defined second shell is observed in the OW–OW RDFs at the higher water concentration which may indicate a more structured water–water hydrogen bonded network.
4. Discussion
4.1 Hydrogen bond dynamics
The relative absorption coefficient (determined from the THz-TDS analysis) and the activation energy for a molecular diffusive jump of 2-propanol (determined form the NMR relaxation time analysis) both show maxima/minima at ∼90 mol% H2O. Furthermore, this is also the concentration at which a maximum is observed in the negative excess enthalpy of 2-propanol/water mixtures (Fig. 5(c)).6 All these data show the same general profile as a function of composition; namely a slow increase as water concentration increases, reaching a maximum at ∼90 mol% H2O, followed by a much more rapid decrease. Furthermore, the most rapid rate of change occurs at very low alcohol concentrations, at most a few percent. Other properties of alcohol/water solutions are also maximised or minimised at these low concentrations. For instance, excess acoustical absorption shows a similar concentration dependence,8,62 while Brillouin scattering measurements show a maximum sound velocity in water/1-propanol mixtures at ∼90 mol% H2O.63 PFG-NMR data exhibit a minimum in the self-diffusivity of the alkyl chain of 2-propanol in water at ∼90 mol% H2O at 293 K.15 A similar composition dependence is observed for Kamlet–Taft π* values which is a measure of polarisability.64 The rapid change at high water concentrations is an indication that, from a structural dynamic viewpoint, the solution rapidly becomes to resemble bulk water. This will have significant consequences in, e.g. facilitating proton transfer23 or the availability of water molecules, and therefore on any process or device which may depend on these. Examples of such processes include hydrogenation catalysis and proton-exchange membranes. Here, the observation that the properties of the solution below 90 mol% H2O differ significantly from those of bulk water is supported by the results of complementary ab initio molecular dynamics simulations. These show that proton transfer is ∼27 times faster in pure water than in a 87 mol% H2O 2-propanol/water mixture.5 That proton transfer involves an extended network of water molecules and not simply those directly bound to the proton has been recently evidenced by THz-TDS, with ∼15 water molecules calculated to be involved in such processes.23The observation that the activation energy, relative absorption coefficient and excess enthalpy all correlate with each other can be assigned to the fact that all are related to HB dynamics. Excess enthalpy is essentially a measure of the average strength of intermolecular interactions.14 A higher magnitude of excess enthalpy therefore suggests stronger, more long-lived, HBs in the mixture, as do the more retarded dynamics evidenced by THz-TDS and the higher activation to a molecular diffusive jump indicated by NMR. It is worth noting that neutron diffraction studies have previously shown that it is the strength, and not the number, of HBs that change on the addition of alcohol to pure water.17 The present study supports the conclusion that the ability of 2-propanol to interact with other molecules in solution is directly controlled by the hydrogen bonding structure of the mixture and the dynamics of those HBs. We now demonstrate in Section 4.2 that the size of these hydrogen bonded clusters is provided through an analysis of both THz-TDS and neutron diffraction data.
4.2 Hydration shell analysis
Analysis of the neutron diffraction data presented in Section 3.3 also allows for a quantitative analysis of the hydration shell around 2-propanol. For 70 and 90 mol% H2O 2-propanol/water mixtures, the coordination numbers found in the first shell for each of the centre-of-mass as well as the oxygen–hydrogen and the carbon–carbon partial RDFs are summarised in Table 1. These numbers are correlated with data for neat 2-propanol and water.| Radial distribution function | 70 mol% H2O | 90 mol% H2O | Neat | Max distance/Å |
|---|---|---|---|---|
| Centre-of-mass | ||||
| Water around water | 3.4 | 3.9 | — | 3.4 |
| 2-Propanol around water | 2.7 | 1.4 | — | 5.8 |
| Water around 2-propanol | 6.2 | 12.4 | — | 5.6 |
| 2-Propanol around 2-propanol | 8.6 | 4.4 | 11.9 | 7.2 |
| Water total | 6.1 | 5.3 | ||
| 2-Propanol total | 14.8 | 16.8 | 11.9 | |
| Oxygen–hydrogen partial RDF | ||||
| Water around water | 2.5 | 3.2 | 3.617 | 2.4 |
| 2-Propanol around water | 0.4 | 0.2 | — | 2.5 |
| Water around 2-propanol | 1.0 | 1.4 | — | 2.5 |
| 2-Propanol around 2-propanol | 0.4 | 0.2 | 0.9 | 2.7 |
| Water total | 2.9 | 3.4 | 3.617 | |
| 2-Propanol total | 1.4 | 1.6 | 0.9 | |
| Carbon–carbon partial RDF | ||||
| Methyl C around methyl C | 6.7 | 3.4 | 9.2 | 4.7 |
In the pure 2-propanol, the first-shell centre-of-mass coordination number is 11.9. In the mixed systems, the number of water molecules present in the first solvation shell of the 2-propanol molecules is found to increase with the mole fraction of water. A concomitant decrease in the number of 2-propanol molecules is also found, highlighting the replacement of the alcohol by water in the first solvation shell of the alcohol. Each 2-propanol is replaced by 1.9 and 1.7 water molecules in the 70 and 90 mol% H2O systems, respectively. This difference is a reflection of the non-ideal mixing in the present systems. In a similar manner, the solvation shell around water is perturbed in going from the lower to higher concentration of 2-propanol, with the number of resident water molecules reduced, and the number of alcohol molecules doubled. The environment of the first coordination shell around water is able to accommodate the 2-propanol molecules relatively easily. Due to the bulky nature of the alcohol this suggests that this is via hydrogen bonding, rather than simple incorporation of the methyl groups into the shell.
Despite a centre-of-mass coordination number of 11.9 in pure 2-propanol, integration of the O–H partial RDFs up to the first minimum (in line with the analysis of Dixit et al.)17 reveals that only 0.9 hydrogen bond contacts are formed by the oxygen at the centre. This compares with a value of 1.8 calculated for methanol, and is consistent with the bulkier nature of the aliphatic group in the present case. Herein, the predominant type of contact between 2-propanol molecules is between methyl groups. In fact, an examination of the C–C partial radial distribution function (see ESI,† Fig. S1) show a methyl–methyl coordination number of 9.2, integrating up to 4.7 Å. Coordination numbers from the mixed systems show that hydrogen bonding between 2-propanol molecules is significantly reduced by the presence of the water, with only 0.2 remaining in the case of the lower concentration of alcohol. Clearly, hydrogen bonding with water is more favourable, with 1.0 and 1.4 contacts formed between the 2-propanol OH group and the water in the 70 and 90 mol% systems, respectively, of which approximately 35% are attributable to the 2-propanol acting as the H-bond donor. In line with this, the number of hydrogen bonds between water molecules reduces from 3.2 to 2.5 on moving to the lower mol% H2O system which can be compared with 3.6 molecules in the pure water system.17
Using values of 0.9 and 3.617 hydrogen bonds in pure 2-propanol and water, respectively, the expected number of hydrogen bonds per molecule in the 90 mol% H2O mixture is calculated as 3.3, assuming ideal mixing between the two species, while for 70 mol% H2O mixture the expected number is 2.8. From the discussion above we can see that the overall number of hydrogen bonds each 2-propanol OH group is involved in increases on the addition of water into the system. The inference from these data is that hydrogen bonding contacts between alcohol molecules are reduced in favour of contacts with water molecules, and this is reflected in the increased number of water molecules in the primary coordination shell. The net result of this is that, while the number of hydrogen bonding contacts between 2-propanol molecules decreases, the overall number increases significantly due to additional interactions with water molecules. In terms of contacts between hydrophobic groups, even in the 90 mol% H2O system there is still significant clustering of methyl groups, with the relevant coordination number calculated as 3.4.
The hydrogen bonding network in such a system is not quantified easily by simple coordination numbers. Calculations of clusters sizes formed from continuous O–O contacts between molecules of less than 3.1 Å suggest that in neat 2-propanol ∼40% of alcohol molecules are, at any one instant, isolated and not participating in hydrogen bonding with other alcohol molecules. In the 70 mol% H2O mixture this rises to ∼56%, and in the 90 mol% H2O to 77%, again confirming the breakup of 2-propanol clusters by the water. Combined with the coordination numbers of methyl groups, this suggests a picture of 2-propanol molecules that tend not to interact with each other via hydrogen bonding, but instead tend to cluster through close-contacts with their methyl groups, thus minimising hydrophobic contacts with the solvent.
Fig. 9 shows the spatial probability densities of 2-propanol and water around a central 2-propanol. In neat 2-propanol we observe that the oxygen atoms of the alcohol favour the region around the OH group, and the methyl carbons tend to aggregate at the hydrophobic end of the molecule – this is clearly related to 2-propanol⋯2-propanol hydrogen bonding. In comparison to the neat system, a decrease in alcohol–alcohol coordination through the O-atom is observed in the aqueous alcohol mixtures, with the lobe of oxygen atom density disappearing. Nevertheless, the density associated with the methyl carbons persists. Hydrogen bond formation with water is evidenced by the distinct halo of high probability circling the 2-propanol OH group. The decrease in the 2-propanol OH–OH coordination, can be ascribed to increased competition from water for the 2-propanol OH group, which occurs through the insertion of water at the shorter distances causing disruption of the alcohol–alcohol probability distribution (Fig. 9).
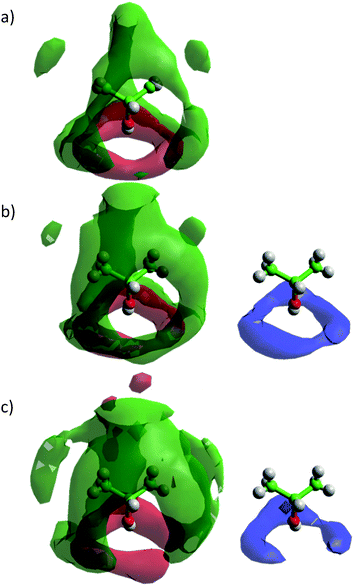 | ||
| Fig. 9 Spatial probability densities of 2-propanol (methyl group distribution – green; oxygen – red) and water (blue) showing 50% of all points collected for each simulation box up to the first minimum of the corresponding RDF and a cutoff of 4ρ for methyl group distribution, 2ρ for oxygen distribution and 2ρ for water distribution, where ρ is the corresponding number density, in (a) neat 2-propanol and (b) 70 mol% H2O and (c) 90 mol% H2O 2-propanol/water mixtures. Graphs have been plotted using Aten.66 | ||
At both 70 and 90 mol% H2O concentrations, the 2-propanol OH groups experience a heterogeneous environment in which they interact with both 2-propanol and water species. The ratio between the number of hydrogen bonds formed by water and 2-propanol molecules to a central alcohol molecule decreases from 7.0![[thin space (1/6-em)]](https://www.rsc.org/images/entities/char_2009.gif) :
:![[thin space (1/6-em)]](https://www.rsc.org/images/entities/char_2009.gif) 1 at 90 mol% H2O to 2.5
1 at 90 mol% H2O to 2.5![[thin space (1/6-em)]](https://www.rsc.org/images/entities/char_2009.gif) :
:![[thin space (1/6-em)]](https://www.rsc.org/images/entities/char_2009.gif) 1 at the lower water concentration. These values compare with ratios of 9.0
1 at the lower water concentration. These values compare with ratios of 9.0![[thin space (1/6-em)]](https://www.rsc.org/images/entities/char_2009.gif) :
:![[thin space (1/6-em)]](https://www.rsc.org/images/entities/char_2009.gif) 1 and 2.3
1 and 2.3![[thin space (1/6-em)]](https://www.rsc.org/images/entities/char_2009.gif) :
:![[thin space (1/6-em)]](https://www.rsc.org/images/entities/char_2009.gif) 1 at 90 and 70 mol% H2O, respectively, based on the stoichiometric composition of the mixtures, i.e. ideal mixing. These results indicate that, at the higher concentration of 2-propanol, the system is relatively well-mixed with the relative ratio of hydrogen bonds formed depending on the composition of the mixture. However, for the 90 mol% H2O system the ratio is slightly lower than expected, indicating a higher number of H-bond contacts formed between 2-propanol molecules than would be expected based on purely stoichiometric arguments, and suggests more clustering of alcohol molecules at the lower concentration. The role of hydrophobic methyl–methyl interaction in these mixtures should not be discounted, and will play an important role in stabilising small clusters.
1 at 90 and 70 mol% H2O, respectively, based on the stoichiometric composition of the mixtures, i.e. ideal mixing. These results indicate that, at the higher concentration of 2-propanol, the system is relatively well-mixed with the relative ratio of hydrogen bonds formed depending on the composition of the mixture. However, for the 90 mol% H2O system the ratio is slightly lower than expected, indicating a higher number of H-bond contacts formed between 2-propanol molecules than would be expected based on purely stoichiometric arguments, and suggests more clustering of alcohol molecules at the lower concentration. The role of hydrophobic methyl–methyl interaction in these mixtures should not be discounted, and will play an important role in stabilising small clusters.
The size of the hydration shell formed around 2-propanol molecules at 90 mol% H2O has been calculated from THz-TDS analysis as previously described,15 based on the number ratio between water and 2-propanol molecules in the hydrogen-bonded network, and shows a value of 5.0 ± 0.2 water molecules per 2-propanol. The neutron results, however, indicate that only 1.4 water molecules are hydrogen bonding to each 2-propanol at any given time. Furthermore, the value of 12.4 calculated from the centre-of-mass RDFs is also significantly different, and leads to the question of what precisely is being probed by the experimental analysis. To clarify this, the mean number of water molecules around 2-propanol OH groups, formed through hydrogen bond networks has been calculated from the neutron data.
Enforcing a maximum distance of 2.45 Å for the hydrogen bond, and allowing at most two ‘jumps’ from the originating alcohol moiety, we calculate numbers of 2.2 and 4.1 for the 70 and 90 mol% water systems, respectively. These numbers reflect the total number of water molecules that are either hydrogen bonding directly to a given 2-propanol OH group, or are hydrogen bonding to one of these primary molecules. This therefore represents those solvent molecules that are directly or strongly associated with the alcohol OH group. In particular, the value of 4.1 agrees well with that obtained from THz-TDS analysis, suggesting that the experimental technique is in fact probing this extended water neighbourhood. Interestingly, this analysis reveals that around one third of the 2-propanol molecules in the 30 mol% water system are not directly bound to any water molecules (given the distance criterion above). For the 90 mol% water system the percentage of alcohol molecules not hydrogen bonding to any water molecules is considerably smaller at around 16%, and reflects the better mixing present in the case of higher water mole fraction.
The results reported herein, correlate well with other analyses of alcohol–water clusters. For instance, through neutron diffraction studies Dixit and co-workers17 identified that methanol molecules in aqueous solution formed 2.0 hydrogen bonds at a concentration of 30 mol% H2O, while at 70 mol% H2O Bakó et al. determined a value of 2.2 HBs in methanol/water clusters.65 Elsewhere, Bowron and co-workers showed that addition of as little as 0.14 mol% of water to tertiary butanol transformed the neat alcohol structure to that of bulk alcohol/water mixtures through formation of preferential hydrogen-bonding of alcohol OH-groups to water.39–42 Similarly, Misawa et al. interpreted the structure of 1-propanol/water in terms of intercalating clusters with the bulk of both alcohol and water molecules existing at the interfaces, where one would anticipate a greater degree of interaction, i.e. hydrogen-bonding. 2-propanol is a significantly larger molecule than methanol and hence can be expected to have a larger hydration shell.38 Previously, we have shown that THz-TDS analysis of the ratio of methanol to water molecules in methanol/water mixtures is in good agreement with literature data.15
5. Conclusions
Excellent agreement has been observed between the relative absorption coefficient as measured by THz-TDS, activation energy to molecular diffusive jumps as measured by NMR relaxation time analysis and excess thermodynamic function data. This agreement extends to the value at which the observed maxima occur, i.e. ∼90 mol% H2O, and the shape of the curves as a function of composition. All of these parameters are directly related to HB dynamics and the presence of mixed 2-propanol/water networks which persist over the entire composition range. Neutron diffraction data provide evidence of the aggregation of the 2-propanol and water molecules. These aggregates are stabilised by the hydrogen bonding network. In addition, good agreement is found for the composition of the aggregates determined by THz-TDS and neutron scattering analysis, albeit with a reasonably high error from the latter due to the difficulty in determining the radial distribution cutoff distance. Both techniques indicate that the ratio of water to 2-propanol molecules in mixed 2-propanol/water aggregates at a composition of 90 mol% H2O is between 4–5![[thin space (1/6-em)]](https://www.rsc.org/images/entities/char_2009.gif) :
:![[thin space (1/6-em)]](https://www.rsc.org/images/entities/char_2009.gif) 1. The liquid structuring observed in the present work will impact on physical or chemical processes occurring in 2-propanol/water mixtures. A specific example of this is explored in a parallel work where such mixtures are used as the solvent in the heterogeneous catalytic hydrogenation of 2-butanone.5 The dependence of reaction rate on solvent composition is discussed therein.
1. The liquid structuring observed in the present work will impact on physical or chemical processes occurring in 2-propanol/water mixtures. A specific example of this is explored in a parallel work where such mixtures are used as the solvent in the heterogeneous catalytic hydrogenation of 2-butanone.5 The dependence of reaction rate on solvent composition is discussed therein.
Acknowledgements
The authors would like to acknowledge CASTech (EPSRC grant EP/G011397/1), RCUK Basic Technology Grant (EP/E048811/1), STFC for beamtime allocation (RB910286) and Jon Mitchell (Cambridge) for valuable discussions.Notes and references
- C. Corsaro, J. Spooren, C. Branca, N. Leone, M. Broccio, C. Kim, S. H. Chen, H. E. Stanley and F. Mallamace, J. Phys. Chem. B, 2008, 112, 10449–10454 CrossRef CAS PubMed.
- D. R. Palo, R. A. Dagle and J. D. Holladay, Chem. Rev., 2007, 107, 3992–4021 CrossRef CAS PubMed.
- P. Kumar, Z. Yan, L. Xu, M. G. Mazza, S. V. Buldyrev, S. H. Chen, S. Sastry and H. E. Stanley, Phys. Rev. Lett., 2006, 97, 177802 CrossRef PubMed.
- S. H. Chen, L. Liu, E. Fratini, P. Baglioni, A. Faraone and E. Mamontov, Proc. Natl. Acad. Sci. U. S. A., 2006, 103, 9012–9016 CrossRef CAS PubMed.
- B. S. Akpa, C. D'Agostino, L. F. Gladden, K. Hindle, J. McGregor, H. Manyar, R. Li, M. Neurock, D. W. Rooney, N. Sinha, E. H. Stitt, D. Weber and J. A. Zeitler, J. Catal., 2012, 289, 30–41 CrossRef CAS.
- J. R. Battler, W. M. Clark and R. L. Rowley, J. Chem. Eng. Data, 1985, 30, 254–259 CrossRef CAS.
- K. Soliman and E. Marschall, J. Chem. Eng. Data, 2002, 35, 375–381 CrossRef.
- M. Akramova, O. Shokirow and T. Nurtidinov, Dokl. Akad. Nauk Tadzh. SSR, 1976, 19, 27–30 CAS.
- Z. J. Derlacki, A. J. Easteal, A. V. J. Edge, L. A. Woolf and Z. Roksandic, J. Phys. Chem., 1985, 89, 5318–5322 CrossRef CAS.
- N. Micali, S. Trusso, C. Vasi, D. Blaudez and F. Mallamace, Phys. Rev. E: Stat. Phys., Plasmas, Fluids, Relat. Interdiscip. Top., 1996, 54, 1720–1724 CrossRef CAS.
- D. S. Venables and C. A. Schmuttenmaer, J. Chem. Phys., 2000, 113, 11222–11236 CrossRef CAS.
- L. Dougan, R. Hargreaves, S. P. Bates, J. L. Finney, V. Reat, A. K. Soper and J. Crain, J. Chem. Phys., 2005, 122, 174514 CrossRef CAS PubMed.
- H. Lapid, N. Agmon, M. K. Petersen and G. A. Voth, J. Chem. Phys., 2005, 122, 014506 CrossRef PubMed.
- T. Sato and R. Buchner, J. Chem. Phys., 2003, 119, 10789–10800 CrossRef CAS.
- R. Li, C. D'Agostino, J. McGregor, M. D. Mantle, J. A. Zeitler and L. F. Gladden, J. Phys. Chem. B, 2014, 118, 10156 CrossRef CAS PubMed.
- H. S. Frank and M. W. Evans, J. Chem. Phys., 1945, 13, 507–532 CrossRef CAS.
- S. Dixit, J. Crain, W. C. K. Poon, J. L. Finney and A. K. Soper, Nature, 2002, 416, 829–832 CrossRef CAS PubMed.
- L. Dougan, S. P. Bates, R. Hargreaves, J. P. Fox, J. Crain, J. L. Finney, V. Reat and A. K. Soper, J. Chem. Phys., 2004, 121, 6456–6462 CrossRef CAS PubMed.
- A. K. Soper, L. Dougan, J. Crain and J. L. Finney, J. Phys. Chem. B, 2006, 110, 3472–3476 CrossRef CAS PubMed.
- P. A. Artola, A. Raihane, C. Crauste-Thibierge, D. Merlet, M. Emo, C. Alba-Simionesco and B. Rousseau, J. Phys. Chem. B, 2013, 117, 9718 CrossRef CAS PubMed.
- I. Juurinen, T. Pylkkanen, C. J. Sahle, L. Simonelli, K. Hämäläinen, S. Huotari and M. Hakala, J. Phys. Chem. B, 2014, 118, 8750 CrossRef CAS PubMed.
- D. S. Venables and C. A. Schmuttenmaer, J. Chem. Phys., 1998, 108, 4935–4944 CrossRef CAS.
- K. J. Tielrooij, R. L. A. Timmer, H. J. Bakker and M. Bonn, Phys. Rev. Lett., 2009, 102, 198303 CrossRef CAS PubMed.
- D. A. Schmidt, Ö. Birer, S. Funkner, B. P. Born, R. Gnanasekaran, G. W. Schwaab, D. M. Leitner and M. Havenith, J. Am. Chem. Soc., 2009, 131, 18512–18517 CrossRef CAS PubMed.
- M. Heyden, E. Bründermann, U. Heugen, G. Niehues, D. M. Leitner and M. Havenith, J. Am. Chem. Soc., 2008, 130, 5773–5779 CrossRef CAS PubMed.
- U. Heugen, G. Schwaab, E. Bründermann, M. Heyden, X. Yu, D. M. Leitner and M. Havenith, Proc. Natl. Acad. Sci. U. S. A., 2006, 103, 12301–12306 CrossRef CAS PubMed.
- B. Born, H. Weingärtner, E. Bründermann and M. Havenith, J. Am. Chem. Soc., 2009, 131, 3752–3755 CrossRef CAS PubMed.
- S. Ebbinghaus, S. J. Kim, M. Heyden, X. Yu, U. Heugen, M. Gruebele, D. M. Leitner and M. Havenith, Proc. Natl. Acad. Sci. U. S. A., 2007, 104, 20749–20752 CrossRef CAS PubMed.
- B. Born, S. J. Kim, S. Ebbinghaus, M. Gruebele and M. Havenith, Faraday Discuss., 2009, 141, 161–173 RSC.
- M. Nakahara, C. Wakai, Y. Yoshimoto and N. Matubayasi, J. Phys. Chem., 1996, 100, 1345–1349 CrossRef CAS.
- K. T. Gillen, M. Schwartz and J. H. Noggle, Mol. Phys., 1971, 20, 599 CrossRef.
- S. Godefroy, M. Fleury, F. Deflandre and J. P. Korb, J. Phys. Chem. B, 2002, 106, 11183–11190 CrossRef CAS.
- N. Bloembergen, E. M. Purcell and R. V. Pound, Phys. Rev., 1948, 73, 679–712 CrossRef CAS.
- Y. Tanaka, N. Ohtomo and K. Arakawa, Bull. Chem. Soc. Jpn., 1984, 57, 644–647 CrossRef CAS.
- P. Zetterstrom, U. Dahlborg, R. G. Delaplane and W. S. Howells, Phys. Scr., 1991, 44, 56–62 CrossRef.
- D. G. Montague, I. P. Gibson and J. C. Dore, Mol. Phys., 1981, 44, 1355–1367 CrossRef CAS.
- T. Takamuku, K. Saisho, S. Aoki and T. Yamaguchi, Z. Naturforsch., A: Phys. Sci., 2002, 57, 982–994 CrossRef CAS.
- M. Misawa, I. Dairoku, A. Honma, Y. Yamada, T. Sato, K. Maruyama, K. Mori, S. Suzuki and T. Otomo, J. Chem. Phys., 2004, 121, 4716–4723 CrossRef CAS PubMed.
- D. T. Bowron, A. K. Soper and J. L. Finney, J. Chem. Phys., 2001, 114, 6203–6219 CrossRef CAS.
- D. T. Bowron and S. D. Moreno, J. Chem. Phys., 2002, 117, 3753–3762 CrossRef CAS.
- D. T. Bowron and S. D. Moreno, J. Phys.: Condens. Matter, 2003, 15, S121–S127 CrossRef CAS.
- J. L. Finney, D. T. Bowron and A. K. Soper, J. Phys.: Condens. Matter, 2000, 12, A123–A128 CrossRef CAS.
- E. P. J. Parrott, J. A. Zeitler, T. Friščić, M. Pepper, W. Jones, G. M. Day and L. F. Gladden, Cryst. Growth Des., 2009, 9, 1452–1460 CAS.
- T. Sato and R. Buchner, J. Chem. Phys., 2003, 118, 4606–4613 CrossRef CAS.
- E. Fukushima and S. B. W. Roeder, Experimental Pulse NMR, A Nuts and Bolts. Approach, Perseus Books, Reading, Massachusetts, 1981, p. 147 Search PubMed.
- Y. Zhou, K. Hu, J. Shen, X. Wu and G. Cheng, J. Mol. Struct., 2009, 921, 150–155 CrossRef CAS.
- R. L. Vold, J. S. Waugh, M. P. Klein and D. E. Phelps, J. Chem. Phys., 1968, 48, 3831–3832 CrossRef CAS.
- A. K. Soper, W. S. Howells and A. C. Hannon, ATLAS Analysis of Time of Flight Diffraction Data from Liquid and Amorphous Samples, Rutherford Appleton Laboratory, 1989 Search PubMed.
- A. C. Hannon, W. S. Howells and A. K. Soper, Inst. Phys. Conf. Ser., 1990, 107, 193–211 Search PubMed.
- A. K. Soper, Chem. Phys., 1996, 202, 295–306 CrossRef CAS.
- A. K. Soper, Chem. Phys., 2000, 258, 121–137 CrossRef CAS.
- A. K. Soper, Mol. Phys., 2001, 99, 1503–1516 CrossRef CAS.
- T. G. A. Youngs, dlputils, version 1.3.9, http://www.projectaten.net/dlputils (accessed May 2015).
- W. L. Jorgensen and J. Tirado-Rives, J. Am. Chem. Soc., 1988, 110, 1657–1666 CrossRef CAS.
- H. J. C. Berendsen, J. R. Grigera and T. P. Straatsma, J. Phys. Chem., 1987, 91, 6269–6272 CrossRef CAS.
- M. Koeberg, C. C. Wu, D. Kim and M. Bonn, Chem. Phys. Lett., 2007, 439, 60–64 CrossRef CAS.
- K. J. Tielrooij, D. Paparo, L. Piatkowski, H. J. Bakker and M. Bonn, Biophys. J., 2009, 97, 2484–2492 CrossRef CAS PubMed.
- C. Rønne, L. Thrane, P.-O. Åstrand, A. Wallqvist, K. V. Mikkelsen and S. R. Keiding, J. Chem. Phys., 1997, 107, 5319–5331 CrossRef.
- G. D'Arrigo and J. Teixeira, J. Chem. Soc., Faraday Trans., 1990, 86, 1503–1509 RSC.
- I. Shulgin and E. Ruckenstein, J. Phys. Chem. B, 1999, 103, 872–877 CrossRef CAS.
- S. J. Suresh and V. M. Naik, J. Chem. Phys., 2000, 113, 9727–9732 CrossRef CAS.
- O. N. Awasthi and S. Sathish, Indian J. Pure Appl. Phys., 1978, 16, 489–491 CAS.
- Y. Seshimo, Y. Ike and S. Kojima, Jpn. J. Appl. Phys., 2008, 47, 3836–3838 CrossRef CAS.
- W. J. Cheong and P. W. Carr, Anal. Chem., 1988, 60, 820–826 CrossRef CAS.
- I. Bakó, T. Megyes, S. Balint, T. Grosz and V. Chihaia, Phys. Chem. Chem. Phys., 2008, 10, 5004–5011 RSC.
- T. G. A. Youngs, J. Comput. Chem., 2010, 31, 639–648 CAS.
Footnotes |
| † Electronic supplementary information (ESI) available. See DOI: 10.1039/c5cp01132a |
| ‡ Present address: Department of Chemical and Biological Engineering University of Sheffield, Sheffield S1 3JD, UK. |
| § Present address: ISIS Neutron and Muon Source, Science and Technology Facilities Council, Rutherford Appleton Laboratory, Harwell Oxford, Didcot OX11 0QX, UK. |
| This journal is © the Owner Societies 2015 |

