
 Open Access Article
 This Open Access Article is licensed under a
 Creative Commons Attribution 3.0 Unported Licence
A THz/FTIR fingerprint of the solvated proton: evidence for Eigen structure and Zundel dynamics
Dominique
Decka
,
Gerhard
Schwaab
* and
Martina
Havenith
Department of Physical Chemistry II, Ruhr-University Bochum, Germany. E-mail: gerhard.schwaab@rub.de; Fax: +49 (0)234 321 4183; Tel: +49 (0)234 322 4256
First published on 10th April 2015
Abstract
In continuation of earlier work on La(III), Ni(II) and Mn(II) halides, we present low frequency (30–400 cm−1) spectra of solvated HCl and HBr as a function of solute concentration. This frequency range provides direct access to water network modes and changes induced by solvated solutes. We were able to dissect the spectra into components associated to solvated ions and ion pairs using a chemical equilibrium model in combination with principal component analysis. While the Cl− rattling mode at 190 cm−1 is found to be unchanged, the Br− resonance around 90 cm−1 is decreased in intensity below the detection threshold when replacing the divalent or trivalent metal ions by a proton. The solvated proton shows two resonances: a solvation water mode around 140 cm−1 and a high frequency resonance at 325 cm−1 that we assign to the rattling motion of an Eigen structure H3O+ in its solvation cage. This assignment is corroborated by isotopic substitution measurements which show a redshift of the high frequency peak when HCl/H2O is replaced by DCl/D2O. The linewidth of the H3O+ rattling mode corresponds to a relaxation time of the oscillatory process of τ ≈ 60 fs, considerably faster than the relaxation time of τ ≈ 160 fs for Cl−. In addition, we find a broad background that we attribute to fast non-oscillatory motions of a proton in a Zundel-like complex. Our results are in agreement with an Eigen–Zundel–Eigen (EZE) model of proton transport. Upon ion pairing the broad background is strongly reduced indicating a reduction of fast proton transfer processes. The Cl− resonance blueshifts by 20 cm−1 which indicates a transition from free ions to a solvent shared ion pair. Surprisingly, the center frequency of the Eigen complex does not change upon ion pairing. This can be rationalized in terms of an unchanged local solvation structure.
1 Introduction
The microscopic structure and dynamics of the solvated proton are essential to understand a plethora of chemical and biochemical processes ranging from acid reactions to enzymatic catalyis.1 Several recent reviews summarize the large computational and experimental efforts to resolve this topic.2–7 Nevertheless, there is still a controversy on the size and structure of the solvated proton complex and the dynamical processes that lead to the exceptionally high equivalent conductivity of protons.The latter effect was first rationalized in 1806 by C. J. T. de Grotthuss picturing a ‘simple’ hopping mechanism of (positively charged) hydrogen along a water chain, the so-called Grotthuss mechanism.2,8 Based on a multitude of experimental data, this picture was renewed by M. Eigen and others who found that the proton is permanently hydrated (primary hydration) and better described as H3O+. This Eigen cation is strongly interacting with its first solvation shell (secondary hydration) forming H9O4+, the Eigen complex.1 Later on, G. Zundel and coworkers found a continuum absorption in their IR-spectra of acids which they explained by introduction of H5O2+.9,10 This so called Zundel cation was thought as part of a proton transport mechanism involving proton tunneling.11–13 However, pioneering ab initio studies by Tuckerman et al.14,15 showed that the solvated proton fluctuates between the Eigen and Zundel forms and that proton transport does not require a tunneling mechanism since the energy barrier vanishes with decreasing O–O distance.
The discussion whether the Eigen, the Zundel or even other cationic forms are predominant is still ongoing.3,6,16–19 Part of the controversy is owing to the fact that most gas phase measurements and simulations focus on protonated water clusters neglecting the effects of the counter anion and ion pairing.19–21 This makes a comparison to measurements of concentrated acidic solutions difficult.22–24 Another challenge is the fast dynamics of the hydrogen bond network and the unknown mixing ratio of Eigen and Zundel complexes in a proton rich environment which complicates the data interpretation of standard structural methods like neutron scattering and infrared fingerprinting measurements.6,17,25,26
Nowadays, a multitude of simulations of the isolated proton yield a picture where the Eigen and Zundel forms are merely limiting cases or just part of a highly dynamic system involving the proton and its solvation environment.2–5,7,27,28 In some cases, ultrafast conversion between both structures was postulated.14,29 Recently, a rather complex picture of proton transport along a ‘proton wire’ spanning several hydrogen bonds was postulated by Hassanali et al. in a first principles study.19 Simulations of aqueous acidic solutions are less abundant.23,30,31,32 While some of these investigations predict contact or solvent shared ion pairing between oppositely charged ions,30,31 others find a tendency of metastable contact ion pairs of hydrated excess protons.32
Experimental studies of the solvated proton have been carried out along two directions. Gas phase infrared pre-dissociation spectroscopic measurements of protonated water clusters20,21,33,34 show spectra that depend heavily on the water cluster size indicating a strong size dependence of the local cage structure surrounding the solvated proton. Similar experiments on Zundel-type protonated complexes35 demonstrated that the observed center frequencies depend sensitively on the local solvation environment. Other studies focus on medium to high concentration aqueous acidic solutions mainly using HCl and HBr as simple model systems. Early work of Triolo and Narten in 1975 based on X-ray diffraction (XRD) and neutron diffraction with isotopic substitution (NDIS) describes the structure of an aqueous HCl solution as random tetrahedral network of oxygen atoms giving no indication if the Eigen or Zundel form prevails.22 A more recent NDIS study by Botti et al.17,36 could reproduce the observed data equally well in a Monte Carlo analysis of the data when using either H+, H3O+, or H5O2+ as basic structure for the solvated proton. Photoelectron spectra18 of hydrochloric acid (HCl) yielded no evidence for the H5O2+ structure of the proton. In contrast NMR and ATR-FTIR spectra of HCl(aq) show indications that both the Eigen and the Zundel complex are present in solution, with the Eigen form being the most abundant proton complex in agreement with theoretical results.23,25,26,37 At higher concentration (6–16 M), more recent X-ray absorption fine structure (XAFS) measurements of aqueous HCl solutions yield Zundel-like ion pairs of Cl− and hydronium with a proton in the center and a Cl−–H+ distance comparable to the Zundel cation.38 This is in agreement with a density functional theory based study which postulated the presence of solvent separated ion pairs for the dilute solution (2.7 M) and contact ion pairs for more concentrated solutions (5.3 M).31 Based on concentration dependent infrared spectroscopic studies Stoyanov et al.6,39 concluded that the proton is solvated by six water and that its predominant structure in acidic solution is H13O6+ including a Zundel-like moiety at the center with a particularly large O–O distance of 2.57 Å. Chen et al. performed X-ray Raman and small angle X-ray scattering experiments on aqueous HCl and NaOH solutions and deduced the presence of locally strengthened hydrogen bonds around the proton40 as it was theoretically predicted by Markovitch and Agmon.41 Time resolved femtosecond pump–probe spectroscopy has also been used on acidic solutions24,42 and yielded very short proton relaxation times in the range 120–200 fs and a fast interconversion between the Eigen and Zundel forms. Tielrooij et al.43 compared terahertz time-domain spectra (THz-TDS) of acidic solutions to those of simple electrolytes and postulated Eigen complex structures and an extended water complex as part of a proton transport mechanism.
So far, precise absorption measurements in the frequency range 30–400 cm−1 are missing. To fill this gap, in the present study, we use concentration dependent THz/FTIR absorption spectroscopy to characterize HCl(aq). This technique is a powerful tool to investigate the hydration dynamics of solute molecules. Previous studies included proteins44 as well as zwitterions (e.g. glycine45) and ionic salts.46–49 For electrolyte solutions, we were able to separate solvated ion and ion pair spectra and to dissect the solvated ion spectrum into anion, cation and hydration water contributions.49 Here, we aim to apply the same method to obtain information on the solvation environment of the solvated proton and its ion pair complex.
2 Material and methods
Hydrochloric and hydrobromic acid solutions in the concentration range 0.05 M to 3.2 M were prepared using 12 M stock solution (Sigma-Aldrich) by using HPLC grade ultra pure water. DCl in D2O solutions were prepared from 35% (weight) solutions of DCl (Sigma Aldrich) in D2O (Deutero). Apparent molar volumes of HCl and HBr were taken from literature,50,51 those of DCl from density measurements employing an Anton Paar DMA 58 density meter at 20 ± 0.2 °C.Broadband FIR Fourier Transform absorption spectroscopic measurements were carried out using a Bruker Vertex 80 V FTIR spectrometer with a mylar multilayer beamsplitter in combination with a liquid helium cooled Si bolometer (Infrared Laboratories) as detector and a mercury arc lamp as radiation source. For an extended description of the technique refer to Schmidt et al.46 The electrolyte solutions were measured in the concentration ranges 0.05–2.5 M, 0.4–3.2 M, and 0.6–2.5 M for HCl, HBr, and DCl, respectively. As sample holder served a commercial Bruker liquid cell with CVD grown diamond windows (500 ± 100 μm thickness; Diamond Materials, GmbH). This guaranteed maximum transparency over a broad frequency range (30–400 cm−1). The liquid layer thickness was maintained using 25 ± 5 μm thick Kapton spacers. The exact spacing size was determined by recording the etalon fringes of the empty cell in a Fourier Transform spectrometer. We kept the liquid cell under continuous nitrogen gas purging and temperature controlled conditions (20 ± 0.2°) in a closed sample compartment which was separated by polyethylene flaps from the rest of the evacuated spectrometer chamber. Each spectrum was recorded with 2 cm−1 resolution and averaged over 128 scans.
The resulting total absorption coefficient of an electrolyte solution is given by:
 | (1) |
We deduced an effective ionic absorption αeffion of the solvated ions according to
 | (2) |
 that is obtained by normalizing the effective ionic absorption to the molar salt concentration cs. For the ideal electrolyte solution εeffion is expected to be independent of solute concentration.
3 Experimental results
Using our FIR/THz Fourier transform spectrometer, we have measured the concentration dependent absorption of hydrochloric acid and hydrobromic acid in aqueous solution with bulk water as reference in the concentration range 0.04–2.5 M and 1.1–4.4 M, respectively. General trends are visible in Fig. 1 where we display averages of several measurements at the same concentration covering the concentration ranges 0.4–2.5 M for HCl and 1.1–4.4 M for HBr. The absorption of both acidic solutions is increased over the full frequency range (30–400 cm−1) compared to bulk water absorption. | ||
| Fig. 1 Concentration dependent THz/FIR absorption of aqueous HCl (left) and HBr (right) solutions. Each data point was obtained as the average of several measurements. The insets show the ionic extinction. In both panels a certain color represents identical concentrations. | ||
The deduced effective ionic extinctions (see insets in Fig. 1) have contributions of three absorption bands in the case of HCl and two for HBr. For HCl, the resonance around 180 cm−1 is attributed to a Cl− rattling mode which has been observed before in measurements of Cl− containing salts.46–49 Furthermore we observe resonances for both, HCl and HBr, at ≈130 cm−1 and 340 cm−1. We propose that these originate either from hydration water modes or an eigen mode of the solvated proton complex.
3.1 Spectrum dissection and discussion
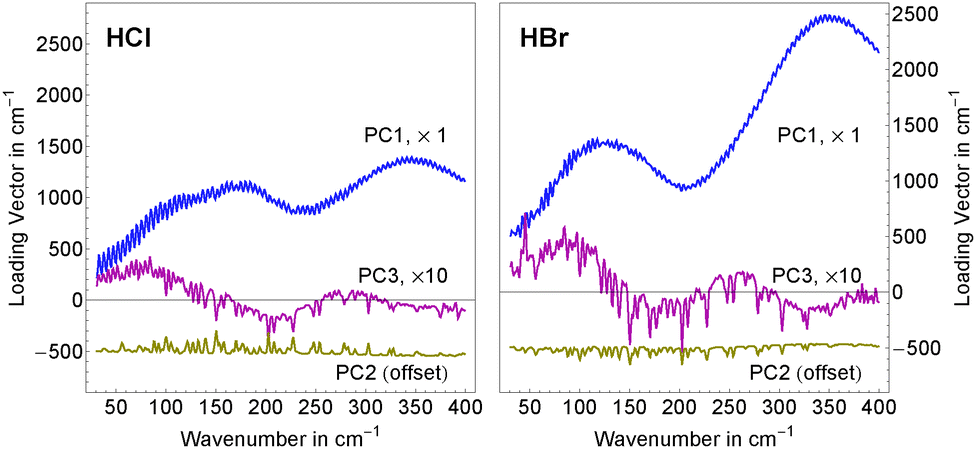 | ||
| Fig. 2 Results of the principal component analysis: shown are the main principal components for aqueous HCl (left) and HBr (right) solutions. The first (blue) and third (red) principal components describe the spectral features attributed to the solvated solutes and ion pair formation. The second principal component (yellow) summarizes residual water vapor absorption in the beam path. For better comparability, an offset of −500 cm−1 and a scaling factor of ten were applied to the second and third principal components, respectively. | ||
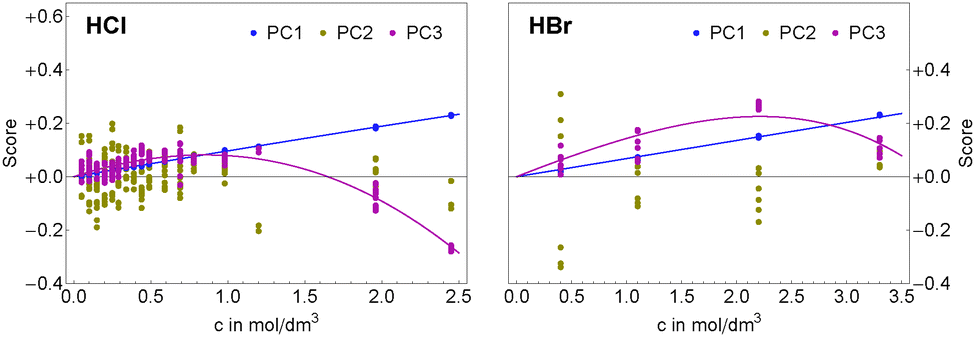 | ||
| Fig. 3 Concentration dependency of the scores of the first three principal components for aqueous HCl (left) and HBr (right) solutions. The first principal component (blue) shows mostly linear behavior, while the non-linearity of the third (red) principal components is indicative of ion pair formation. The second principal component (yellow) describes residual water vapor absorption in the beam path and is independent of the solute concentration. | ||
As shown in Sharma et al.49 the concentration dependency of the scores of the solute related principal components can be directly related to a simplified ion pair model where αeffion(![[small nu, Greek, tilde]](https://www.rsc.org/images/entities/i_char_e0e1.gif) ) is described as
) is described as
| αeffion() = csεeffsingle() + cpair(cs,Kpair)εeffdiff(). | (3) |
) = εcation + εanion − nhydrationεbulk describes the effective extinction of solvated anion and cation (including their hydration cage). The negative term in εeffsingle accounts for the effective number nhydration of hydration water molecules that show a spectrum different from bulk water.| εeffdiff() = εeffpair() − εeffsingle() | (4) |
 | (5) |
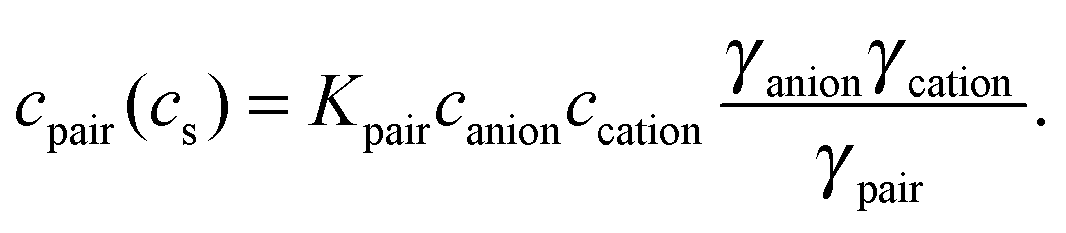 | (6) |
As described in detail in Sharma et al.49 we have simplified eqn (6) by assuming that the chemical structures of solvated ion-pair and solvated cation are similar yielding γpair ≈ γcation. The mean activity coefficients for HCl and HBr were taken from experimental data by Pitzer and Mayorga.52 In Fig. 3, we display the concentration dependence of the scores. The scores to principal components PC1 and PC3 of each acid were globally fitted to functions of the form
| si(cs) = csalini + cpair(cs,Kpair)anlini, i = {1, 3} | (7) |
Ion pair formation has a nonlinear salt concentration dependence (∝canionccation, see eqn (6)). In contrast, in the dilute limit, the contribution csεeffsingle to the effective ionic absorption scales linearly with cs (see eqn (3)). Therefore, the effective ion extinction εeffsingle can be directly related to the slopes of the score functions si(cs) evaluated at cs = 0:
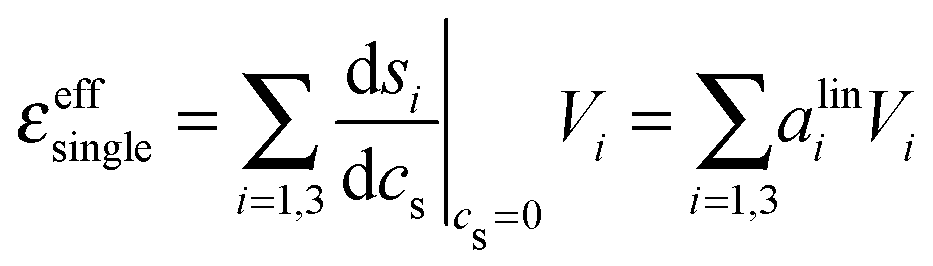 | (8) |
 the derivative of the score function belonging to principal component i with respect to the salt concentration. The right hand equality follows directly from a comparison of eqn (3) and (7). Following the same reasoning, εeffdiff is related to the nonlinear fit parameters in eqn (7):
 | (9) |
In Fig. 4, top panel, we display the resulting effective ionic extinction spectra of HCl and HBr as well as εeffsingle of NiCl2 for comparison. For both, HCl and HBr, two main resonances centered around 100 and 350 cm−1 are visible. In case of HCl an additional, weaker resonance is found at 180 cm−1 that is more prominent when plotting the difference HCl–HBr as displayed in the bottom panel. A similar spectral feature is found when plotting the difference Δεeffsingle for 1/2(NiCl2–NiBr2). This resonance is attributed to the rattling mode of Cl− as observed before.47,49 Center frequency and linewidth of the mode are the same within our experimental uncertainty. This indicates that both, hydration cage structure, i.e. force constant and reduced mass, which determine the center frequency, and the relaxation dynamics determining the linewidth of this rattling mode remain unchanged when replacing Ni2+ by the solvated proton as counter cation. In contrast, at low frequencies ( ≤ 120 cm−1) the bromide rattling resonance at 90 cm−1 is found to be decreased below the detection threshold for aqueous HBr solutions.
 | ||
| Fig. 4 Top: effective ionic extinctions εeffsingle for HCl (blue), HBr (red) and NiCl2 (thin black line). Bottom: difference Δεeffsingle between the ionic extinctions for (HCl, DCl) and (NiCl2, NiBr2). The difference for the Ni2+ halides has been scaled by 0.5 to account for the larger number of anions. The thick black lines show the result of a global fit for the H+ as well as the Ni2+ and Mn2+ halides and their differences. | ||
The most important fit results are summarized in Table 1. The best fit was obtained, when we kept the unperturbed center frequency of the low frequency water modes identical for salt and acidic solutions, but varied the linewidth. The center frequencies of the anion and cation resonances are well reproducible with an estimated uncertainty of ±1 cm−1. For HCl, the resonance assigned to a Cl− rattling mode is centered at 187 cm−1 and shows a linewidth of 226 cm−1. We note in passing, that the anionic amplitudes in Table 1 are values per mole of anion compared to Sharma et al.49 (per mole of salt) leading to a scaling factor of 0.5 for a direct comparison of the corresponding values.
d, corrected center frequency 0, amplitude a, and linewidth w for acidic HCl and HBr as well as MBr2 and MCl2 (M = Ni, Mn) solutions (see Fig. 4) obtained from a global fit including the Ni and Mn halide data published by us before.49 We have used damped harmonic oscillator line shapes for the ionic and water resonances and scaled bulk water relaxational (nLF) and librational (nHF) modes as models for the low frequency and high frequency components. In addition, a contribution nhydration was added accounting for the hydration water. The numbers in brackets correspond to 2σ statistical errors. Text labels indicate that the same fit parameter was used for a description of line parameters for different resonances
| Assignment | Parameter | HCl | HBr | NiCl2/MnCl2 | NiBr2/MnBr2 |
|---|---|---|---|---|---|
| Hydration water | n hydration | 5.1(3) | HCl | 15.2(3) | MCl2 |
| Water relaxational mode | n LF | 14.3(3) | HCl | 7.2(3) | 19.8(3) |
| Water low frequ. mode (wlfm) |
d in cm−1 |
110(2) | HCl | 120(1) | MCl2 |
|
0 in cm−1 |
141(2) | HCl | HCl | HCl | |
| a in cm−1 dm3 mol−1 | 1355(35) | HCl | HCl | HCl | |
| w in cm−1 | 561(8) | HCl | 471(8) | MCl2 | |
| τ in fs | 60(1) | HCl | 71(1) | MCl2 | |
| Water libration | n HF | 6.5(2) | 7.7(2) | 20.5(2) | 23.5/24.4(2) |
| H+(aq) |
d in cm−1 |
326(1) | HCl | — | — |
|
0 in cm−1 |
338(1) | HCl | — | — | |
| a in cm−1 dm3 mol−1 | 831(17) | 1000(20) | — | — | |
| w in cm−1 | wlfm(HCl) | wlfm(HCl) | — | — | |
| τ in fs | wlfm(HCl) | wlfm(HCl) | — | — | |
| X−(aq) anion rattling47 |
d in cm−1 |
183.1(2) | 86(1) | HCl | HBr |
|
0 in cm−1 |
186.6(2) | 93(1) | HCl | HBr | |
| a in cm−1 dm3 mol−1 | 603(4) | 0(fixed) | 637/602(4) | 93/47(4) | |
| w in cm−1 | 226(2) | HCl | HCl | HCl | |
| τ in fs | 160(3) | HCl | HCl | HCl | |
We assign the high frequency mode at 338 cm−1 to a blue-shifted hindered translational mode of a (possibly distorted) Eigen species H3O+ in the surrounding water network. This is in agreement with Fig. 5a shown by Lapid et al.29 where an oscillatory motion with an approximate time constant of 100 fs (≈330 cm−1) is found between the excess proton in a H3O+ moiety and its nearest neighbor oxygen prior and after a proton transfer event. Such a mode around 350 cm−1 is also prominent in the vibrational density of states published by Kim et al.,37 (Fig. 7) based on multistate empirical valence bond simulations. The blue shift can be explained by a stronger confinement of the Eigen species compared to bulk water. Indeed, a shortened O–H distance in protonated solutions compared to bulk water was found by neutron diffraction and simulation studies.17,32,36 To corroborate our assignment we performed concentration dependent measurements of DCl in D2O and applied the same data analysis as for HCl and HBr in H2O (see Fig. 5). In agreement with our prediction, the center frequency of the resonance at 338 cm−1 is found to be red-shifted by ≈15–20 cm−1 upon deuteration.
 | ||
| Fig. 5 Comparison of the effective ionic extinctions of HCl in H2O and DCl in D2O showing a redshift of the high frequency resonance around 340 cm−1 when replacing H by the heavier isotope. | ||
The low frequency mode centered at d ≈ 110 cm−1 resembles the resonance found in Ni(II) and Mn(II) halide solutions assigned to solvation water.49 Indeed, the best fit for a given number of fit parameters is obtained, when we assume a model, where the unperturbed center frequency ν0 of this water mode is identical for transition metal cations, halides and the solvated proton, however with an increased linewidth (560 cm−1 compared to 470 cm−1) for the acidic case. We take this as evidence for a locally enhanced mobility of the hydration network around a H3O+ moiety compared to bulk water. This higher mobility accounts also for disappearance of the Br− rattling mode in HBr around 90 cm−1: according to Sharma et al.,49 given a linewidth of 560 cm−1 any oscillation below νd ≈ 90 cm−1 is overdamped showing relaxational rather than oscillatory behavior.
The linewidths of modes assigned to different ions give information on the spatial extent of mobility enhancement: in the case of the solvated proton the linewidths of the low frequency hydration water mode and of the hydronium rattling mode are identical within our measurement uncertainty. This is in contrast to our previous results for Ni(II) and Mn(II) halides49 where both, the rattling motions of weakly solvated anions as well as the eigen modes of the supermolecular complex consisting of a strongly hydrated cation and its first solvation shell have a smaller linewidth than the low frequency water mode.
Since linewidths are intimately related to the spectral distribution of thermal bath states interacting with the embedded oscillator, we propose that the narrower lines observed for solvated Cl−, Br−, Ni2+, and Mn2+ resonances reflect the reduced rotational mobility of water in their first hydration shell.56 The larger widths observed for the low frequency water mode of these simple electrolytes provide evidence for a coupling to rotationally more flexible water, probably in the second solvation layer. We speculate that the identical linewidths found for the H3O+ rattling mode and the hydration water mode can be explained by rapid charge delocalization in the H9O4+ Eigen complex as already considered by Eigen himself1 and later predicted in theoretical investigations.5,53 Such a ‘special pair dance’ would blur the boundary between first and second solvation shell water.
) describes the correction required to account for the effective number of water molecules influenced by the solute, the dynamic hydration shell. Similarly, nLF, and nHF are scaling factors describing the solute effects on the low frequency relaxational part εLF() and the high frequency librational part εHF() of water, respectively.49 The water extinction spectrum εbulk() = εLF() + εtrans() + εHF() is the sum of its hindered translation band εtrans() centered at around 200 cm−1 and its relaxational low frequency (LF) and librational high frequency (HF) bands. Therefore, in our fit model nhydration mainly reflects the influence of the ions on the 200 cm−1 translational band which is dominated by localized nearest neighbor hindered translational motions.57 As for the Ni(II) and Mn(II) halides we are not able to separate a priori the anionic and cationic influences on the three fit parameters.
3.1.4.1 n hydration . From our fit results we obtain a dynamical solvation shell size nhydration ≈ 5 for HCl and HBr. This solvation shell size can be either due to the proton or due to the anion or a combination of both. Stoyanov et al.6,39 claim H13O6+ as unique structure for the solvated proton yielding a cationic solvation shell size of six water in agreement with our data. However, an assignment of nhydration solely to the proton leads to nhydration(X−) = 0 and nhydration(M2+) = 15 (M = Ni, Mn). This is surprisingly large, considering that nhydration describes the localized nearest neighbor hindered translation and that the replacement of a water molecule in the local network by a much heavier anion or cation should affect mainly the hindered translational modes within the solute's first solvation layer.
Therefore, we propose that the dynamic solvation shell size nhydration ≈ 5 found by us is dominated by the anion. This yields nhydration(X−) ≈ 5 and nhydration(H+) ≈ 0 (X = Cl, Br) which is in agreement with solvation shell sizes of n = 4–5 and n = 4–6 that have been determined for Cl− and for Br−, respectively, using neutron and X-ray scattering techniques (Ohtaki and Radnai58 and references therein) and with predictions in recent theoretical studies.30,31 Other computational studies predict even larger average anionic solvation shell sizes in the range n = 7–8.59–61 In addition, such an assignment yields dynamic solvation shell sizes of 5–6 for Ni2+ and Mn2+ (see Table 1) which is consistent with the octahedral coordination58 expected for these cations.
3.1.4.2 n HF . If we would attribute nHF(HX), X = Cl, Br, to the Eigen species, we obtain an asymmetric situation with nHF(X−) = 0 and nHF(M2+) = 20–25. This is not consistent with our previous results in transition metal halides,49 which showed that Br− influences the librational band more than Cl−. In contrast, if we choose nHF(H3O+) = 0 we obtain nHF(X−) = 7–8 for the anions and nHF(M2+) = 8–9 for the cations (M = Ni, Mn). In this picture, metal cations and halide anions disturb the librational motion of the first shell water molecules in a similar way, while the local perturbation of the hydrogen bond network around the solvated proton is small.
3.1.4.3 n LF . This mode is found to be strongly enhanced for HCl and HBr acidic solutions compared to the solvated transition metal halides where only a small increase of the low frequency extinction was found (see Fig. 5 in Sharma et al.49). We propose that this enhancement results from fast non-oscillatory proton motion within a Zundel type solvated proton structure yielding a broad background contribution to the measured extinction spectrum in the THz/FIR frequency range. Such fast movements with correlation times of a few (<10) femtoseconds have been predicted theoretically.5,29,53,62
The broadband increase in extinction is also in agreement with THz-TDS measurements performed by Tielrooij et al.43 in the frequency range up to 1.2 THz (40 cm−1) who found an increased imaginary part ε′′ of the dielectric response for HCl compared to e.g. NaCl. They attributed this experimental result exclusively to changes in the relaxation process S1 (τ ≈ 8 ps) of water molecules surrounding the ions thereby neglecting the influence of the higher frequency S2 (τ ≈ 0.25 ps)63 process. However, we want to point out that processes with short relaxation times become more prominent with increasing frequency.
There is a proportionality α ∝ ε′′ω/n between the dielectric absorption coefficient α and ε′′ with ω = 2πν as angular frequency and n as index of refraction of the solution. Here, ν is the excitation frequency of the source driving the oscillation. In case of a relaxational Debye mode with strength S and relaxation time τ we find:
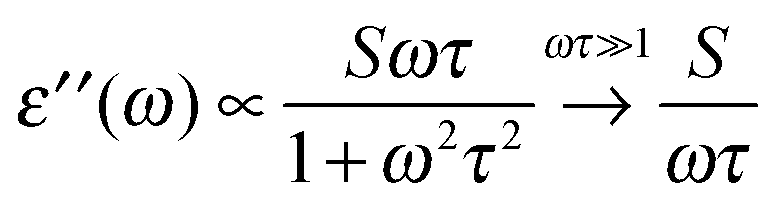 | (10) |
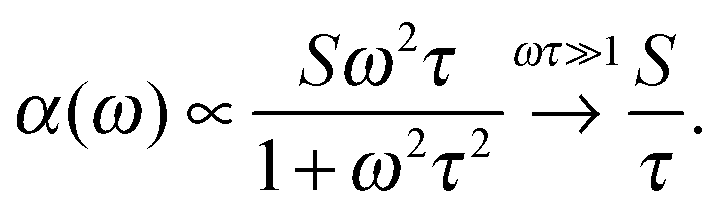
For water at room temperature S1 ≈ 80, τ1 ≈ 8 ps, S2 ≈ 6, and τ2 ≈ 0.25 ps. This implies that both processes contribute equally to the imaginary part of the dielectric spectrum at frequencies around ν = 1 THz (ω = 6.3 THz). Therefore, the S2 process must not be neglected.63 A description of spectral changes at THz frequencies in terms of process S1 only will therefore result in a misinterpretation of the data.
3.2 Ion pairing
We used eqn (4), (8), and (9) to calculate εeffpair(). Fig. 6 shows the ion pair spectra for HCl(aq) and HBr(aq) retrieved from our concentration dependent measurements and the corresponding linear extinction coefficients εeffsingle of the separated ions. To avoid confusion with un-dissociated HCl, we will use (H+–X−), X = Cl, Br, to denote an ion pair in solution. For HCl we observe a reduction in the broad background over the full spectral range and a blue-shift of the Cl− rattling peak to a center frequency of ≈200 cm−1. This is especially prominent in the difference spectrum εeffpair(H+–Cl−) − εeffpair(H+–Br−) as displayed in the inset of Fig. 6. For HBr, part of the broad background is still visible at frequencies below 50 cm−1. The resonance at 330 cm−1 does not change in intensity but decreases in linewidth upon ion pair formation.
 | ||
| Fig. 6 Comparison of single ion and ion pair extinction spectra for HCl (top) and HBr (bottom). The inset in the top panel shows the extinction differences HCl–HBr for single ions (in blue) and ion pairs (in red). | ||
We obtain a more quantitative insight from a global fit including the effective ion pair extinctions for HCl and HBr as well as the ion pair difference spectrum. The resulting fit parameters are given in Table 2. In our fit, we assume that the unperturbed center fequencies of the water mode at 140 cm−1 and of the solvated proton mode at 336 cm−1 are ion pair independent. However, we cannot exclude a different coupling to thermal bath states available in the solution, which yields differences in observed linewidths and apparent center frequencies d. In the difference spectrum εeffpair(H+–Cl−) − εeffpair(H+–Br−) (see inset in Fig. 6) we find no indication of a Br−rattling signature. Compared to εeffsingle of the single ions, the ion pairs show a reduced influence on the hydration water. Our model is consistent with the assumption of vanishing nhydration for (H+–Cl−) and (H+–Br−) ion pairs: an attempt to include nhydration for the two ion pairs in the fit yielded a value of zero within our measurement uncertainties. Thus, in order to minimize the number of fit parameters, we set nhydration = 0 in the final fit.
d, corrected center frequency 0, amplitude a, and linewidth w for ion pairs of solvated H+ and X− (X = Cl, Br). obtained from a global fit of both ion pair extinctions and their anionic difference spectrum. We have used the same notification as in Table 1
| Assignment | Parameter | H+–Cl−(aq) | H+–Br−(aq) |
|---|---|---|---|
| Hydration water | n hydration | 0(fixed) | 0(fixed) |
| Water relaxational mode | n LF | 0(fixed) | 5.3(2) |
| Water low frequ. mode (wlfm) |
d in cm−1 |
134(1) | HCl |
|
0 in cm−1 |
143(1) | HCl | |
| a in cm−1 dm3 mol−1 | 758(14) | 806(11) | |
| w in cm−1 | 311(6) | HCl | |
| τ in fs | 106(2) | HCl | |
| Water libration | n HF | 2.8(1) | HCl |
| H+(aq) |
d in cm−1 |
331(1) | 328(1) |
|
0 in cm−1 |
336(2) | HCl | |
| a in cm−1 dm3 mol−1 | 593(22) | 1307(21) | |
| w in cm−1 | wlfm(H+–Cl−) | 384(6) | |
| τ in fs | wlfm(H+–Cl−) | 86 | |
| X−(aq) anion rattling |
d in cm−1 |
200.4(7) | — |
|
0 in cm−1 |
204.3(7) | — | |
| a in cm−1 dm3 mol−1 | 704(11) | — | |
| w in cm−1 | 241(8) | — | |
| τ in fs | 140(5) | — | |
The influence of the ion pairs on the librational band (as characterized by nHF) is strongly reduced for (H+–Cl−) and (H+–Br−) compared to the single ion spectra. Concerning the broad band low frequency relaxational component described by nLF, there is a distinct difference between HCl and HBr: nLF vanishes for (H+–Cl−). For (H+–Br−) the broadband continuum is still observed but reduced by a factor of two compared to the free ions. The linewidth of the resonance attributed to Cl− in the solvated ion pair complex is only slightly increased upon ion pair formation. In contrast, the linewidths of the water and H3O+ resonances obtained from the ion pair extinction spectra are significantly smaller than those obtained for the single ions (see Tables 1 and 2). We propose that this is an indication for the reduced average mobility in the librational motion of the solvent molecules in the high concentration limit compared to dilute solutions.32
The deduced ion pair data are consistent with a model, where the band centers of the solvated H3O+ mode at 336 cm−1 and the low frequency water mode at 143 cm−1 are unaltered upon ion pair formation. This favors the idea that solvent shared ion pairs are formed instead of contact ion pairs. Our interpretation is supported by the observation that in case of (H+–Cl−) the Cl− resonance shifts from 187 to 204 cm−1 which is considerably smaller than the shift from 187 to 240 cm−1 in case of (Ni2+–Cl−) and (Mn2+–Cl−) both of which form contact ion pairs.49
In addition, recent theoretical work32,64 predicts solvent shared (separated by one solvation layer) and solvent separated (two layers) ion pairs for the concentration range (0.05–3.2 M) covered in this work. DFT simulations by Heuft and Meijer31 for the concentration range 2.7–5.3 M show a change from (Cl−–Cl−) and (H3O+–Cl−) ‘pairs’ bridged by two and more water at low concentrations to pairs bridged by a single water molecule for the higher concentration. Upon solvent separated ion pair formation in both cases (anion–anion, anion–cation) the Cl−–HH2O distance is found to be reduced from 2.3 to about 2.15 Å. An increased confinement is in agreement with the observation of a blue-shift of the Cl− band for the ion pair.
4 Summary and conclusion
Using principal component analysis of concentration dependent THz/FTIR measurements of HCl, HBr, and DCl, we were able to extract single ion and ion pair extinction spectra. We find distinct resonances in the frequency range 30–400 cm−1. The band centers of these resonances provide information on the local structure of the hydration environment while the linewidths allow a glimpse on the fs-dynamics of the hydrogen bond network.The acidic single ion extinction spectra were compared to our previous results on solvated transition metals.49 We find that the local solvation environment for Cl− is only slightly changed when we replace transition metal cations by the solvated proton as counter cation (see Table 1, Fig. 4 and Table 1 in Sharma et al.49). In contrast, for the acidic solution we were unable to observe the weak Br− resonance within our experimental uncertainty. This is attributed to the faster H-bond relaxation dynamics (τ ≈ 60 fs) in acidic solutions compared to those of salty electrolytes (τ ≈ 70–120 fs).
The addition of HCl and HBr has only minor effects on the water translational and librational modes as can be seen by the small numbers for nhydration and nlib in Table 1. We speculate that for both acids nhydration and nlib are dominated by contributions from anionic hydration shells. Based on this assumption we obtain solvation shell sizes of 5–7 for Cl−, Br−, Ni2+, and Mn2+ which are in good agreement with previous experimental and theoretical data.31,59
The dissection of the concentration dependent measurements yields three components describing the effect of the solvated proton: a high frequency cationic band at 340 cm−1, a low frequency hydration water band centered at 140 cm−1, and a broad background. The band at 340 cm−1 is assigned to a rattling mode of the solvated Eigen complex. This is in qualitative agreement with theoretical predictions.29,37 The assignment was confirmed by observation of a small redshift upon deuteration and is in agreement with a recent photoelectron study by Winter et al.18 and a combined NMR and ab initio study by23 who found H3O+ as most likely structure in aqueous HCl mixtures.
The water resonance at 140 cm−1 shows a linewidth that is identical to that of the cationic mode at 340 cm−1. This is in contrast to hydrated Ni2+ and Mn2+ cations where the water mode shows significantly larger linewidth compared to the cationic resonances. We propose that this is an indication of rapid charge delocalization in an H9O4+ Eigen complex (‘special pair dance’28,53) that makes a distinction between first and second solvation shell difficult.
The broad background is taken as evidence for fast non-oscillatory proton-dynamics in a Zundel-type solvation structure as expected in proton transport via an Eigen–Zundel–Eigen (EZE) mechanism.53,65 A comparison of the single ion and ion pair spectra (see Fig. 6) shows that this background is strongly reduced with increasing electrolyte concentration. Since, in contrast to ion mobility measurements, THz/FIR spectroscopy probes sub-ps processes this reduction is in line with a lower number of (fast) proton hops per ps compared to bulk water as predicted by DFT simulations.31 The combination of a quenched Zundel background and a persistent Eigen resonance on ion pairing puts severe limitations on simulations and experiments that predict an increase of the probability to find a Zundel structure with increasing proton concentration (see Fig. 7). This result is at variance with infrared data that claim dominant Zundel structures26 or a well defined hexa-coordinated proton–water complex with a Zundel core.6,39
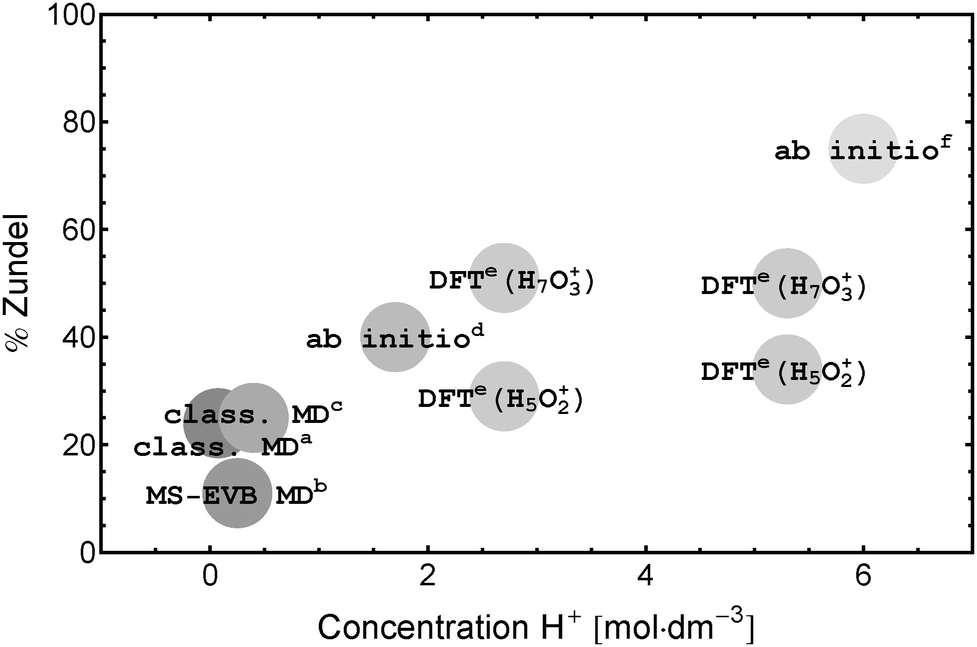 | ||
Fig. 7 Percentage of protons in the Zundel structure as predicted from theory: a![[thin space (1/6-em)]](https://www.rsc.org/images/entities/char_2009.gif) Wolf et al.,28bMarkovitch et al.,41cLapid et al.,29dTuckerman et al.,14eHeuft and Meijer,31fBotti et al.17 Wolf et al.,28bMarkovitch et al.,41cLapid et al.,29dTuckerman et al.,14eHeuft and Meijer,31fBotti et al.17 | ||
Upon ion pairing, we observe a blueshift of the Cl− resonance by about 20 cm−1. Based on a comparison to the more strongly shifted peaks observed in transition metal contact ion pairs (≈40 cm−1) we take this as evidence for solvent shared ion pairs in the concentration range up to 3.2 M investigated by us. This is in agreement with theoretical predictions.31,32 For the solvated proton Hpair+ and its interaction with hydration water, our data are consistent with a model where the unperturbed center frequencies 0 (see Tables 1 and 2) of the damped harmonic oscillator resonances remain unchanged while the linewidths decrease. We conclude that the local structure is still intact while the distribution of the thermal bath states is assumed to be affectd leading to increased relaxation times τ.
Our measurements demonstrate that by a rigorous analysis of low frequency intermolecular modes THz/FTIR spectroscopy is able to shed light onto strongly debated solvation processes. In the case of the solvated proton we find experimental evidence that both, Eigen and Zundel species are present in acidic solutions: the solvated Eigen structure shows a prominent cationic peak with a decay time of 60 fs while the highly dynamic Zundel structure with correlation times below 10 fs is present as broad background.
Acknowledgements
We acknowledge H. Weingärtner for helpful discussions and Gudrun Niehues and Stefan Funkner for accurate measurements of the low frequency spectrum of D2O. This work is supported by the Cluster of Excellence RESOLV (EXC1069) funded by the Deutsche Forschungsgemeinschaft.References
- M. Eigen, Angew. Chem., Int. Ed. Engl., 1964, 3, 1–19 CrossRef.
- D. Marx, ChemPhysChem, 2006, 7, 1848–1870 CrossRef CAS PubMed.
- B. Kirchner, ChemPhysChem, 2007, 8, 41–43 CrossRef CAS PubMed.
- D. Marx, A. Chandra and M. E. Tuckerman, Chem. Rev., 2010, 110, 2174–2216 CrossRef CAS PubMed.
- C. Knight and G. A. Voth, Acc. Chem. Res., 2012, 45, 101–109 CrossRef CAS PubMed.
- C. A. Reed, Acc. Chem. Res., 2013, 46, 2567–2575 CrossRef CAS PubMed.
- A. A. Hassanali, J. Cuny, V. Verdolino and M. Parrinello, Philos. Trans. R. Soc., A, 2014, 372, 20120482 CrossRef PubMed.
- C. J. T. Grotthus, Ann. Chim. (Cachan, Fr.), 1806, 58, 54–73 Search PubMed.
- E. G. Weidemann, Z. Phys., 1967, 198, 288–303 CrossRef CAS.
- G. Zundel and H. Metzger, Z. Phys. Chem., 1968, 58, 225–245 CrossRef CAS.
- J. D. Bernal and R. H. Fowler, J. Chem. Phys., 1933, 1, 515 CrossRef CAS.
- R. P. Bell, Proc. R. Soc. London, 1936, 154, 414–429 CrossRef.
- A. J. Huneycutt and R. J. Saykally, Science, 2003, 299, 1329–1330 CrossRef CAS PubMed.
- M. Tuckerman, K. Laasonen, M. Sprik and M. Parrinello, J. Phys. Chem., 1995, 99, 5749–5752 CrossRef CAS.
- D. Marx, M. E. Tuckerman, J. Hutter and M. Parrinello, Nature, 1999, 397, 601–604 CrossRef CAS.
- D. Asthagiri, L. R. Pratt and J. D. Kress, Proc. Natl. Acad. Sci. U. S. A., 2005, 102, 6704–6708 CrossRef CAS PubMed.
- A. Botti, F. Bruni, M. A. Ricci and A. K. Soper, J. Chem. Phys., 2006, 125, 014508 CrossRef CAS PubMed.
- B. Winter, M. Faubel, I. V. Hertel, C. Pettenkofer, S. E. Bradforth, B. Jagoda-Cwiklik, L. Cwiklik and P. Jungwirth, J. Am. Chem. Soc., 2006, 128, 3864–3865 CrossRef CAS PubMed.
- A. Hassanali, F. Giberti, J. Cuny, T. D. Kühne and M. Parrinello, Proc. Natl. Acad. Sci. U. S. A., 2013, 110, 13723–13728 CrossRef CAS PubMed.
- J. M. Headrick, E. G. Diken, R. S. Walters, N. I. Hammer, R. A. Christie, J. Cui, E. M. Myshakin, M. A. Duncan, M. A. Johnson and K. D. Jordan, Science, 2005, 308, 1765–1769 CrossRef CAS PubMed.
- J. A. Fournier, C. J. Johnson, C. T. Wolke, G. H. Weddle, A. B. Wolk and M. A. Johnson, Science, 2014, 344, 1009–1012 CrossRef CAS PubMed.
- R. Triolo and A. H. Narten, J. Chem. Phys., 1975, 63, 3624 CrossRef CAS.
- T. Murakhtina, J. Heuft, E. J. Meijer and D. Sebastiani, ChemPhysChem, 2006, 7, 2578–2584 CrossRef CAS PubMed.
- S. Woutersen and H. J. Bakker, Phys. Rev. Lett., 2006, 96, 138305 CrossRef PubMed.
- M. Śmiechowski and J. Stangret, J. Chem. Phys., 2006, 125, 204508 CrossRef PubMed.
- M. Śmiechowski and J. Stangret, J. Mol. Struct., 2008, 878, 104–115 CrossRef.
- W. Kulig and N. Agmon, Nat. Chem., 2013, 5, 29–35 CrossRef CAS PubMed.
- M. G. Wolf and G. Groenhof, J. Comput. Chem., 2014, 35, 657–671 CrossRef CAS PubMed.
- H. Lapid, N. Agmon, M. K. Petersen and G. A. Voth, J. Chem. Phys., 2005, 122, 14506 CrossRef PubMed.
- K. E. Laasonen and M. L. Klein, J. Phys. Chem. A, 1997, 101, 98–102 CrossRef CAS.
- J. M. Heuft and E. J. Meijer, Phys. Chem. Chem. Phys., 2006, 8, 3116–3123 RSC.
- J. Xu, S. Izvekov and G. A. Voth, J. Phys. Chem. B, 2010, 114, 9555–9562 CrossRef CAS PubMed.
- M. Miyazaki, A. Fujii, T. Ebata and N. Mikami, Science, 2004, 304, 1134–1137 CrossRef CAS PubMed.
- J.-W. Shin, N. Hammer, E. Diken, M. Johnson, R. Walters, T. Jaeger, M. Duncan, R. Christie and K. Jordan, Science, 2004, 304, 1137–1140 CrossRef CAS PubMed.
- S. Olesen, T. Guasco, J. Roscioli and M. Johnson, Chem. Phys. Lett., 2011, 509, 89–95 CrossRef CAS.
- A. Botti, F. Bruni, S. Imberti, M. A. Ricci and A. K. Soper, J. Chem. Phys., 2004, 120, 10154–10162 CrossRef CAS PubMed.
- J. Kim, U. W. Schmitt, J. A. Gruetzmacher, G. A. Voth and N. E. Scherer, J. Chem. Phys., 2002, 116, 737 CrossRef CAS.
- J. L. Fulton and M. Balasubramanian, J. Am. Chem. Soc., 2010, 132, 12597–12604 CrossRef CAS PubMed.
- E. S. Stoyanov, I. V. Stoyanova and C. A. Reed, Chem. Sci., 2011, 2, 462–472 RSC.
- C. Chen, C. Huang, I. Waluyo, D. Nordlund, T.-C. Weng, D. Sokaras, T. Weiss, U. Bergmann, L. G. Pettersson and A. Nilsson, J. Chem. Phys., 2013, 138, 154506 CrossRef PubMed.
- O. Markovitch and N. Agmon, J. Phys. Chem. A, 2007, 111, 2253–2256 CrossRef CAS PubMed.
- W. Amir, G. Gallot, F. Hache, S. Bratos, J.-C. Leicknam and R. Vuilleumier, J. Chem. Phys., 2007, 126, 034511 CrossRef PubMed.
- K. J. Tielrooij, R. L. A. Timmer, H. J. Bakker and M. Bonn, Phys. Rev. Lett., 2009, 102, 198303 CrossRef CAS PubMed.
- S. Ebbinghaus, S. J. Kim, M. Heyden, X. Yu, U. Heugen, M. Gruebele, D. M. Leitner and M. Havenith, Proc. Natl. Acad. Sci. U. S. A., 2007, 104, 20749–20752 CrossRef CAS PubMed.
- J. Sun, G. Niehues, H. Forbert, D. Decka, G. Schwaab, D. Marx and M. Havenith, J. Am. Chem. Soc., 2014, 136, 5031–5038 CrossRef CAS PubMed.
- D. A. Schmidt, S. Funkner, B. P. Born, R. Gnanasekaran, G. W. Schwaab, D. M. Leitner and M. Havenith, J. Am. Chem. Soc., 2009, 131, 18512–18517 CrossRef CAS PubMed.
- S. Funkner, G. Niehues, D. A. Schmidt, M. Heyden, G. Schwaab, K. M. Callahan, D. J. Tobias and M. Havenith, J. Am. Chem. Soc., 2012, 134, 1030–1035 CrossRef CAS PubMed.
- V. Sharma, F. Böhm, M. Seitz, G. Schwaab and M. Havenith, Phys. Chem. Chem. Phys., 2013, 15, 8383–8391 RSC.
- V. Sharma, F. Böhm, G. Schwaab and M. Havenith, Phys. Chem. Chem. Phys., 2014, 16, 25101–25110 RSC.
- O. Redlich and J. Bigeleisen, J. Am. Chem. Soc., 1941, 64, 1941–1943 Search PubMed.
- F. J. Millero, Water and Aqueous Solutions, Wiley, New York, 1972 Search PubMed.
- K. S. Pitzer and G. Mayorga, J. Phys. Chem., 1973, 77, 2300–2308 CrossRef CAS.
- O. Markovitch, H. Chen, S. Izvekov, F. Paesani, G. A. Voth and N. Agmon, J. Phys. Chem. B, 2008, 112, 9456–9466 CrossRef CAS PubMed.
- A. Chandra, M. E. Tuckerman and D. Marx, Phys. Rev. Lett., 2007, 99, 145901 CrossRef PubMed.
- M. E. Tuckerman, A. Chandra and D. Marx, J. Chem. Phys., 2010, 133, 124108 CrossRef PubMed.
- M. D. Fayer, Acc. Chem. Res., 2012, 45, 3–14 CrossRef CAS PubMed.
- M. Heyden, J. Sun, S. Funkner, G. Mathias, H. Forbert, M. Havenith and D. Marx, Proc. Natl. Acad. Sci. U. S. A., 2010, 107, 12068–12073 CrossRef CAS PubMed.
- H. Ohtaki and T. Radnai, Chem. Rev., 1993, 93, 1157–1204 CrossRef CAS.
- Y. Marcus, Chem. Rev., 2009, 109, 1346–1370 CrossRef CAS PubMed.
- M. Trumm, Y. O. G. Martńez, F. Réal, M. Masella, V. Vallet and B. Schimmelpfennig, J. Chem. Phys., 2012, 136, 044509 CrossRef PubMed.
- V. Migliorati, F. Sessa, G. Aquilanti and P. D'Angelo, J. Chem. Phys., 2014, 141, 044509 CrossRef PubMed.
- T. C. Berkelbach, H.-S. Lee and M. E. Tuckerman, Phys. Rev. Lett., 2009, 103, 238302 CrossRef PubMed.
- C. Rønne, P.-O. Åstrand and S. R. Keiding, Phys. Rev. Lett., 1999, 82, 2888 CrossRef.
- F. Wang, S. Izvekov and G. A. Voth, J. Am. Chem. Soc., 2008, 130, 3120–3126 CrossRef CAS PubMed.
- N. Agmon, Chem. Phys. Lett., 1995, 244, 456–462 CrossRef CAS.
| This journal is © the Owner Societies 2015 |