
 Open Access Article
 This Open Access Article is licensed under a
 Creative Commons Attribution 3.0 Unported Licence
The adsorption of thiophenol on gold – a spectroelectrochemical study
Rudolf
Holze
Technische Universität Chemnitz, Institut für Chemie, AG Elektrochemie, 09107 Chemnitz, Germany. E-mail: rudolf.holze@chemie.tu-chemnitz.de
First published on 5th March 2015
Abstract
The adsorbate formed by adsorption of thiophenol on a polycrystalline gold electrode and brought into contact with aqueous solutions of 1 M HClO4 and 0.1 M KClO4 has been studied using cyclic voltammetry and surface-enhanced Raman spectroscopy. A strong adsorption is deduced from observations made using cyclic voltammetry. From the SER spectra, interactions of thiophenol with the gold surface via a gold–sulfur bond with the aromatic ring pointing away from the surface is concluded for both electrolyte solutions.
Introduction
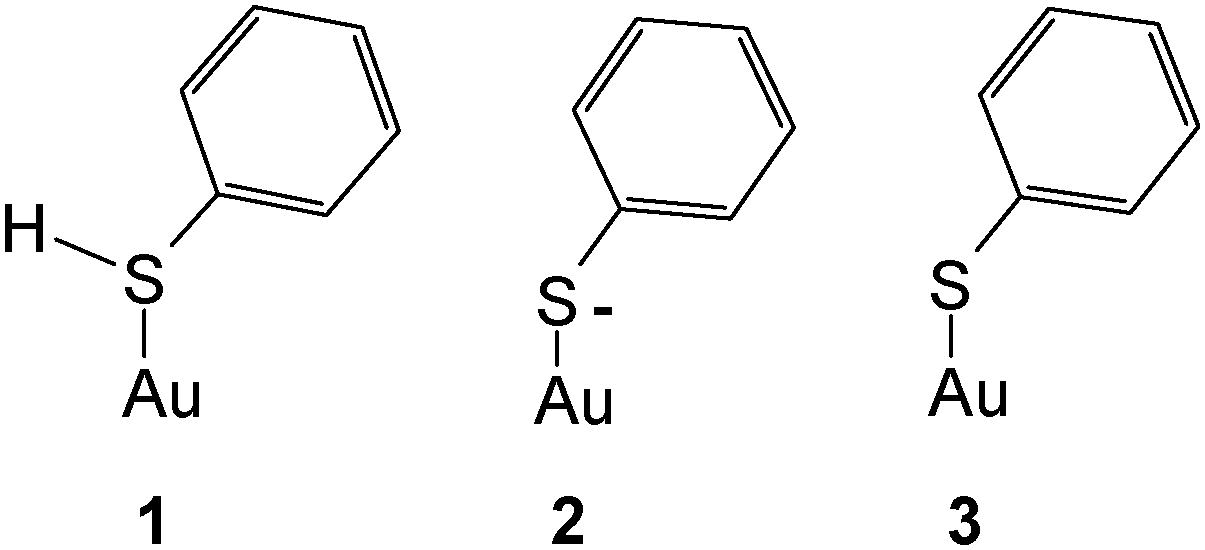
Substantial interest has been devoted to studies of self-assembled monolayers (SAMs) formed in particular of sulfur-containing (i.e. mostly –SH– and less frequently –SR–substituted) organic molecules on gold surfaces.1–3 Unfortunately the term SAM has gained a huge popularity although sometimes not matching the actual properties of the layers, in particular their degree of “organization”, i.e. periodicity. As reported elsewhere4 the initially formed adsorbates are not necessarily well-organized and may reorganize on the surface into some better organized forms,5 but the highly organized arrangements frequently shown are not always obtained. Because SAMs on gold electrodes hold particular potential regarding the modification of the surface properties, patterning etc. published reports on electrochemical, spectroelectrochemical and surface-analytical studies are numerous. Somewhat surprisingly the most simple molecule thiophenol† TP has barely attracted attention beyond particular applications briefly reviewed below. Its adsorption on a mercury electrode has been studied,6 the Gibbs energy of adsorption ΔGad = −25.55 kJ mol−1 implies physisorption only. The respective value observed with a platinum electrode ΔGad = −41.0 kJ mol−1 (ref. 7) suggests a moderately stronger interaction in the range of chemisorption. No respective values for gold have been reported presumably because of the very strong gold–sulfur interaction making most methods employed in adsorption studies and based on adsorption/desorption equilibria unsuitable;8 the same applies apparently to silver. Data obtained for the adsorption of a number of other thio-compounds, in particular aliphatic ones, in the range ΔGad = −80–100 kJ mol−1 again imply very strong chemisorption.8 Various estimates and theoretical calculations reviewed by Ulman have resulted in a value of 167.15 kJ mol−1 for the Au–S-bond.9 In order to close the gap in structural information – the thermodynamic one will hardly be closed at all with electrochemical methods – and to extend the initial data reported in an exploratory study by Szafranski et al.10 we have studied the adsorption of thiophenol on a polycrystalline gold electrode using cyclic voltammetry (CV) and surface-enhanced Raman spectroscopy (SERS).11Carron and Hurley have used SERS and TP adsorbed on copper, silver and gold surfaces to determine the azimuthal angle at the sulfur atom.12 A study of TP adsorbed on gold nanoparticles has been reported by Li et al.13 wherein theoretical data pertaining to the various states of the adsorbate have been obtained using DFT and compared with experimental data. The forms of species considered in theory were as follows.
Gold was implemented as a single atom instead of a cluster or an even larger aggregate resembling a solid. Adsorption as a thiophenylate (or simply thiolate) (3) was deduced from a comparison of calculated and experimentally observed band positions. A band observed at 275 cm−1 was assigned to the Au–S stretching mode. The calculated value of 334 cm−1 deviates strongly, presumably indicating the limited viability of representing a metal surface (even that of a nanoparticle) by a single metal atom. It should be noted that generally adsorption of thiols is assumed to proceed via release of a hydrogen atom according to
| R–S–H + Aux → RS(−)Au(+)Aux−1 + 1/2H2 |
Accordingly the distinction between 2 and 3 in the preceding scheme is applicable only for a discrete species as assumed for the DFT calculations, a negatively charged adsorbate RS(−) with a metal surface being expected only at sufficiently negative electrode potentials. Both theoretical and experimental evidence supporting this assumption and the distinction between RS and RS(−) appears to be missing so far.
Further studies of adsorbed TP are available. In a study aiming at the separation of electromagnetic and chemical enhancement, Saikin et al.14 assigned a band at 415 cm−1 as being admixed with the Au–S stretching mode. Wu et al.15 prepared differently shaped gold particles subsequently studied with SER supplemented with DFT-calculations wherein the gold surface was mimicked by 9–16 atoms. Some of the displayed spectra (without band assignment) showed a band around 250 cm−1 possibly associated with a gold–sulfur mode. Form 3 was deduced from DFT-calculations, also assuming the interaction of a single gold atom with TP by Xu et al.16 Surprisingly no band could be attributed to the νAu–S mode. Nara et al.17 used an assembly of gold atoms arranged according to the Au(111) surface. The molecule was calculated with a tilting angle of 61° with respect to the surface normal.
In most studies involving the use of TP the molecule is used as a marker or reporter molecule or simply as a probe to determine the suitability of a substrate for surface enhancement or to estimate an enhancement factor (for examples, see ref. 18–23, for recent overviews see ref. 24, on theory see ref. 25 and 26). Joo adsorbed TP and benzyl mercaptan on gold nanoparticles.27 Adsorption of the latter compound proceeded faster; at high bulk concentration of the adsorbate the obtained SER spectra were almost identical. At lower bulk concentration differences were observed, but neither a low-wavenumber band indicative of Au–S-interaction was observed nor band assignment and interpretation in terms of the adsorbate geometry were attempted. The suitability of gold colloids for SERS was examined by Xu et al.28 using TP as a test molecule. TP induced the aggregation of the nanoparticles. Aggregation of gold nanoframes usually assumed to give enhanced scattering caused by the enhanced plasmonic field between the particles was found to actually reduce the enhancement of SERS by TP by Mahmoud and El-Sayed.29 The observations could be described and explained using a discrete dipole approximation. The observed and assigned bands showed different increases of enhancement as a function of the number of involved nanoframes and interparticle separation. The type of TP–gold interaction was not discussed. Gold nanoparticles arranged as dimers with hot spots at their point of contact were prepared and tested by Alexander et al.30 using TP as a test case. Only spectra in the fingerprint region were reported without band assignment, and a pronounced relationship between the plane of polarization of the illuminating light and the dimer axis was found. TP was employed as a test molecule to determine enhancement factors by Taylor et al.31 and to determine the actual surface areas by Buividas et al.32
Ren et al.33 applied tip-enhanced Raman spectroscopy to TP adsorbed on Au(110). The spectra were hardly different from those of plain TP. No metal–sulfur mode was found, no molecular orientation was deduced. For further studies surface selection rules not specified were invoked. Employing the vibrational Stark effect Marr and Schultz have imaged electric fields in both SERS and TERS using TP as a probe.34 Fan et al.35 used TP as a test molecule for estimation of the damping effect of a SiO2-shell on a gold nanoparticle. The electromagnetic enhancement was found to decrease with growing shell thickness. Wang et al.36 reported on Au–Ag-alloy nanoparticles with different compositions. TP was used as a probe molecule in subsequent studies using SERS. SER intensities increased with growing gold content at a laser wavelength of λ0 = 1064 nm. Taking into account particle size and particle aggregation the higher gold content was related to the effect of surface plasmon resonance enhancement. SERS-active gold–silver nanofibers were prepared by electrospinning.37 The actually observed enhancement for TP (among other molecules) depended on the gold content. Ling et al.38 prepared silver nanowires coated with gold. The spectra reported for the fingerprint region suggest the suitability of the nanowires for SERS; no band assignments or vibrational band of a gold–sulfur mode were provided. Gold-coated silver particles prepared for an immunoassay were prepared by Cui et al.39 A pronounced dependency of the SERS-intensity on the metallic composition was found, and the intensity was generally stronger by a factor of ten when compared with silver nanoparticles. Monodisperse gold octahedra were prepared by Chang et al.40 The surface plasmon resonance was found to increase with the particle size. Using TP as a test molecule, the suitability of the substrate for SERS was examined. The maximum enhancement was found at a particle size of 90 nm, and no signal at all was found at ∼120 nm. Substrate effects of gold nanospheres and nanocubes have been reported by Mahmoud41 and Mahmoud and El-Sayed42 without information regarding the adsorbate structure. Bhuvana et al.43 prepared carbon-assisted electroless gold as SERS substrate and observed an enhancement factor of 106–107 for TP adsorbed on this substrate. Slightly smaller enhancement factors were observed by Kim et al.44 for patterned gold nanoparticle films with adsorbed TP. Li et al.45 and Ge et al.46 used TP as a reporter molecule on gold colloids subsequently employed in an immunoassay.
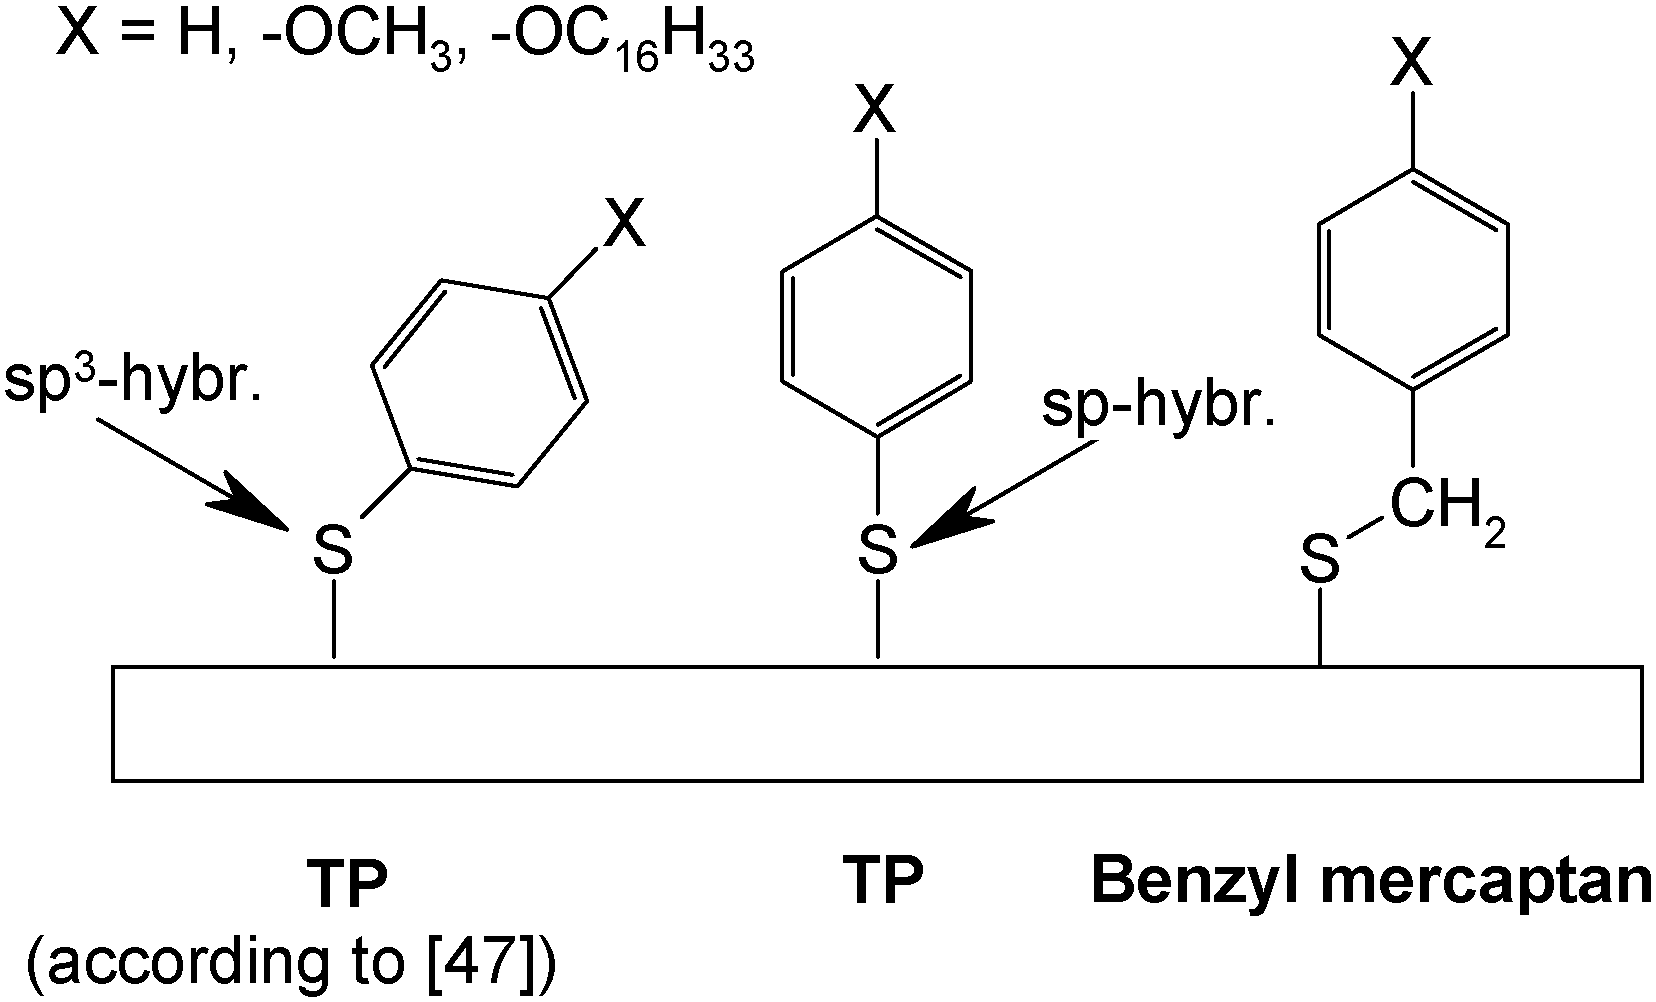
Tao et al.47 have studied adsorbates of TP, benzyl mercaptan, biphenylthiol and 4-biphenylmethanethiol without and with alkoxy-substituents in the para-position on gold electrodes obtained by evaporation of gold on mica (see Scheme 2). The results of cyclic voltammetry, ellipsometry, scanning tunneling microscopy and infrared spectroscopy imply that for all benzyl mercaptans and 4-biphenylmethanethiols closely packed and ordered monolayers are formed. TP and biphenylthiols yield lower surface coverages. With longer p-alkoxy-chains increasing intermolecular interaction and closer packing are found. These subtle differences in behavior were attributed to the bond angle situation at the thiolate head group being in an interplay with intermolecular interactions. Theoretical calculations assuming both sp3- and sp-hybridization with respective adsorbate geometries have been reported;48,49 unfortunately experimental evidence (in particular vibrational spectra) supporting the suggested sp-hybridization is lacking so far.
 | ||
| Scheme 1 | ||
 | ||
| Scheme 2 | ||
Formation of poorly defined SAMs from TP was also deduced from contact angle measurements and ellipsometry by Sabatani et al.50
Several publications dealing with substituted TP (namely 4-nitrothiophenol, 4-amino-thiophenol51etc.) are available, mostly these molecules serve just as probes like TP, metal–sulfur vibrations are not mentioned. Dithiols, i.e. molecules with two –SH-units, show particularly poor organization.4
Somewhat surprisingly for TP and substituted TPs adsorbed on silver a corresponding silver–sulfur vibration was repeatedly not observed.52–55 Nevertheless, molecular adsorbate orientations ranging from flat54 to perpendicular55 were suggested based on the dominance of an in-plane mode indicative of perpendicular orientation.55–57 Only Joo et al.58 have observed a band as a shoulder at 237 cm−1 assigned to the νAg–S; however, the authors concluded somewhat reluctantly a face-on adsorption on the surface of the silver sol particles.
Given this large body of both experimental and theoretical evidence the present study attempts to close an apparent gap: the lack of a structural model of TP adsorbed on a polycrystalline gold surface in contact with an electrolyte solution. Based on results of electrochemical experiments (cyclic voltammetry CV) and SERS the mode of adsorbate–surface interaction, the orientation of the adsorbed molecule with respect to the surface and its chemical state taking into account solution pH should be deduced.
Experimental
CVs were recorded using gold sheet working electrodes using aqueous solutions of 1 M HClO4 (Acros, p.A.) and 0.1 M KClO4 (Merck, p.A., pH = 4.90, unbuffered) as supporting electrolytes and a custom-built potentiostat interfaced with a standard PC via an ADDA-converter card operated using custom developed software. A relative hydrogen reference electrode59,60 was used in the experiments with the acidic electrolyte solution, with the solution of 0.1 M KClO4 a mercurous sulfate electrode (EMSE = 0.375 V vs. a saturated calomel electrode SCE and 1.252 V vs. RHE in this electrolyte solution) was employed in order to avoid contamination of the electrolyte solution with specifically adsorbing chloride ions. A gold sheet was used as the counter electrode in an H-cell with compartments separated by glass frits.SER spectra were recorded on an ISA T64000 spectrometer connected to a Spectraview 2D CCD detection system using λ0 = 647.1 nm excitation laser light provided by a Coherent Innova 70 Series ion laser, the laser power was measured at the laser head with a Coherent 200 power meter. Normal Raman spectra of liquid thiophenol were recorded for comparison on a MonoVista CRS High Resolution spectrometer at λ0 = 473 nm with exciting laser light provided by a Cobolt solid state laser at approx. 8 mW laser power at the sample. Infrared spectra were acquired on a BioRad FTS40 instrument at 2 cm−1 resolution with 32 scans and baseline-correction.
Roughening of the gold electrode (Schiefer, Hamburg, polycrystalline 99.99%, polished down to 0.3 μm Al2O3 to ascertain a defined clean surface state) employed to confer SERS activity was performed in a separate cell with an aqueous solution of 0.1 M KCl by cycling the electrode potential between ESCE = −0.8 V and ESCE = 1.65 V for about 10 minutes.61
Electrolyte solutions were prepared from 18 MOhm water (Seralpur Pro 90 c), thiophenol (Merck, z.S., used as received), perchloric acid (Acros, p.A.), and KClO4 (Merck, Suprapur). All solutions were freshly prepared, purged with nitrogen (99.999%), and all experiments were performed at room temperature (20 °C).
Adsorption of thiophenol on the gold electrodes was performed by exposing the electrodes for 5 min31 to 1 hour62 to its solution (5 and 1 mM) in absolute ethanol (VWR, AnalaR, min. 99.8%) without any electrode potential control.
Results and discussion
Cyclic voltammograms recorded in an aqueous 1 M HClO4 electrolyte solution with a gold electrode without and with preadsorbed thiophenol (tad = 5 min if not stated otherwise) starting at the negative potential limit are displayed in Fig. 1. In the positive going scan a substantial change in the current wave associated with the formation of the gold hydroxide/oxide layer is found. The cathodic reduction peak associated with the reductive conversion of the gold oxide/hydroxide surface layer is somewhat diminished. Thus this layer has been formed to a smaller extent. Consequently a substantial portion of the anodic charge must have been consumed in oxidation or at least oxidative desorption of the adsorbed thiolate. No attempt has been made to estimate the amount of coverage as applied elsewhere.63 The duration of the adsorption (ranging from 5 to 60 min according to ref. 31 and 62) did not show qualitatively different results. The estimated amount of coverage deduced from the anodic charge was only slightly larger with a longer adsorption time as evidenced in the inset of Fig. 1. Consequently, all experiments were performed with the shorter adsorption time of 5 min.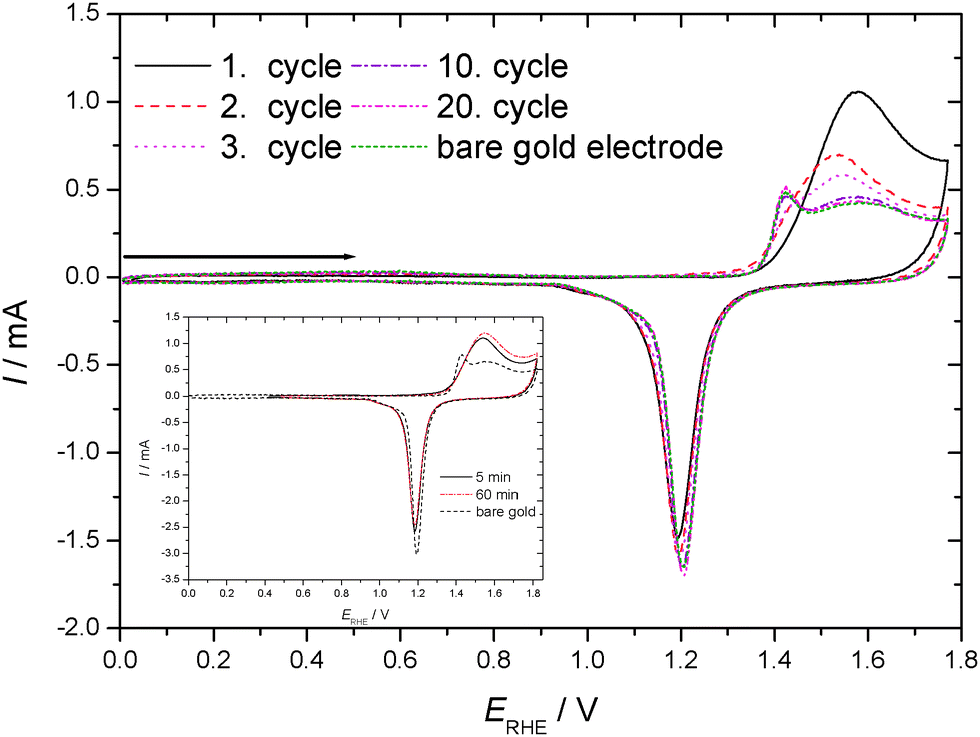 | ||
| Fig. 1 Cyclic voltammograms of a gold sheet electrode without/with adsorbed TP in an aqueous solution of 1 M HClO4 (full electrode potential cycles); dE/dt = 0.1 V s−1, room temperature, nitrogen purged. Inset: effect of adsorption time. | ||
CVs recorded in an aqueous 1 M HClO4 electrolyte solution with a gold electrode without and with preadsorbed thiophenol (tad = 5 min) from the spontaneously established rest potential towards anodic and cathodic directions are displayed in Fig. 2. This procedure does not risk electrode-potential induced changes, in particular desorption, caused by the initial potential step proceeding in the potential–time procedure applied for Fig. 1 where the electrode potential is switched from the rest potential established spontaneously at open circuit to the starting potential at the negative limit of the potential window where the first scan is initiated. No evidence of cathodic desorption or adsorbate reduction as reported elsewhere with e.g. 4-mercaptopyridine64,65 is found in the negative going scan. In the positive going scan, again, a substantial change in the current wave associated with the formation of the gold hydroxide/oxide layer is found. Differences between the current response of the covered and the uncovered electrodes are similar to those observed with the different potential–time regime applied in the previous experiment (see Fig. 1). After about ten electrode potential cycles reaching into the oxygen evolution region the CV of a pristine, uncoated gold electrode is observed. Assuming that strength of interaction – in the remaining absence of precise thermodynamic data – can be related qualitatively to the number of electrode potential scans necessary to remove an adsorbate; this observation agrees closely with results obtained with e.g. 4-mercaptobenzonitrile.66
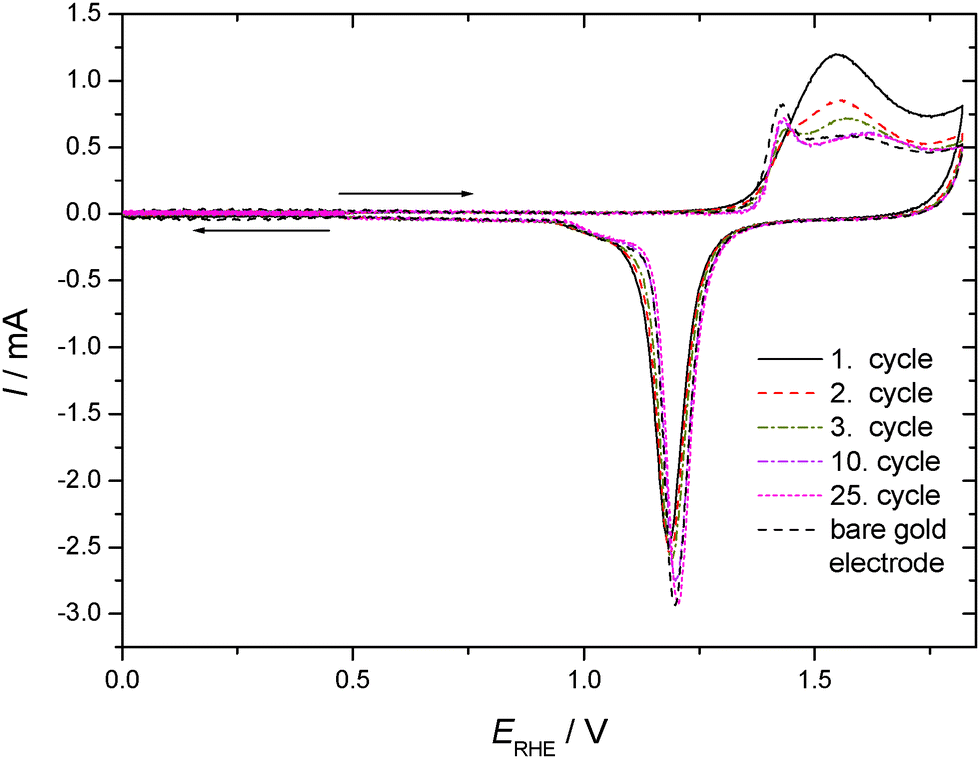 | ||
| Fig. 2 Cyclic voltammograms of a gold sheet electrode without/with adsorbed TP in a solution of 1 M HClO4 (partial cycles starting at spontaneous established rest potential, arrows indicate direction of scan with starting point of arrow indicating initial electrode potential); dE/dt = 0.1 V s−1, room temperature, nitrogen purged. | ||
CVs recorded using TP adsorbed on a polycrystalline gold electrode subsequently exposed to an aqueous electrolyte solution of 0.1 M KClO4 are shown in Fig. 3 for positive and negative going potential scans always starting at the spontaneously established rest potential. In comparison to the results obtained with an acidic electrolyte solution of well-defined pH-value a significantly different picture emerges. Oxidation of the gold electrode surface is strongly inhibited at less positive electrode potentials, but the anodic current finally observed at more positive potentials is more than double the value recorded with the supporting electrolyte solution. The associated reduction feature in the return scan usually assigned to a less strongly bound surface oxide, which is thus more easily reduced, is the same as that observed with the blank electrolyte solution, whereas the second reduction peak (at lower electrode potential) is almost absent. Accordingly the anodic current must be associated with formation of the less strongly bound surface oxide, and some charge (when taking the anodic charge as a measure) is consumed by an oxidative process involving TP without the formation of a strongly bound surface oxide.
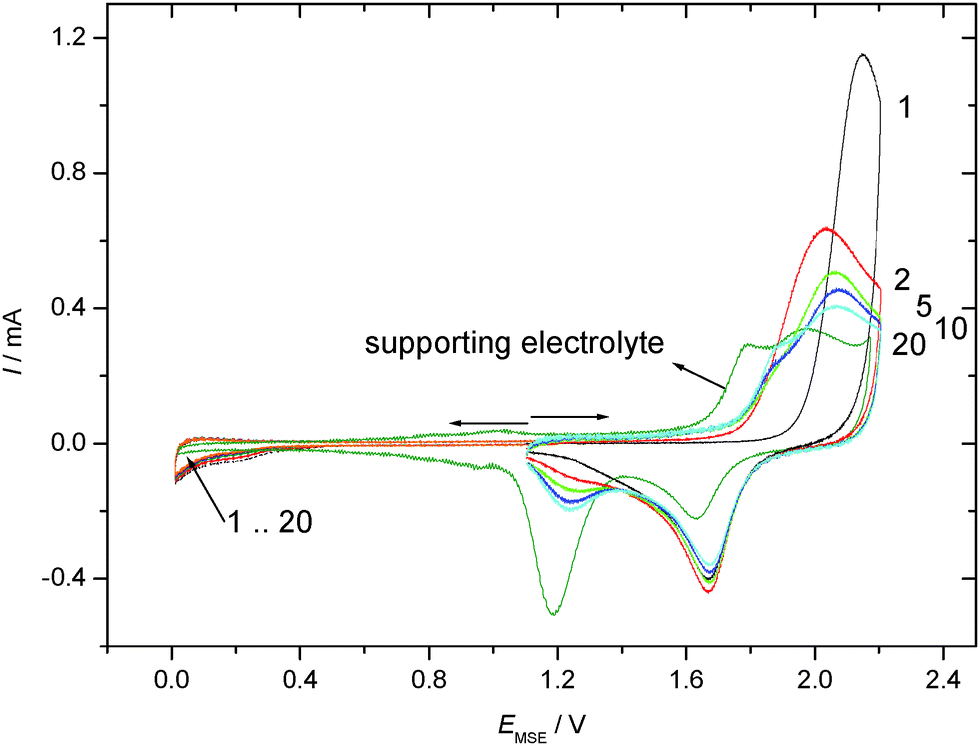 | ||
| Fig. 3 Cyclic voltammograms of a gold sheet electrode without/with adsorbed TP in a solution of 0.1 M KClO4 (full cycle, arrows indicate direction of scan with starting point of arrow indicating initial electrode potential); dE/dt = 0.1 V s−1, room temperature, nitrogen purged. | ||
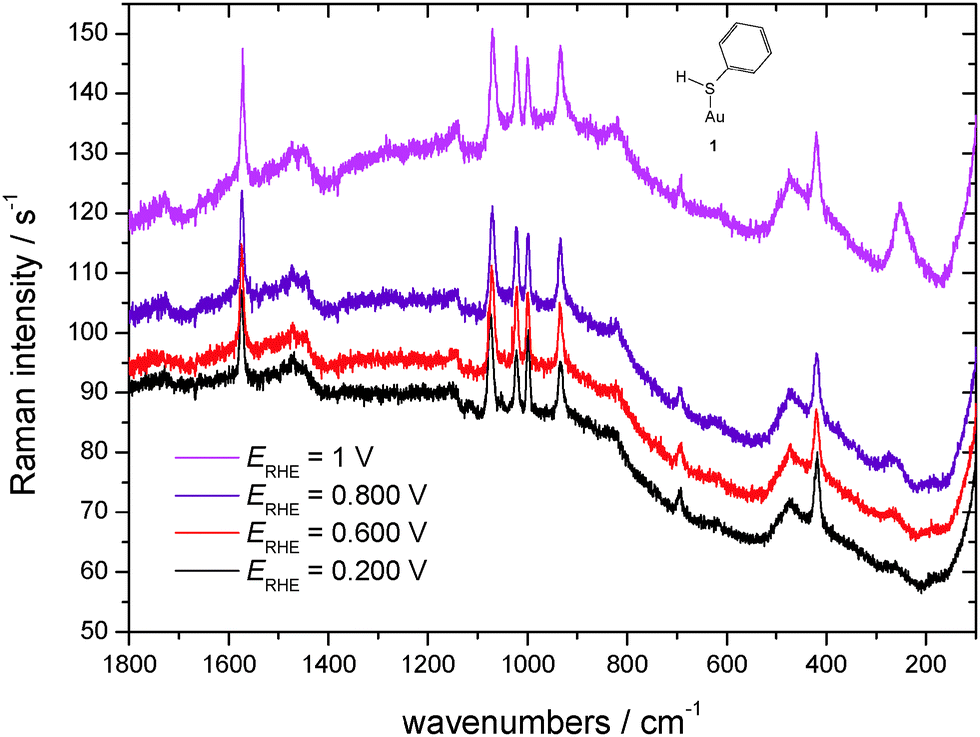
SER spectra of TP preadsorbed on a roughened gold electrode in contact with an aqueous solution of 1 M HClO4 are displayed in Fig. 5, as the reference vibrational spectra of TP are shown in Fig. 4. Assignment of bands as listed in Table 1 is based on literature data.58,67–72 Interpretation of SER spectra aiming at elucidation of structural information ranging in the present case from the mode of interaction between TP and the gold surface to possible intermolecular interactions up to SAM-formation is based on (1) identification and assignment of bands not observed with the bulk molecule, changes in (2) band position and (3) intensity, for an introductory overview see ref. 73. The spectra show a band around 265 cm−1, which does not appear for liquid thiophenol (Fig. 4),70 becoming more pronounced and shifting towards lower wavenumbers with more positive electrode potentials. The shift implies a weaker bond at more positive electrode potentials. This in turn would not support adsorption of TP as a negatively charged species (see 2 in Scheme 1) but instead as an intact molecule R–S–H (showing a substantially weaker Au–S bond energy according to Li et al.13) or as thiolate C6H5S– as also proposed by Li et al.13 Confusion with the C–S in-plane bending mode observed by Li et al.13 at 274 cm−1 with liquid TP but not seen here (see Fig. 4) is only theoretically possible, the extreme enhancement needed to support such assignment with the concomitant absence of a gold–sulfur mode makes it very unlikely. Distinction between the two options 1 and 3 (Scheme 1) is possible based on the intensity patterns and band positions reported by Li et al.13 In the present case adsorption as intact TP can be deduced when taking into account the pronounced band at 933 cm−1 assigned to the C–S–H bending mode. The presence of a hydrogen atom at the sulfur atom will presumably have only a small steric effect pushing the aromatic ring closer to the metal surface and possibly diminishing surface enhancement of in-plane modes. This argument will thus hardly help to explain the lower overall SERS intensity.
 | ||
| Fig. 4 Normal Raman and infrared spectra of thiophenol. | ||
 | ||
| Fig. 5 SER-spectra of TP adsorbed on a polycrystalline gold electrode, aqueous solution of 1 M HClO4, room temperature, nitrogen purged, for experimental conditions see text. | ||
| Mode | # | Sym. Cy2va | Infrared | NRS, Fig. 4 | 1 M HClO4 (Fig. 5) | |||
|---|---|---|---|---|---|---|---|---|
| E RHE = 0.2 V | E RHE = 0.6 V | E RHE = 0.8 V | E RHE = 1 V | |||||
| δ = in-plane deformation, γ = out-of-plane deformation, ν = stretching, νs = symmetric stretching. βas = rocking, νs = wagging, βs = scissoring, # = Wilson mode number, all modes in-plane if not stated otherwise oop: out-of-plane.a Sometimes this is approximated as C2v (e.g. in ref. 68).b Numbers in bracket refer to the assignments bei Varsanyi69 (first value), Kohlrausch67 (second value), and Scott et al.68 (third value); #: Wilson mode number. | ||||||||
| — | — | — | — | — | — | 187 | 188 | — |
| ν Au–S | — | — | — | — | 265 | 266 | 267 | 253 |
| — | — | — | — | 314 | — | — | — | — |
| ν CH | 7a | a1 | — | 413 | 416 | 420 | 419 | 419 |
| ip | (412;413;412)b | |||||||
| ν ring | 16b | b1 | — | — | 474 | 475 | 475 | 473 |
| oop | oop | (464;461;462) | ||||||
| ν ring | 6b | b2 | — | 617 | — | — | — | — |
| ip | (617;617;615) | |||||||
| ν ring | 6a | a1 | 698 | 698 | 693 | 694 | 695 | 693 |
| ip | (698;698;697) | |||||||
| γ CH | 11 | b1 | 734 | 736 | — | — | — | — |
| oop | oop | (736;734;737) | ||||||
| γ CH | 10a | a1 | 835 | 834 | 820 | 822 | 822 | 823 |
| oop | oop | (834;836;836) | ||||||
| ν C–S–H | — | — | 916 | 916 | 933 | 933 | 933 | 933 |
| (914;920;914) | ||||||||
| γ CH | 5 | b1 | — | 988 | — | — | — | — |
| oop | oop | (991;991;991) | ||||||
| ν ring | 12 | a1 | 1000 | 1000 | 998 | 999 | 999 | 999 |
| ip | (1002;1000;1000) | |||||||
| δ CH | 18a | a1 | 1025 | 1024 | 1022 | 1023 | 1023 | 1023 |
| ip | (1026;1025;1024) | |||||||
| δ CH | 18b | b2 | 1071 | (—;—;1070) | 1073 | 1073 | 1073 | 1071 |
| ip | ||||||||
| ν ring | 1 | a1 | 1091 | 1091 | ||||
| ip | (1091;1097;1092) | |||||||
| Comb. mode | — | — | 1118 | 1118 | 1115 | — | — | — |
| (—;—;1116) | ||||||||
| δ CH | 9b | b2 | 1156 | 1157 | 1143 | 1144 | 1144 | 1142 |
| ip | (1159;1154;1157) | |||||||
| δ CH | 9a | a1 | 1181 | 1181 | — | — | — | — |
| ip | (1182;1180;1180) | |||||||
| δ CH | 19b | b2 | 1441 | — | — | — | — | — |
| ip | ||||||||
| δ CH | 19a | a1 | 1478 | — | 1472 | 1472 | 1473 | 1474 |
| ip | (—;—;1481) | |||||||
| ν ring | 8a | a1 | 1582 | 1584 | 1574 | 1574 | 1575 | 1571 |
| ip | (1582;1582;1581) | |||||||
| — | — | — | — | — | — | — | 1729 | 1729 |
| ν S–H | — | — | 2569 | 2567 | — | — | — | — |
| (2575;2566;2566) | ||||||||
For comparison SER spectra of related adsorbates interacting via the sulfur atom with the gold surface can be used. Several studies of thiol compounds adsorbed on gold surfaces by various authors have been reported,10,12,74,75 for a brief overview see also ref. 65. Joo et al.75 found a band at 227 cm−1 with benzyl phenyl sulfide adsorbed on a gold sol and assigned it to the Au–S stretching mode. Kang et al. assigned a band found for cyclohexyl isothiocyanate adsorbed at gold surfaces at 251 and 261 cm−1 (surprisingly depending on the adsorbate concentration in the deposition solution) to the Au–S stretching mode.76 A band at 264 cm−1 was assigned by Bron and Holze64,65 to the Au–S stretching of 4-mercaptopyridine adsorbed on a gold substrate. With the isomeric 2-mercaptopyridine this band was found at 235 cm−1.63 In a SERS study of adsorbed benzenethiol on gold a mode at 275 cm−1 not visible in the displayed spectra was assigned to the Au–S stretching.12 Szafranski et al.10 noticed a band at 270 cm−1 which was tentatively assigned either to the ring vibration mode ν15 or a gold–sulfur mode. Mode ν15 was neither observed in spectra of neat TP by Szafranski et al. nor by us (see Fig. 4); elsewhere, this band has been classified as weak.69 Thus the band 265 cm−1 can be indeed assigned to the gold–sulfur mode implying an adsorbate orientation with the benzene ring pointing away from the electrode surface on the surface. Comparison of band intensities may provide evidence regarding molecular orientation. Although surface selection rules of the clear-cut type effective for infrared reflection spectroscopy as deduced by Greenler77 are not available for SERS more complex ones have been deduced (see e.g. see ref. 78–82). As concluded elsewhere based on ample evidence particularly from comparative studies employing other tools of surface science vibrational modes perpendicular to the surface are particularly intense.83,84 Assuming in slight simplification C2v symmetry of TP the vibrational modes can be classified into in-plane a1 and b2 modes and out-of-plane a2 and b1 modes with all modes being Raman-active. Interaction with the surface may further reduce symmetry and – at least generally speaking – cause further Raman-silent modes to become active. As collected in Table 1 almost all observed bands are of the in-plane type. Thus it can be concluded, that TP is oriented with the aromatic ring pointing away from the electrode surface. A distinction between the suggested sp- or sp3-hybridization and the corresponding bond angles is not possible with the evidence reported here and in the absence of vibrational spectroscopic evidence of sp-hybridization.
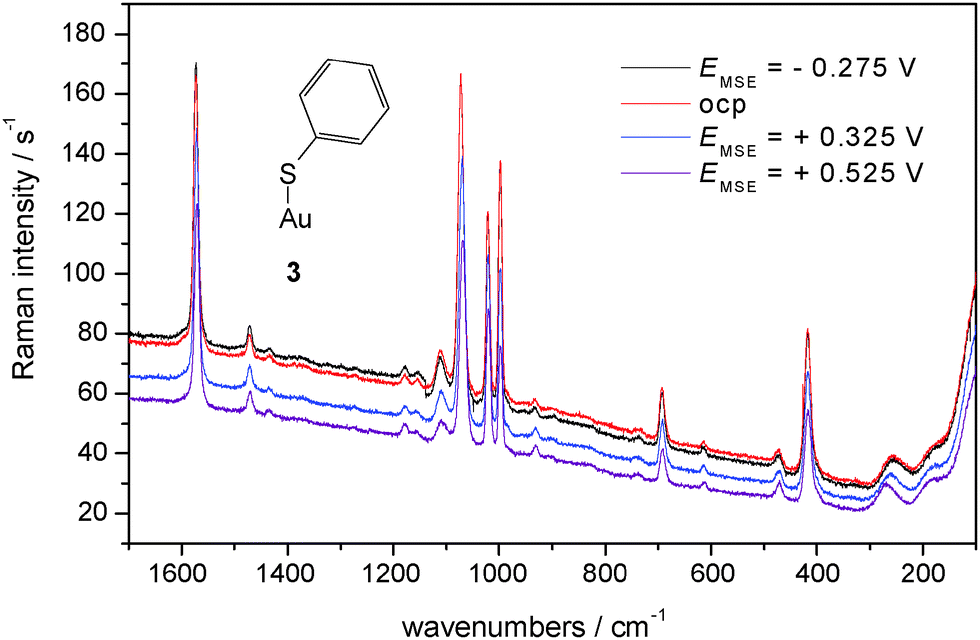
In Fig. 6 SER spectra of TP adsorbed on a polycrystalline gold electrode in contact with an aqueous electrolyte solution of 0.1 M KClO4 are shown, band positions and assignments are collected in Table 2. A prominent change of relative intensity concerns the band at 933 cm−1 assigned to the C–S–H bending mode. Its relative weakness implies a relatively smaller amount of adsorbed R–S–H; accordingly R–S–dominates. The band assigned to the Au–S stretching mode is relatively weaker, its position shifts with positively going electrode potential to higher wavenumbers. Assuming thiolate as the adsorbed species the interaction (i.e. bond) will become stronger simply because of electrostatics (for other strongly adsorbed species see e.g.ref. 61).
 | ||
| Fig. 6 SER-spectra of TP adsorbed on a polycrystalline gold electrode, aqueous solution of 0.1 M KClO4, room temperature, nitrogen purged, for experimental conditions see text. | ||
| Mode | # | Sym. Cy2v | Infrared | NRS, Fig. 4 | 0.1 M KClO4 (Fig. 6) | |||
|---|---|---|---|---|---|---|---|---|
| E MSE = 0.275 V | ocp | E MSE = 0.325 V | E MSE = 0.525 V | |||||
| δ = in-plane deformation, γ = out-of-plane deformation, ν = stretching, νs = symmetric stretching. βas = rocking, γs = wagging, βs = scissoring, # = Wilson mode number, all modes in-plane if not stated otherwise oop: out-of-plane.a Numbers in bracket refer to the assignments bei Varsanyi69 (first value), Kohlrausch67 (second value), and Scott et al.68 (third value); #: Wilson mode number. | ||||||||
| — | — | — | — | — | 176 | 172 | 178 | 177 |
| ν Au–S | — | — | — | — | 260 | 256 | 261 | 270 |
| — | — | — | — | 314 | — | — | — | — |
| ν CH | 7a | a1 | — | 413 | 417 | 417 | 416 | 417 |
| ip | (412;413;412)a | |||||||
| ν ring | 16b | b1 | — | — | 472 | 472 | 471 | 470 |
| oop | oop | (464;461;462) | ||||||
| δ ring | 6b | b2 | — | 617 | 617 | 613 | 612 | 613 |
| ip | (617;617;615) | |||||||
| δ ring | 6a | a1 | 698 | 698 | 692 | 692 | 692 | 691 |
| ip | (698;698;697) | |||||||
| γ CH | 11 | b1 | 734 | 736 | 733 | 737 | 740 | 738 |
| oop | oop | (736;734;737) | ||||||
| γ CH | 10a | a1 | 835 | 834 | — | — | — | — |
| oop | oop | (834;836;836) | ||||||
| ν C–S–H | — | — | 916 | 916 | 934 | 933 | 931 | 930 |
| (914;920;914) | ||||||||
| γ CH | 5 | b1 | — | 988 | — | — | — | — |
| oop | oop | (991;991;991) | ||||||
| ν ring | 12 | a1 | 1000 | 1000 | 997 | 997 | 997 | 997 |
| ip | (1002;1000;1000) | |||||||
| δ CH | 18a | a1 | 1025 | 1024 | 1021 | 1021 | 1020 | 1020 |
| ip | (1026;1025;1024) | |||||||
| δ CH | 18b | b2 | 1071 | (—;—;1070) | 1073 | 1073 | 1070 | 1069 |
| ip | ||||||||
| ν ring | 1 | a1 | 1091 | 1091 | — | — | — | — |
| ip | (1091;1097;1092) | |||||||
| Comb. mode | — | — | 1118 | 1118 | 1110 | 1111 | 1110 | 1109 |
| (—;—;1116) | ||||||||
| δ CH | 9b | b2 | 1156 | 1157 | 1156 | 1154 | 1157 | 1156 |
| ip | (1159;1154;1157) | |||||||
| δ CH | 9a | a1 | 1181 | 1181 | 1178 | 1178 | 1177 | 1178 |
| ip | (1182;1180;1180) | |||||||
| δ CH | 19b | b2 | 1441 | — | 1434 | 1432 | 1435 | 1434 |
| ip | ||||||||
| δ CH | 19a | a1 | 1478 | — | 1471 | 1470 | 1470 | 1470 |
| ip | (—;—;1481) | |||||||
| ν ring | 8a | a1 | 1582 | 1584 | 1572 | 1573 | 1572 | 1571 |
| ip | (1582;1582;1581) | |||||||
| — | — | — | — | — | — | — | ||
| ν S-H | — | — | 2569 | 2567 | — | — | — | — |
| (2575;2566;2566) | ||||||||
No further significant changes in band positions and relative intensities are observed for both electrolyte solutions. This is in agreement both with the almost covalent attachment of the molecule via the sulfur atom and an orientation of the molecule away from the surface with less exposure to the electric field in the electrochemical double layer possibly yielding band shifts. A striking difference between SER spectra obtained in acidic and neutral solution is the overall scattering intensity. The generally much larger one with the neutral solution indicates a larger coverage or a pH-dependent orientation of the scattering molecules; surface enhancement itself does not appear to be pH-dependent. The difference in intensities can be rationalized when considering the pH-dependent dissociation equilibrium of TP. In the almost neutral electrolyte solution a larger fraction of thiolate ions may be available for adsorption, and although the dominating driving force of adsorption is the gold–sulfur bond energy the electrostatic interaction in particular at electrode potentials positive to the potential of zero charge Epzc (−0.18 < Epzcvs.SHE < 0.34 V, i.e. −0.893 < Epzcvs.MSE < −0.313 V, ref. 8) appears to assist in adsorption yielding a higher coverage. In acidic solution the protonated form prevails and is adsorbed as evidenced with the band of the C–S–H bending mode. The electrostatic driving force is thus not as effective in supporting high coverage. Assessment of the influence of the pH-value on the adsorbate orientation and consequently on scattered intensity is presently too speculative. The CVs (Fig. 1–3) do not provide quantitative information about degree of coverage or number of adsorbed species, thus they are not in contradiction to this explanation.
Acknowledgements
Financial support from the Fonds der Chemischen Industrie and the Deutsche Forschungsgemeinschaft and help in acquiring some spectra and CVs from Monique Helmert and Hamidreza Sardary are gratefully acknowledged.References
- V. M. Mirsky, TRAC, 2002, 21, 439–450 CAS.
- A. L. Eckermann, D. J. Feld, J. A. Shaw and T. J. Meade, Coord. Chem. Rev., 2010, 254, 1769–1802 CrossRef CAS PubMed.
- J. Zhang, A. C. Welinder, Q. Chi and J. Ulstrup, Phys. Chem. Chem. Phys., 2011, 13, 5526–5545 RSC.
- V. S. Dilimon, S. Rajalingam, J. Delhalle and Z. Mekhalif, Phys. Chem. Chem. Phys., 2013, 15, 16648–16656 RSC.
- T. Baunach, V. Ivanova, D. A. Scherson and D. M. Kolb, Langmuir, 2004, 20, 2797–2802 CrossRef CAS PubMed.
- E. Blomgren, J. O'M Bockris and C. Jesch, J. Phys. Chem., 1961, 65, 2000–2010 CrossRef CAS.
- J. O'M Bockris and K. T. Jeng, J. Electroanal. Chem., 1992, 330, 541–581 CrossRef.
- For an overview of methods and results see: R. Holze, in Landolt-Börnstein: Numerical Data and Functional Relationships in Science and Technology, New Series, Group IV: Physical Chemistry, Volume 9: Electrochemistry, Subvolume A: Electrochemical Thermodynamics and Kinetics, ed. W. Martienssen and M. D. Lechner, Springer-Verlag, Berlin, 2007 Search PubMed.
- A. Ulman, Chem. Rev., 1996, 96, 1533–1554 CrossRef CAS PubMed.
- C. A. Szafranski, W. Tanner, P. E. Laibinis and R. L. Garrell, Langmuir, 1998, 14, 3570–3579 CrossRef CAS.
- For a recent overview see: G. McNay, D. Eustace, W. E. Smith, K. Faulds and D. Graham, Appl. Spectrosc., 2011, 65, 825–837 CrossRef CAS PubMed.
- K. Carron and L. G. Hurley, J. Phys. Chem., 1991, 95, 9979–9984 CrossRef CAS.
- S. J. Li, D. Y. Wu, X. Y. Xu and R. N. Gu, J. Raman Spectrosc., 2007, 38, 1436–1443 CrossRef CAS.
- S. K. Saikin, Y. Z. Chu, D. Rappoport, K. B. Crozier and A. Aspuru-Guzik, J. Phys. Chem. Lett., 2010, 1, 2740–2746 CrossRef CAS.
- H.-L. Wu, H.-R. Tsai, Y.-T. Hung, K.-U. Lao, C.-W. Liao, P.-J. Chung, J.-S. Huang, I.-C. Chen and M. H. Huang, Inorg. Chem., 2011, 50, 8106–8111 CrossRef CAS PubMed.
- X.-Y. Xu, S.-J. Li, D.-Y. Wu and R.-A. Gu, Acta Chim. Sin., 2007, 65, 1095–1100 CAS.
- J. Nara, S. Higai, Y. Morikawa and T. Ohno, J. Chem. Phys., 2004, 120, 6705–6711 CrossRef CAS PubMed.
- S. M. Ansar, X. Li, S. Zou and D. Zhang, J. Phys. Chem. Lett., 2012, 3, 560–565 CrossRef CAS.
- H. Yang, N. Gozubenli, Y. Fang and P. Jiang, Langmuir, 2013, 29, 7674–7681 CrossRef CAS PubMed.
- Y. Jiao, D. S. Koktysh, N. Phambu and S. M. Weiss, Appl. Phys. Lett., 2010, 97, 53125 CrossRef.
- J. Fontana, J. Livenere, F. J. Bezares, J. D. Caldwell, R. Rendell and B. R. Ratna, Appl. Phys. Lett., 2013, 102, 201606 CrossRef.
- T. T. Nhung, Y. Bu and S.-W. Lee, J. Cryst. Growth, 2013, 373, 132–137 CrossRef CAS.
- W. Hüttner, K. Christou, A. Göhmann, V. Beushausen and H. Wackerbarth, Microfluid. Nanofluid., 2012, 12, 521–527 CrossRef.
- M. Moskovits, Phys. Chem. Chem. Phys., 2013, 15, 5301–5311 RSC.
- J. R. Lombardi and R. L. Birke, J. Chem. Phys., 2012, 136, 144704 CrossRef PubMed.
- J. R. Lombardi and R. L. Birke, J. Phys. Chem. C, 2008, 112, 5605–5617 CAS.
- S. W. Joo, Chem. Lett., 2004, 33, 60–61 CrossRef CAS.
- H. Xu, C. H. Tseng, T. J. Vickers, C. K. Mann and J. B. Schlenoff, Surf. Sci., 1994, 311, L707–L711 CrossRef CAS.
- M. A. Mahmoud and M. A. El-Sayed, Nano Lett., 2009, 9, 3025–3031 CrossRef CAS PubMed.
- K. D. Alexander, M. J. Hampton, S. P. Zhang, A. Dhawan, H. X. Xu and R. Lopez, J. Raman Spectrosc., 2009, 40, 2171–2175 CrossRef CAS.
- C. E. Taylor, J. E. Pemberton, G. G. Goodman and M. H. Schoenfisch, Appl. Spectrosc., 1999, 53, 1212–1221 CrossRef CAS.
- R. Buividas, N. Fahim, J. Juodkazyte and S. Juodkazis, Appl. Phys. A: Mater. Sci. Process., 2014, 114, 169–175 CrossRef CAS.
- B. Ren, G. Picardi, B. Pettinger, R. Schuster and G. Ertl, Angew. Chem., Int. Ed., 2005, 44, 139–142 CrossRef CAS PubMed.
- J. M. Marr and Z. D. Schultz, J. Phys. Chem. Lett., 2013, 4, 3268–3272 CrossRef CAS PubMed.
- X. M. Fan, W. J. Zou, R. A. Gu and J. L. Yao, Chem. J. Chin. Univ., 2008, 29, 130–134 CAS.
- M. Wang, J. L. Yao and R. A. Gu, Chem. J. Chin. Univ., 2006, 27, 1518–1521 CAS.
- X. Li, M. Cao, H. Zhang, L. Zhou, S. Cheng, J.-L. Yao and L.-J. Fan, J. Colloid Interface Sci., 2012, 382, 28–35 CrossRef CAS PubMed.
- L. Ling, M. M. Xu, R. A. Gu and J. L. Yao, Acta Chim. Sin., 2007, 65, 779–784 CAS.
- Y. Cui, B. Ren, J. L. Yao, R. A. Gu and Z. Q. Tian, J. Phys. Chem. B, 2006, 110, 4002–4006 CrossRef CAS PubMed.
- C. C. Chang, H. L. Wu, C. H. Kuo and M. H. Huang, Chem. Mater., 2008, 20, 7570–7574 CrossRef CAS.
- M. A. Mahmoud, Langmuir, 2013, 29, 6253–6261 CrossRef CAS PubMed.
- M. A. Mahmoud and M. A. El-Sayed, J. Phys. Chem. B, 2013, 117, 4468–4477 CrossRef CAS PubMed.
- T. Bhuvana, G. V. P. Kumar, G. U. Kulkarni and C. Narayana, J. Phys. Chem. C, 2007, 111, 6700–6705 CAS.
- Y. N. Kim, S. H. Yoo and S. O. Cho, J. Phys. Chem. C, 2009, 113, 618–623 CAS.
- S. J. Li and R. A. Gu, Acta Chim. Sin., 2004, 62, 2118–2122 CAS.
- M. Ge, F. Bao, J. L. Yao, R. Sun and R. A. Gu, Acta Chim. Sin., 2009, 67, 2285–2289 CAS.
- Y.-T. Tao, C.-C. Wu, J.-Y. Eu, W.-L. Lin, K.-C. Wu and C.-H. Chen, Langmuir, 1997, 13, 4018–4023 CrossRef CAS.
- H. Sellers, A. Ulman, Y. Shnidman and J. E. Eilers, J. Am. Chem. Soc., 1993, 115, 9389–9401 CrossRef CAS.
- M. Tachibana, K. Yoshizawa, A. Ogawa, H. Fujimoto and R. Hoffmann, J. Phys. Chem. B, 2002, 106, 12727–12736 CrossRef CAS.
- E. Sabatani, J. Cohen-Boulakia, M. Bruening and I. Rubinstein, Langmuir, 1993, 9, 2974–2981 CrossRef CAS.
- K. S. Shin, J. Raman Spectrosc., 2008, 39, 468–473 CrossRef CAS.
- M. Futamata, J. Phys. Chem., 1995, 99, 11901–11908 CrossRef CAS.
- H. M. Lee, M. S. Kim and K. Kim, Vib. Spectrosc., 1994, 6, 205–214 CrossRef CAS.
- C. J. Sandroff and D. R. Herschbach, J. Phys. Chem., 1982, 86, 3277–3279 CrossRef CAS.
- M. Takahashi, M. Fujita and M. Ito, Surf. Sci., 1985, 158, 307–313 CrossRef CAS.
- M. Takahashi and M. Ito, Chem. Phys. Lett., 1984, 103, 512–516 CrossRef CAS.
- M. Takahashi, M. Fujita and M. Ito, Chem. Phys. Lett., 1984, 109, 122–127 CrossRef CAS.
- T. H. Joo, K. Kim and M. S. Kim, J. Raman Spectrosc., 1987, 18, 57–60 CrossRef CAS.
- F. G. Will and H. J. Hess, J. Electrochem. Soc., 1973, 120, 1–11 CrossRef CAS.
- F. G. Will, J. Electrochem. Soc., 1986, 133, 454–455 CrossRef CAS.
- R. Holze, Surf. Sci., 1988, 202, L612–L620 CrossRef CAS.
- T. Sueoka, J. Inukai and M. Ito, J. Electron Spectrosc. Relat. Phenom., 1993, 64–65, 363–370 CrossRef CAS.
- N. Hassan and R. Holze, Elektrokhimiya, 2012, 48, 442–453 Search PubMed; N. Hassan and R. Holze, Russ. J. Electrochem., 2012, 48, 401–411 CrossRef CAS.
- M. Bron and R. Holze, 205th Electrochemical Society Meeting, San Antonio, TX, USA, 2004, abstract # 867 Search PubMed.
- M. Bron and R. Holze, J. Solid State Electrochem. Search PubMed , submitted.
- R. Holze, J. Solid State Electrochem., 2013, 17, 1869–1879 CrossRef CAS.
- K. W. F. Kohlrausch, Ramanspektren, Akademische Verlagsgesellschaft Becker & Erler Leipzig, 1943 Search PubMed.
- D. W. Scott, J. P. McCullough, W. N. Hubbard, J. F. Messerly, I. A. Hossenlopp, F. R. Frow and G. Waddington, J. Am. Chem. Soc., 1956, 78, 5463–5468 CrossRef CAS.
- G. Varsányi, Assignments for Vibrational Spectra of Seven Hundred Benzene Derivatives, Adam Hilger, London, 1974 Search PubMed.
- J. H. S. Green, Spectrochim. Acta, 1968, 24A, 1627–1637 CrossRef.
- A. Wokaun, J. P. Gordon and P. F. Liao, Phys. Rev. Lett., 1982, 48, 957–960 CrossRef CAS.
- F. R. Dollish, W. G. Fateley and F. F. Bentley, Characteristic Raman Frequencies of Organic Compounds, Wiley, New York, 1974 Search PubMed.
- R. Holze, Surface and Interface Analysis: An Electrochemists Toolbox, Springer-Verlag, Heidelberg, 2009 Search PubMed.
- S. W. Joo, S. W. Han and K. Kim, J. Phys. Chem. B, 2000, 104, 6218–6224 CrossRef CAS.
- S. W. Joo, S. W. Han and K. Kim, Appl. Spectrosc., 2000, 54, 378–383 CrossRef CAS.
- H. Kang, J. Noh, E. O. Ganbold, D. Uuriintuya, M. S. Gong, J. J. Oh and S. W. Joo, J. Colloid Interface Sci., 2009, 336, 648–653 CrossRef CAS PubMed.
- R. G. Greenler, J. Chem. Phys., 1966, 44, 310–315 CrossRef CAS.
- M. Moskovits, D. P. DiLella and K. J. Maynard, Langmuir, 1988, 4, 67–76 CrossRef CAS.
- M. Moskovits, J. Chem. Phys., 1982, 77, 4408–4416 CrossRef CAS.
- J. S. Suh and M. Moskovits, J. Am. Chem. Soc., 1986, 108, 4711–4718 CrossRef CAS.
- M. Moskovits and J. S. Suh, J. Phys. Chem., 1984, 88, 5526–5530 CrossRef CAS.
- R. A. Wolkow and M. Moskovits, J. Chem. Phys., 1992, 96, 3966–3980 CrossRef CAS.
- J. E. Pemberton, M. A. Bryant, R. L. Sobocinski and S. L. Joa, The 1991 Pittsburgh Conference, Chicago, Ill, USA, 1991, abstr. 748 Search PubMed.
- R. Holze, Bull. Electrochem., 1994, 10, 45–55 CAS.
Footnote |
| † Popular synonyms are: phenylmercaptan, benzenethiol. |
| This journal is © the Owner Societies 2015 |