Modeling the local potential at Pt nanoparticles in polymer electrolyte membranes
Received
21st January 2015
, Accepted 27th February 2015
First published on 2nd March 2015
Abstract
We present a physical–analytical model for the potential distribution at Pt nanodeposits in a polymer electrolyte membrane (PEM). Experimental studies have shown that solid deposits of Pt in PEM play a dual role in radical-initiated membrane degradation. Surface reactions at Pt particles could facilitate the formation as well as the scavenging of ionomer-attacking radical species. The net radical balance depends on local equilibrium conditions at Pt nanodeposits in the PEM, specifically, their equivalent local electrode potential. Our approach utilizes a continuum description of crossover fluxes of reactant gases, coupled with the kinetics of electrochemical surface reactions at Pt nanodeposits to calculate the potential distribution. The local potential is a function of the PEM structure and composition, which is determined by PEM thickness, concentrations of H2 and O2, as well as the size and density distribution of Pt particles. Model results compare well with experimental data for the potential distribution in PEMs.
1 Introduction
Prospects of unrivaled energy conversion efficiency and correspondingly reduced greenhouse gas emissions drive the global push towards polymer electrolyte fuel cell (PEFC) technology in automotive applications. Cost-effective utilization of materials as well as their stability and cycle life in the operating cell remain major challenges that must be successfully addressed. The durability and longevity of PEFCs are strongly affected by structural degradation of component materials, among which the polymer electrolyte membrane (PEM) is of central importance. The PEM degradation problem is critical for PEFC stacks in fuel cell buses that must operate for >20![[thin space (1/6-em)]](https://www.rsc.org/images/entities/char_2009.gif) 000 hours.1
000 hours.1
PEMs are exposed to thermal and mechanical stressors, coupled with the chemical attack of weak bonds of ionomer molecules by radical species, primarily ˙H, ˙OH and ˙OOH.2–4 Experimental studies linked chemical degradation of the membrane to the concentrations of these radical species.5,6
Deposits of Pt-in-the-membrane (PITM) are a consequence of Pt dissolution in the cathode catalyst layer.7 Mobile Pt ion complexes diffuse and migrate into the membrane. They form solid deposits by precipitation in the presence of H2 and O2, crossed over from anode and cathode, respectively. Solid Pt nanodeposits provide catalyst surface sites for processes involved in formation or scavenging of radicals. In addition, surface reactions at PITM could facilitate the decomposition or formation of H2O2. In the latter case, H2O2 thus formed could react at impurities such as Fe2+ to produce radicals.2,8
The effect of PITM on the durability of the PEM is still under debate. Rodgers et al. have observed a strong impact of the Pt density on the degradation of Pt-impregnated membranes.9 Ohguri et al. have investigated the formation of ˙OH at Pt particles in the membrane.10 In their work, ˙OH is detected at both the anode and the cathode side but the amount is much larger for the anode side. Ghassemzadeh et al. have observed that the chemical degradation rate was higher in the presence of Pt catalyst for a H2-rich mixture of H2 and O2 (90% H2, 2% O2, 8% Ar) as compared to an O2-rich mixture (20% O2, 2% H2, 78% Ar).11 A similar trend was reported by Aoki et al.12,13 and Ohma et al.14 Other researchers have observed severe membrane degradation in the presence of Pt particles;15–17 it has also been found that PITM can enhance durability by deactivating radicals and H2O2.18–20 Conditions such as low relative humidity, high temperature, and high cell voltage accelerate chemical degradation due to an increased formation of H2O2 in the cell.21–23
The balance of competing processes depends on local conditions such as temperature and relative humidity as well as the structure and local chemical composition of the PEM. The local chemical composition of the PEM is determined by pH and by mole fractions of H2 and O2 provided at opposite membrane sides. Local values of H2 and O2 concentrations can be calculated for given transport properties, composition and thickness of the PEM. The same conditions also determine the size, shape and density distribution of Pt deposits in the PEM.24–27 On the other hand, the formation of PITM has a feedback effect on concentrations of H2 and O2 as well as membrane humidification.17 Moreover, the rates of catalytic surface processes depend on size and shape of Pt nanoparticle deposits.21,27–29 Understanding the impact of PITM on the chemical degradation of the PEM thus involves a complex phenomenology of local conditions and structure of the PEM, as well as structure-dependent transport and reaction processes.
The local open circuit potential (OCP) of a Pt nanoparticle, considered as a nanoelectrode in the PEM, is determined by the conditions listed above. Liu and Zuckerbrod have measured the OCP distribution at a Pt nanoprobe in the membrane, with H2 and air provided at opposite membrane sides.30 They have observed a step-like potential profile. The local electrode potential in the region close to the anode was found near 0 V vs. RHE. In the region near the cathode, the OCP was found to attain values between 0.8 V and 1.0 V. Takaichi et al. have measured the OCP distribution determined by H2 and O2 permeation in the membrane.31 They have observed a change in the step position at different O2 partial pressure and relative humidity. Later, using the microprobe technique, Ohishi et al. have studied the distribution of the OCP.32 They have investigated the influence of operating conditions on O2 transport properties and the effect on the potential at the probe insertion position.
Understanding the problem of electrostatic potential at isolated metallic nanoparticles in an electrolyte is fundamentally interesting and of broader practical impact. Specifically, the problem of Pt nanodeposits in polymer electrolyte membranes has received significant attention in recent years. However, to the best of our knowledge only one modeling work has been devoted to this topic.33 Atrazhev et al. have developed a model to predict the potential distribution at a single Pt particle in the PEM.33 Their model employs an “ad hoc” formulation of the problem, in which the surface concentrations of reactant gases, H2 and O2, at a spherical Pt particle are obtained as functions of particle position. The relations are substituted in the Butler–Volmer equations and the charge balance condition is applied to numerically calculate the local mixed potential at the particle. Their model, however, suffers from physically inconsistent relations obtained for the current densities of hydrogen oxidation reaction (HOR) and oxygen reduction reaction (ORR), i.e.eqn (36) and (37) in their paper.33 As discussed in their paper, at the position of the potential step, both HOR and ORR are controlled by diffusion of reactant gases to the particle surface; thus, at this position, each of the current densities must be independent of the particle potential. However, in their relevant equations the dependency still exists. In addition, the implementation and parameterization of HOR and ORR kinetics employed in their model are incompatible with experimental data.34–36
In this paper, we present a rigorous and self-consistent formulation of the problem, which results in a physical–analytical model of the mixed-potential distribution at Pt nanodeposits in the PEM. The model employs continuum diffusion for the crossover of reactant gases, H2 and O2, coupled with local electrochemical reactions at the surface of Pt nanoparticles. The analytical solution gives the shapes of reactant concentrations and potential profile in terms of experimental parameters, including the relative concentration of H2 and O2 at the PEM boundaries, mass transfer coefficients, kinetic parameters of surface reactions at Pt, and size and density of Pt particles in the PEM. Model outcomes are compared to experimental measurements of the OCP at Pt nanodeposits in the membrane.30,31
2 The model
The model incorporates a two-scale description of transport and reaction processes in the membrane, as illustrated in Fig. 1. At the macroscale, one-dimensional (1D) diffusion governs the distribution of redox species, i.e., H2 and O2, along the thickness variable x. Even though we do not consider the membrane embedded in the fuel cell configuration, we refer to the side at which hydrogen is supplied as the anode and the side at which oxygen is provided as the cathode. Concentrations of hydrogen and oxygen in the PEM are cH2(x) and cO2(x). The concentrations at the PEM boundaries are  at x = 0 (anode side) and
  at x = l (cathode side). At the nanoscale, the hydrogen oxidation reaction (HOR), H2 ↔ 2H+ + 2e−, and the oxygen reduction reaction (ORR), O2 + 4H+ + 4e− → 2H2O proceed at the surface of Pt nanoparticles, which we assume spherical. As Pt nanoparticles are not connected to an electron source/sink, the resulting OCP must fulfill a condition that the rates of HOR and ORR processes are balanced at the particle level.
 |
| | Fig. 1 Model representation of a Pt nanoparticle in the membrane. The model assumes macroscale diffusion of H2 and O2 from the opposite membrane boundaries, coupled with local diffusion around Pt nanodeposits and reactions (HOR and ORR) at the Pt surface. | |
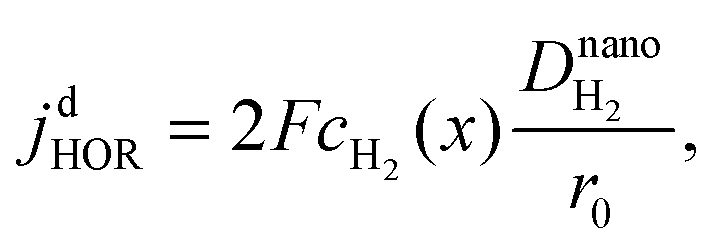
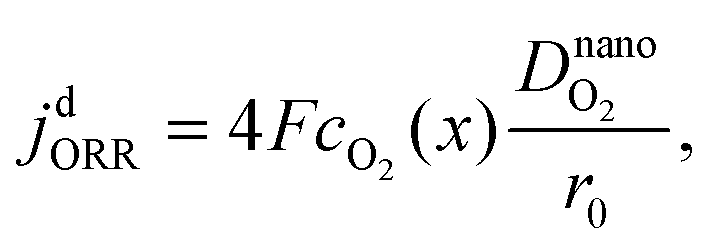
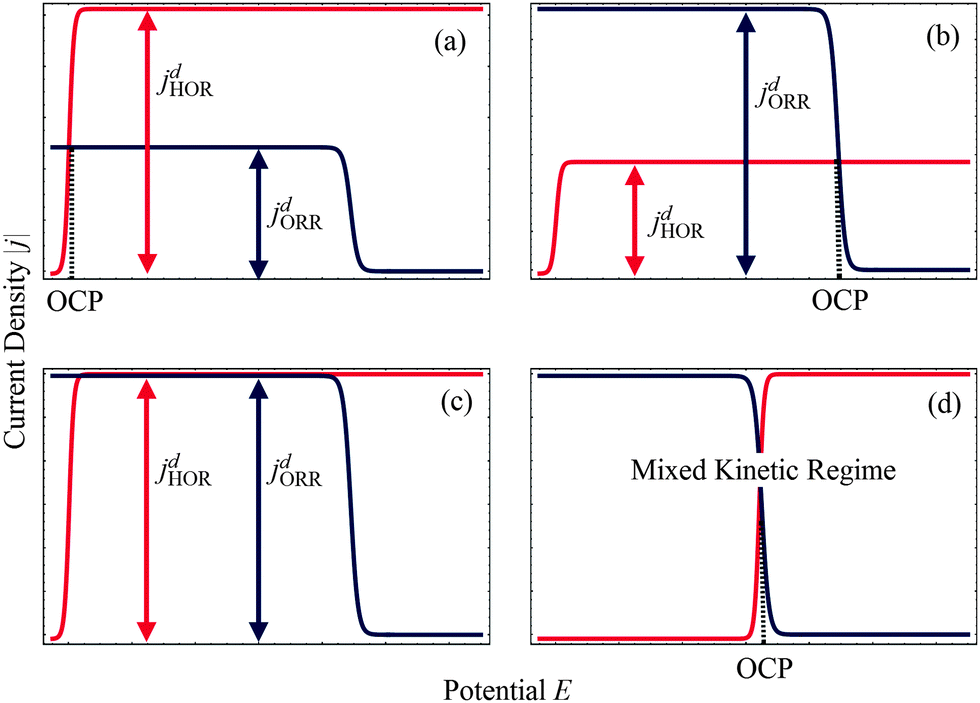
As shown in Fig. 2, four regimes can be distinguished to describe the mixed reaction kinetics at the surface of Pt nanodeposits in the PEM. The distinction is based on the comparison of diffusion and kinetically-limited current densities of HOR and ORR at the spherical Pt nanoelectrode. The diffusion limited current density of the HOR is37
| |  | (1) |
and that of the ORR is
| |  | (2) |
where
F is the Faraday constant,
r0 is the Pt particle radius,

and

are the diffusion coefficients of H
2 and O
2 at the nanoscale, respectively.
 |
| | Fig. 2 Schematic representation of HOR and ORR polarization curves, indicating open circuit potential (OCP). Plots (a) and (b) correspond to mixed diffusion-kinetic regimes for HOR and ORR. For the situation depicted in (c) both reactions are limited by local diffusion, whereas in (d) both reactions are controlled by the kinetics of surface reactions. | |
For the faradaic current densities of HOR and ORR at the particle surface, we use expressions in the form of the Butler–Volmer equation, i.e.,
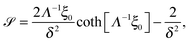
| |  | (3) |
and
| |  | (4) |
where

,

and

are surface concentrations of H
2 and O
2, respectively, and
CRef = 40.88 × 10
−6 mol cm
−3 is a reference concentration.
38 It corresponds to the O
2 concentration at standard conditions.
αa and
αc are the anodic and cathodic electron transfer coefficients,
j0HOR and
j0ORR are the exchange current densities of HOR and ORR, and
Eeq is the equilibrium potential of ORR (
vs. RHE).
R and
T are the gas constant and temperature, respectively.
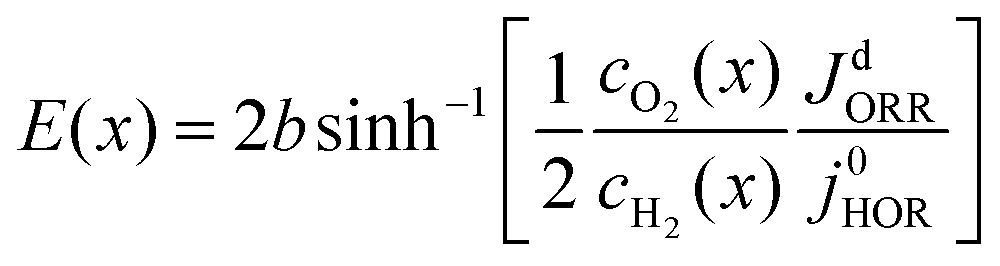
For a Pt nanodeposit at position x, one of four possible scenarios will determine the local value of the OCP, E(x): (1) If jdHOR > jdORR, then the HOR is controlled by reaction kinetics and the ORR is diffusion-limited, as shown in Fig. 2(a); in this case, E(x) remains close to the equilibrium potential of the HOR. (2) If jdHOR < jdORR, then the HOR is diffusion-limited and the ORR is kinetically controlled; in this case, E(x) shifts towards the equilibrium potential of the ORR, as illustrated in Fig. 2(b). (3) The transition between the two cases occurs at the position where jdHOR = jdORR, as shown in Fig. 2(c); in this regime, the current density at the particle is independent of E(x); it corresponds to a step-like change in E(x) at a position x0. From the condition of equal diffusion-limited current densities in this regime, we will determine the value of x0. (4) The last possible scenario is that both reactions are controlled kinetically, as depicted in Fig. 2(d); in this case, E(x) is found from the condition jHOR = jORR, using eqn (3) and (4).
Following the distinction of different kinetic regimes for the local current density at the nanoparticle surface, the PEM can be divided into two spatial regions, viz. an anodic region at x < x0, in which jdHOR > jdORR and a cathodic region at x > x0, in which jdHOR < jdORR. In the anodic region, the HOR current is kinetically controlled, whereas the ORR is usually in the diffusion-limited regime. In the cathodic region, the ORR is kinetically controlled, whereas the HOR is usually in the diffusion-limited regime.
If a reaction at the Pt surface is kinetically controlled, the surface concentration of redox species will be equal to the bulk concentrations, i.e. in the anodic region and
  in the cathodic membrane region. For diffusion-limited reactions, we will assume zero surface concentration of the transport-limited reactant, i.e.
 in the anodic region and
  in the cathodic region. As we are interested in obtaining analytical solutions for the potential profile E(x), we will employ modified forms of the Butler–Volmer expressions in eqn (3) and (4), given by
| |  | (5) |
and
| |  | (6) |
In
eqn (5) and (6), we assume

(
ref. 34) and
αcORR = 1.
35,36 In
eqn (5) the sinh-expression for the faradaic current density of the HOR represents a common interpolation.
39 It allows for a continuous description of the HOR rate in the limit of small overpotential,
E(
x) ≤
b/3, where
cH2(
x) ≈
Cref, and high overpotential,
E(
x) ≥ 3
b, where 2sinh[
E(
x)/2
b] ≈ exp[
E(
x)/2
b]. The single term BV-equation for the ORR in
eqn (6) is the standard form, accounting for the irreversible kinetics of the ORR.
We apply the charge balance condition for anodic and cathodic regions in the PEM and at the transition between these regions, to obtain analytical relations for the potential profile. In the anodic region, i.e. for x < x0, we have
Inserting eqn (2) and (5) and solving for E(x) results in
| |  | (8) |
with
| |  | (9) |
Similarly, in the cathodic region of the PEM,
i.e. for
x >
x0, we have
In this case, using eqn (1) and (6) and solving for E(x), gives
| |  | (11) |
with
| |  | (12) |
At
x =
x0, both the current densities of HOR and ORR are controlled by diffusion and, therefore,
which leads to a unique relation between the ratio of the bulk concentrations of the reactant gases at
x0, and the diffusion coefficients,
| |  | (14) |
Eqn (14) can be solved to find
x0 whence the distributions
cO2(
x) and
cH2(
x) are known.
The last possible case is when both current densities of HOR and ORR are controlled by reaction kinetics,
In this scenario, the potential profile is obtained using eqn (5) and (6), giving,
| | 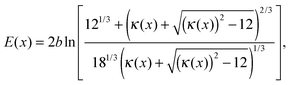 | (16) |
where
| |  | (17) |
Eqn (8), (11) and (16) allow expressing the potential profile in the PEM through the distribution of concentrations,
cH2(
x) and
cO2(
x). In order to obtain the concentrations, we must solve 1D diffusion equations for hydrogen and oxygen in the distinct PEM regions.
We define  as the dimensionless coordinate along the membrane thickness and
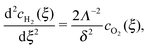
  as the dimensionless position of the potential step. In the anodic region (ξ < ξ0), the reaction–diffusion equation for O2 is
| |  | (18) |
and that for H
2, using
eqn (7), is
| |  | (19) |
with
| |  | (20) |
and
| |  | (21) |
where
nPt is the number of Pt particles per unit PEM volume. The product
Λl represents the dimensional reaction penetration depth of O
2. In the dilute limit of the Pt particle distribution, we have
Λ ≫ 1, and in the dense limit
Λ ≪ 1.
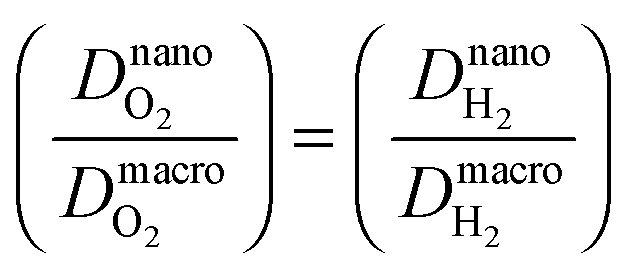
The diffusion coefficients at nanoscale and macroscale are distinguished as the structure and effective transport resistance of the medium is different at the two scales. The macroscale diffusion coefficient corresponds to diffusion in a random composite medium, with randomly mixed resistances due to polymer and water-filled domains. Nanoscale diffusion coefficients, on the other hand, approach the values for water. Therefore, the macroscopic diffusion coefficient will be smaller than the value in water by a factor that incorporates percolation effects. We consider this value as 10 because the diffusion coefficient of H2 and O2 in water40 is one order of magnitude larger than its value in Nafion. This ratio is included in Λ in eqn (21).
Due to the large overpotential for the ORR at the anode, we assume that O2 is completely used up at ξ = 0. The boundary conditions of eqn (18) and (19) are given by
| |  | (22) |
and
| |  | (23) |
The solutions of
eqn (18) and (19), subject to the boundary conditions
(22) and (23), are
| |  | (24) |
and
| |  | (25) |
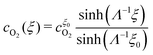
Similarly, in the cathodic region of the PEM (
ξ >
ξ0), the reaction–diffusion equation of H
2 is
| |  | (26) |
and that of O
2, using
eqn (10), is
| |  | (27) |
Here, for simplicity, we assume

, so that
Λ is the same as defined in
eqn (21).
The boundary conditions are
| |  | (28) |
and
| |  | (29) |
The solutions of
eqn (26) and (27) are
| |  | (30) |
and
| |  | (31) |
To obtain the equations for

and

, we apply the continuity condition at
ξ =
ξ0,
| |  | (32) |
Inserting
eqn (25) and (30), we obtain
| |  | (33) |
Similarly, by inserting
eqn (24) and (31) into
eqn (32), we obtain
| |  | (34) |
Eqn (33) and (34) are solved to obtain

and

(see Appendix for the solutions). In the dilute limit of Pt particles, as
Λ ≫ 1,

and

.
Substituting the relations for  and
and  , obtained in the Appendix, into eqn (14) the position of the potential step is found as
| |  | (35) |
It indicates that as the uniform distribution of particles is assumed,
ξ0 is independent of the size and density of particles and only depends on the relevant concentrations of reactant gases at boundaries and the ratio of diffusion coefficients. This result is independent of the particle shape. The effect of particle shape appears in the form of the diffusion limited current densities and as well in
Λ.
ξ0 is obtained by applying the charge balance condition for the limiting current densities of HOR and ORR as given in
eqn (13). In this equation, as the parameters affecting the particle shape are assumed to be the same for HOR and ORR, they cancel out from both sides of the equation for any particle shape. In addition, for a uniform distribution the step position is independent of
Λ, hence of the particle shape.
2.1 Model parameters
Physical properties and constants are listed in Table 1. The adopted values for the macroscale diffusion coefficients correspond to H2 and O2 diffusion in Nafion® 117, evaluated at 100% RH and 60 °C.41 Exchange current densities of the ORR and HOR have been extracted from ref. 36 and 42, respectively.
Table 1 Physical parameters, symbols and values
| Description |
Value |
Ref. |
| Faraday constant, F |
96485 C mol−1 |
|
| Gas constant, R |
8.314 J mol−1 K−1 |
|
| Temperature, T |
333 K |
|
| ORR equilibrium potential, Eeq |
1.23 V |
|
| Reference H2 molar concentration, Cref |
40.88 × 10⁻⁶ mol cm−3 |
38
|
| Reference O2 molar concentration, Cref |
40.88 × 10⁻⁶ mol cm−3 |
38
|
H2 diffusion coefficient in Nafion,  |
1.2 × 10⁻⁵ cm2 s−1 |
41
|
O2 diffusion coefficient in Nafion,  |
2.1 × 10⁻⁶ cm2 s−1 |
41
|
| HOR exchange current density, j0HOR |
0.8 × 10⁻³ A cm−2 |
42
|
| ORR exchange current density, j0ORR |
5.4 × 10⁻¹¹ A cm−2 |
36
|
| Transfer coefficients for HOR, αaHOR = αcHOR |
1/2 |
34
|
| Transfer coefficient for ORR, αcORR |
1 |
35
|
As the molar concentrations of H2 and O2 in Nafion are reasonably small for the relevant partial pressures, we use Henry's law to relate H2 and O2 concentrations at the membrane boundaries to external partial pressures,
| |  | (36) |
with Henry's law constants
HH2 and
HO2 in Nafion.
Substituting eqn (36) into eqn (35), we obtain
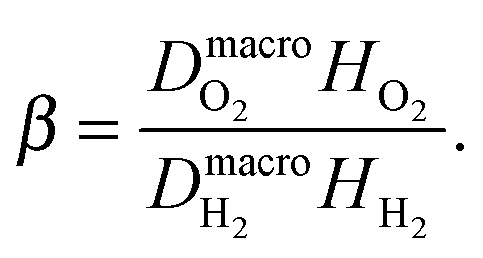
| |  | (37) |
where
| |  | (38) |
The value of
β used in this work is taken from
ref. 25. It is reported as 0.38 ± 0.05, evaluated experimentally in permeability tests of crossover hydrogen and oxygen at 100% RH and 65 °C.
25
The evaluated ranges of parameters are listed in Table 2. The ranges correspond to values of parameters reported in the literature. As a baseline for parametric studies, we consider a membrane with l = 50 μm in which particles with r0 = 150 nm are uniformly distributed with nPt = 5 × 109 cm−3. The range of nPt is estimated based on the amount of Pt in the membrane. Results of electron microscopy-energy dispersive spectroscopy analysis have been used to quantify the amount of Pt transported from cathode to the membrane.25 This study estimates that ≈13% of Pt in the cathode is transported into the membrane following 3000 potential cycles. This amount corresponds to ≈0.38 mg Pt, if we consider a Pt loading of 0.1 mg cm−2 for a 5 × 5 cm membrane. Equivalently, this amount results in a uniform distribution of Pt particles with r0 = 150 nm and nPt ≈ 1010 cm−3 across a membrane with l = 50 μm.
Table 2 Ranges for parameters
| Description |
Value |
H2 pressure at membrane|anode,  , kPa , kPa |
21–125 |
O2 pressure at membrane|cathode,  , kPa , kPa |
21–125 |
| Particle radius, r0, nm |
50–5000 |
| Membrane thickness, l, μm |
25–200 |
| Particle density, nPt, cm−3 |
107–1010 |
3 Results and discussion
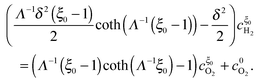
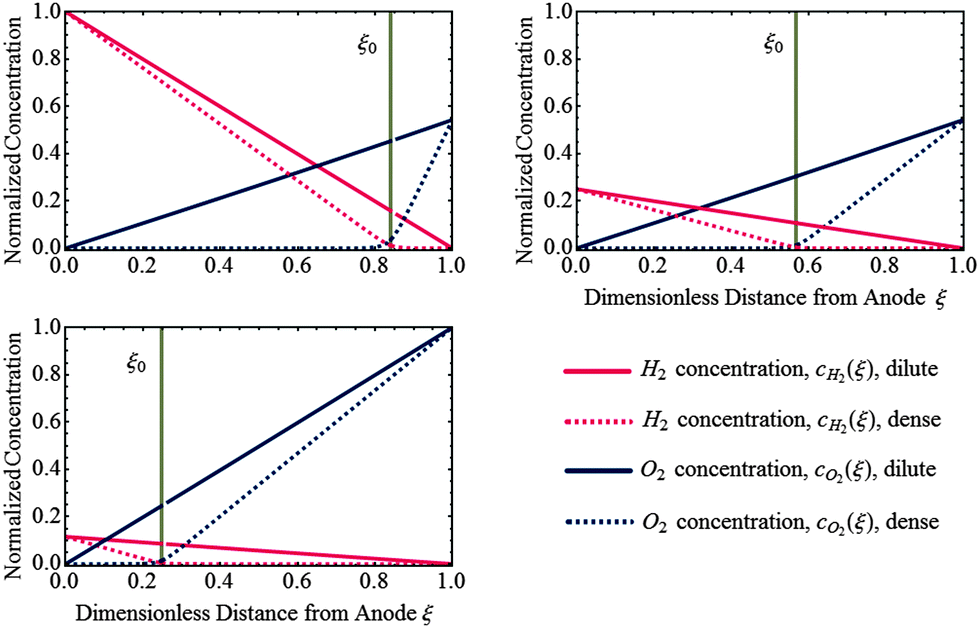
Fig. 3 shows the concentration profiles of H2 and O2 across the PEM and the step position, ξ0, in dilute and dense limit of Pt particles. As shown, the position of ξ0, given by eqn (35) (or (37)), depends on the relative concentrations of reactant gases at the membrane boundaries. The step shifts towards the cathode as  increases relative to
  and vice versa. In the uniform particle distribution regime, ξ0 is independent of Λ, as can be seen from eqn (37).
 |
| | Fig. 3 Analytical solution of concentration profiles of H2 and O2 in dilute limit (Λ ≫ 1) and dense limit (Λ ≪ 1) of uniformly distributed Pt deposits for various relative concentrations of H2 and O2 at the PEM boundaries. The position of potential step, ξ0, is indicated as vertical dashed line which is independent of particle density. | |
As shown in Fig. 3, in the dilute limit of Pt particles, as Λ ≫ 1, the concentration profiles are linear, given by  and
and  (see eqn (24), (25), (30) and (31)). As Λ → 1 concentration profiles deviate from linear curves. According to eqn (18) and (19), nonlinearity occurs when the local rate of reactant consumption is of similar order of magnitude as the rate of reactant flux. In dense limit, as Λ ≪ 1, both concentrations approach to zero at ξ0 which is expected as a trivial solution to eqn (14).
For the case of a dense Pt band formed in the PEM, due to the small rate of transport and high rate of consumption at the position of the dense Pt layer, the concentration of reactants must approach to zero at the band position. In this case, the potential step is found to occur in the vicinity of the band, which is in agreement with experiment.25 The particle deposition process in the membrane is due to repeated oxidation/dissolution and reduction/deposition of the migrated Pt ions by crossover O2 and H2, respectively.28 At x0 optimal conditions are provided for the deposition of particles to form the Pt band.
Fig. 4 shows the potential distribution at spherical Pt particles in the PEM for a uniform distribution with nPt = 1010 cm−3. In Fig. 4(a)–(c), the potential profile in the mixed kinetic regime (see Fig. 2(d) and eqn (16)) is compared to those of mixed “kinetic-diffusion” regimes in the two PEM regions (see Fig. 2(a) and (b), eqn (8) and (11)). The results indicate that for particles with radius smaller than r0 ≈ 125 nm, the transition of ORR from diffusion-limited to kinetically controlled regime occurs at ξ < ξ0. Similarly, for this particle size range, the transition of HOR from diffusion-limited to kinetically controlled regime occurs at ξ > ξ0. In the region between the two dashed lines in Fig. 4(a), both HOR and ORR are controlled by the reaction kinetics. This case is more relevant to Pt in the membrane, as the average PITM size reported in the literature is smaller than 125 nm.43,44 It implies that in the vicinity of the potential step the concentration gradient of the reactants close to the particle surface is negligible as both reactions are kinetically controlled. On the other hand, for particles with radius greater than r0 ≈ 125 nm the transition occurs at ξ0, as shown in Fig. 4(b) and (c) (also see Fig. 2(c) and eqn (14)).
 |
| | Fig. 4 Potential distribution at spherical Pt nanodeposits in the PEM. The graphs shown in (a) to (c) illustrate change in the local reaction regime with increasing size of the Pt nanoelectrode. | |
In Fig. 5(a), the potential profile is plotted as a function of the particle size at a particle density of nPt = 5 × 109 cm−3, for a membrane with thickness of l = 50 μm. As shown, the OCP depends on the particle size, especially close to the step. As the particle size increases the potential decreases in the anodic region and increases in the cathodic region. The OCP change as a function of microelectrode size has been experimentally reported.45 Particle size dependence of potential has also been obtained in the model by Atrazhev et al.33
 |
| | Fig. 5 Analytical solution of the potential distribution at spherical Pt nanodeposits in membrane, for (a) varying particle sizes, (b) varying particle densities, and (c) varying membrane thickness. | |
Fig. 5(b), shows the potential profile for a constant particle size (150 nm) as a function of nPt. As nPt increases, the potential decreases in anodic region and increases in the cathodic region. For a constant particle size and uniform particle distribution, as the PEM thickness increases the potential decreases in the anodic region and increases in the cathodic region, as shown in Fig. 5(c). At ξ0, the value of the potential drop only depends on the particle size. At this position, the ratio of the concentrations of reactant gases is independent of the particle density (see eqn (14)); thus, according to eqn (8) and (11) the potential drop is independent of nPt.
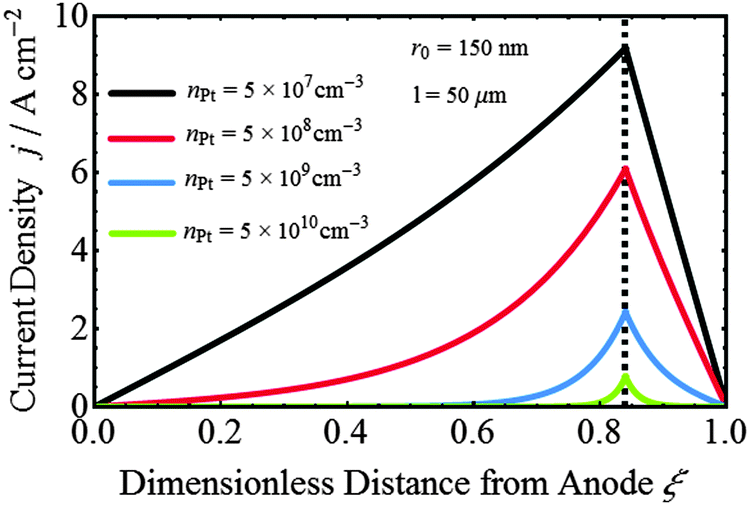
Fig. 6 shows the current density distribution at Pt nanoparticles in the PEM as a function of particle density, corresponding to the potential distribution shown in Fig. 5(b). At ξ < ξ0, the current density increases from zero to a maximum value at ξ0 (see eqn (2)); and at ξ > ξ0 the current density decreases to zero (see eqn (1)). As nPt increases, the local flux becomes smaller due to the higher consumption of crossover gases.
 |
| | Fig. 6 Current density distributions at spherical Pt nanoelectrode calculated in the model, for various values of the particle density, corresponding to the cases depicted in Fig. 5b. | |
Fig. 7 compares the model and experimental data of the potential profile for various partial pressures of H2 and O2. In the experimental measurements of Takaichi et al.,31 seven Pt microelectrode probes, with 30 μm in diameter, were used to measure the OCP determined by H2 and O2 permeating in the PEM. The microelectrodes are sandwiched between eight thin membrane films, 25 μm Nafion® (NRE211, Dupont, 3 × 7 cm), resulting in the total thickness of about 200 μm. H2 at ambient pressure was fed to the anode side. At the cathode side, O2 was held at a partial pressure of 21 kPa, 25 kPa, 101 kPa and 119 kPa. In the experimental study performed by Liu and Zuckerbrod,30 flattened Pt wires with an initial diameter of 25 or 50 μm were used. Two Pt microelectrodes were laminated within a membrane electrode assembly with a dimension of 5 × 5 cm. Three layers of membranes were used. Two 10 μm GORE-SELECT® (GSM) membranes sandwiched a membrane with variable thickness, X. The two microelectrodes were laminated in between the outer 10 μm GORE-SELECT membrane and membrane X, both aligned with the gas inlet region, one close to the cathode and the other close to the anode. The position of the microelectrode area the cathode side was varied by changing the thickness of the membrane X. Both anode and cathode were standard GORE-PRIMEA® Series 5510 electrodes with Pt loadings of 0.4 mg cm−2. H2 and air under 100 kPa pressure were fed to the anode and cathode sides, respectively. The potential at the microelectrodes was measured under OCP conditions at 60 °C.
 |
| | Fig. 7 Comparison between potential distributions and those observed in experiment30,31 for various relative partial pressures of H2 and O2 at the membrane boundaries, as indicated in the graphs. Parameters used in calculations are listed in Tables 1 and 2. | |
To compare our model with the experimental data, we assumed a spherical Pt microelectrode with r0 = 5 μm in a membrane with l = 200 μm and a dilute particle density of nPt = 107 cm−3. For the H2 partial pressure we assumed 100 kPa and for the O2 partial pressure we used the values reported in experiment. The variation in microelectrode shape does not demand a modification of the model; it is merely a parametric effect in the diffusion-limited current densities at the particle surface.37 We use eqn (37) to determine x0 with β = 0.38 for all pressure settings.
The potential shapes calculated from the model are in a very good agreement with values of the potential found in experiment. As shown in Fig. 7, the step-like potential profile is very well reproduced in the model and the dependence of the position of the step to relative partial pressures at membrane boundaries is captured. Discrepancies might be due to a combination of the effect of microelectrode size and shape. Microelectrodes used in the experiments are large compared to the thickness of the membrane; hence, the spatial localization of potential values is relatively imprecise and represents effective values. In contrast, the model predicts the exact local value of the potential at a spherical microelectrode in the PEM. It is required to perform experimental studies with smaller microelectrodes in order to obtain better spatial resolution.
4 Conclusions
We presented an analytical model to determine the potential distribution at spherical Pt nanodeposits in the polymer electrolyte membrane. The approach incorporates a continuum description of crossover fluxes of reactant gases at the macroscale, coupled with the kinetics of electrochemical surface reactions at Pt nanodeposits. The potential distribution is obtained as a function of the local composition of the PEM, which is given by concentrations of H2 and O2 as well as the size and density distribution of Pt particles. In good agreement with experimental data, the model predicts a step-like potential profile. In the anodic region of the PEM, the potential is close to the equilibrium potential of the HOR. In the cathodic region, the potential is closer to the equilibrium potential of the ORR. For a uniform distribution of Pt particles, the position of the step is only determined by the relative partial pressures of H2 and O2 at the membrane interfaces as well as their permeation properties in the PEM. In the future we will use this model to rationalize the balance of species involved in chemical degradation of polymer electrolyte membranes.
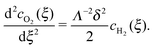
Appendix
In this appendix, the solutions of eqn (33) and (34) for  and
and  are presented. Rewriting the eqn (33) and (34),
| |  | (39) |
 and
and  are given by:
| |  | (40) |
where,| |  | (41) |
| |  | (42) |
| |  | (43) |
| |  | (44) |
| |  | (45) |
| |  | (46) |
Nomenclature
|
F
| Faraday constant, C mol−1 |
|
R
| Gas constant, J mol−1 K−1 |
|
T
| Temperature, K |
|
C
ref
| Reference concentration, mol cm−3 |
|
E
eq
| ORR equilibrium potential, V |
|
H
H2
| Henry's law constant for H2 in Nafion, mol cm−3 kPa−1 |
|
H
O2
| Henry's law constant for O2 in Nafion, mol cm−3 kPa−1 |

| H2 diffusion coefficient at nanoscale, cm2 s−1 |

| O2 diffusion coefficient at nanoscale, cm2 s−1 |

| H2 diffusion coefficient at macroscale, cm2 s−1 |

| O2 diffusion coefficient at macroscale, cm2 s−1 |
|
j
0ORR
| ORR exchange current density, A cm−2 |
|
j
0HOR
| HOR exchange current density, A cm−2 |
|
α
aHOR, αcHOR | Anodic and cathodic transfer coefficients for HOR |
|
α
aORR, αcORR | Anodic and cathodic transfer coefficient for ORR |

| H2 pressure at membrane|anode, kPa |

| O2 pressure at membrane|cathode, kPa |
|
r
0
| Particle radius, nm |
|
n
pt
| Particle density, μm−3 |
|
x
| Dimensional coordinate along PEM thickness, μm |
|
l
| Membrane thickness, μm |
|
ξ
| Dimensionless coordinate along PEM thickness, normalized by PEM thickness |
|
Λ
| Dimensionless reaction penetration depth, normalized by PEM thickness |
Acknowledgements
This research is financially supported by an Automotive Partnership Canada grant and by Ballard Power Systems.
References
- S. D. Knights, K. M. Colbow, J. St-Pierre and D. P. Wilkinson, J. Power Sources, 2004, 127, 127–134 CrossRef CAS PubMed.
- L. Gubler, S. M. Dockheer and W. H. Koppenol, J. Electrochem. Soc., 2011, 158, B755–B769 CrossRef CAS PubMed.
- X. Huang, R. Solasi, Y. Zou, M. Feshler, K. Reifsnider, D. Condit, S. Burlatsky and T. Madden, J. Polym. Sci., Part B: Polym. Phys., 2006, 44, 2346–2357 CrossRef CAS.
- V. O. Mittal, H. R. Kunz and J. M. Fenton, J. Electrochem. Soc., 2007, 154, B652–B656 CrossRef CAS PubMed.
- J. Wu, X. Z. Yuan, J. J. Martin, H. Wang, J. Zhang, J. Shen, S. Wu and W. Merida, J. Power Sources, 2008, 184, 104–119 CrossRef CAS PubMed.
- J. Healy, C. Hayden, T. Xie, K. Olson, R. Waldo, M. Brundage, H. Gasteiger and J. Abbott, Fuel Cells, 2005, 5, 302–308 CrossRef CAS.
- P. Ferreira, Y. Shao-Horn, D. Morgan, R. Makharia, S. Kocha and H. Gasteiger,
et al.
, J. Electrochem. Soc., 2005, 152, A2256–A2271 CrossRef PubMed.
- M. Ghelichi, P.-É. A. Melchy and M. H. Eikerling, J. Phys. Chem. B, 2014, 118, 11375–11386 CrossRef PubMed.
- M. P. Rodgers, B. P. Pearman, L. J. Bonville, D. A. Cullen, N. Mohajeri and D. K. Slattery, J. Electrochem. Soc., 2013, 160, F1123–F1128 CrossRef CAS PubMed.
- N. Ohguri, A. Y. Nosaka and Y. Nosaka, J. Power Sources, 2010, 195, 4647–4652 CrossRef CAS PubMed.
- L. Ghassemzadeh, K.-D. Kreuer, J. Maier and K. Müller, J. Phys. Chem. C, 2010, 114, 14635–14645 CAS.
- M. Aoki, H. Uchida and M. Watanabe, Electrochem. Commun., 2005, 7, 1434–1438 CrossRef CAS PubMed.
- M. Aoki, H. Uchida and M. Watanabe, Electrochem. Commun., 2006, 8, 1509–1513 CrossRef CAS PubMed.
- A. Ohma, S. Suga, S. Yamamoto and K. Shinohara, ECS Trans., 2006, 3, 519–529 CAS.
- D. Zhao, B. Yi, H. Zhang and M. Liu, J. Power Sources, 2010, 195, 4606–4612 CrossRef CAS PubMed.
- N. Hasegawa, T. Asano, T. Hatanaka, M. Kawasumi and Y. Morimoto, ECS Trans., 2008, 16, 1713–1716 CAS.
- S. Helmly, B. Ohnmacht, R. Hiesgen, E. Gülzow and K. A. Friedrich, ECS Trans., 2013, 58, 969–990 CrossRef CAS PubMed.
- N. Macauley, L. Ghassemzadeh, C. Lim, M. Watson, J. Kolodziej, M. Lauritzen, S. Holdcroft and E. Kjeang, ECS Electrochem. Lett., 2013, 2, F33–F35 CrossRef CAS PubMed.
- N. Macauley, A. S. Alavijeh, M. Watson, J. Kolodziej, M. Lauritzen, S. Knights, G. Wang and E. Kjeang, J. Electrochem. Soc., 2015, 162, F98–F107 CrossRef CAS PubMed.
- H. Hagihara, H. Uchida and M. Watanabe, Electrochim. Acta, 2006, 51, 3979–3985 CrossRef CAS PubMed.
- M. P. Rodgers, L. J. Bonville, H. R. Kunz, D. K. Slattery and J. M. Fenton, Chem. Rev., 2012, 112, 6075–6103 CrossRef CAS PubMed.
- T. Madden, D. Weiss, N. Cipollini, D. Condit, M. Gummalla, S. Burlatsky and V. Atrazhev, J. Electrochem. Soc., 2009, 156, B657–B662 CrossRef CAS PubMed.
- F. De Bruijn, V. Dam and G. Janssen, Fuel Cells, 2008, 8, 3–22 CrossRef CAS.
- V. Berejnov, Z. Martin, M. West, S. Kundu, D. Bessarabov, J. Stumper, D. Susac and A. P. Hitchcock, Phys. Chem. Chem. Phys., 2012, 14, 4835–4843 RSC.
- W. Bi, G. E. Gray and T. F. Fuller, Electrochem. Solid-State Lett., 2007, 10, B101–B104 CrossRef CAS PubMed.
- T. Akita, A. Taniguchi, J. Maekawa, Z. Siroma, K. Tanaka, M. Kohyama and K. Yasuda, J. Power Sources, 2006, 159, 461–467 CrossRef CAS PubMed.
- K. Yasuda, A. Taniguchi, T. Akita, T. Ioroi and Z. Siroma, Phys. Chem. Chem. Phys., 2006, 8, 746–752 RSC.
- L. Kim, C. G. Chung, Y. W. Sung and J. S. Chung, J. Power Sources, 2008, 183, 524–532 CrossRef CAS PubMed.
- G. Diloyan, M. Sobel, K. Das and P. Hutapea, J. Power Sources, 2012, 214, 59–67 CrossRef CAS PubMed.
- W. Liu and D. Zuckerbrod, J. Electrochem. Soc., 2005, 152, A1165–A1170 CrossRef CAS PubMed.
- S. Takaichi, H. Uchida and M. Watanabe, Electrochem. Commun., 2007, 9, 1975–1979 CrossRef CAS PubMed.
- M. Ohishi, Y. Okano, Y. Ono, A. Ohma, K. Fushinobu and K. Okazaki, Int. J. Heat Mass Transfer, 2012, 55, 7213–7217 CrossRef CAS PubMed.
- V. Atrazhev, N. Erikhman and S. Burlatsky, J. Electroanal. Chem., 2007, 601, 251–259 CrossRef CAS PubMed.
- W. Sheng, H. A. Gasteiger and Y. Shao-Horn, J. Electrochem. Soc., 2010, 157, B1529–B1536 CrossRef CAS PubMed.
- D. Sepa, M. Vojnovic and A. Damjanovic, Electrochim. Acta, 1981, 26, 781–793 CrossRef CAS.
- P. D. Beattie, V. I. Basura and S. Holdcroft, J. Electroanal. Chem., 1999, 468, 180–192 CrossRef CAS.
-
A. J. Bard and L. R. Faulkner, Electrochemical Methods: Fundamentals and Applications, Wiley and Sons, Hoboken, 2nd edn, 2001 Search PubMed.
- H. Ju, C.-Y. Wang, S. Cleghorn and U. Beuscher, J. Electrochem. Soc., 2005, 152, A1645–A1653 CrossRef CAS PubMed.
-
M. M. Mench, Fuel cell engines, John Wiley & Sons, 2008 Search PubMed.
-
E. L. Cussler, Diffusion: mass transfer in fluid systems, Cambridge university press, 2009 Search PubMed.
- P. Gode, G. Lindbergh and G. Sundholm, J. Electroanal. Chem., 2002, 518, 115–122 CrossRef CAS.
- K. Neyerlin, W. Gu, J. Jorne and H. A. Gasteiger, J. Electrochem. Soc., 2007, 154, B631–B635 CrossRef CAS PubMed.
- S. Helmly, R. Hiesgen, T. Morawietz, X.-Z. Yuan, H. Wang and K. A. Friedrich, J. Electrochem. Soc., 2013, 160, F687–F697 CrossRef CAS PubMed.
- F. Ettingshausen, J. Kleemann, M. Michel, M. Quintus, H. Fuess and C. Roth, J. Power Sources, 2009, 194, 899–907 CrossRef CAS PubMed.
- J. H. Park, H. Zhou, S. J. Percival, B. Zhang, F.-R. F. Fan and A. J. Bard, Anal. Chem., 2013, 85, 964–970 CrossRef CAS PubMed.
|
| This journal is © the Owner Societies 2015 |
Click here to see how this site uses Cookies. View our privacy policy here. 
 Open Access Article
 This Open Access Article is licensed under a Creative Commons Attribution-Non Commercial 3.0 Unported Licence
 at x = 0 (anode side) and
  at x = l (cathode side). At the nanoscale, the hydrogen oxidation reaction (HOR), H2 ↔ 2H+ + 2e−, and the oxygen reduction reaction (ORR), O2 + 4H+ + 4e− → 2H2O proceed at the surface of Pt nanoparticles, which we assume spherical. As Pt nanoparticles are not connected to an electron source/sink, the resulting OCP must fulfill a condition that the rates of HOR and ORR processes are balanced at the particle level.

 and
and  are the diffusion coefficients of H2 and O2 at the nanoscale, respectively.

 ,
,  and
and  are surface concentrations of H2 and O2, respectively, and CRef = 40.88 × 10⁻⁶ mol cm−3 is a reference concentration.38 It corresponds to the O2 concentration at standard conditions. αa and αc are the anodic and cathodic electron transfer coefficients, j0HOR and j0ORR are the exchange current densities of HOR and ORR, and Eeq is the equilibrium potential of ORR (vs. RHE). R and T are the gas constant and temperature, respectively.
 in the anodic region and
  in the cathodic membrane region. For diffusion-limited reactions, we will assume zero surface concentration of the transport-limited reactant, i.e.
 in the anodic region and
  in the cathodic region. As we are interested in obtaining analytical solutions for the potential profile E(x), we will employ modified forms of the Butler–Volmer expressions in eqn (3) and (4), given by

 (ref. 34) and αcORR = 1.35,36 In eqn (5) the sinh-expression for the faradaic current density of the HOR represents a common interpolation.39 It allows for a continuous description of the HOR rate in the limit of small overpotential, E(x) ≤ b/3, where cH2(x) ≈ Cref, and high overpotential, E(x) ≥ 3b, where 2sinh[E(x)/2b] ≈ exp[E(x)/2b]. The single term BV-equation for the ORR in eqn (6) is the standard form, accounting for the irreversible kinetics of the ORR.


 as the dimensionless coordinate along the membrane thickness and
  as the dimensionless position of the potential step. In the anodic region (ξ < ξ0), the reaction–diffusion equation for O2 is


 , so that Λ is the same as defined in eqn (21).


 and
and  , we apply the continuity condition at ξ = ξ0,


 and
and  (see Appendix for the solutions). In the dilute limit of Pt particles, as Λ ≫ 1,
  and
and  .
.
 and
and  , obtained in the Appendix, into eqn (14) the position of the potential step is found as


 , kPa
, kPa , kPa
, kPa increases relative to
  and vice versa. In the uniform particle distribution regime, ξ0 is independent of Λ, as can be seen from eqn (37).
 and
and  (see eqn (24), (25), (30) and (31)). As Λ → 1 concentration profiles deviate from linear curves. According to eqn (18) and (19), nonlinearity occurs when the local rate of reactant consumption is of similar order of magnitude as the rate of reactant flux. In dense limit, as Λ ≪ 1, both concentrations approach to zero at ξ0 which is expected as a trivial solution to eqn (14).


 and
and  are presented. Rewriting the eqn (33) and (34),
 and
and  are given by: