
 Open Access Article
 This Open Access Article is licensed under a
 Creative Commons Attribution 3.0 Unported Licence
Optical extinction efficiency measurements on fine and accumulation mode aerosol using single particle cavity ring-down spectroscopy
Michael I.
Cotterell
a,
Bernard J.
Mason
a,
Thomas C.
Preston
b,
Andrew J.
Orr-Ewing
a and
Jonathan P.
Reid
*a
aSchool of Chemistry, University of Bristol, Bristol, BS8 1TS, UK. E-mail: j.p.reid@bristol.ac.uk
bDepartment of Atmospheric and Oceanic Sciences and Department of Chemistry, McGill University, 805 Sherbrooke Street West, Montreal, QC H3A 0B9, Canada
First published on 21st May 2015
Abstract
A new experiment is presented for the measurement of single aerosol particle extinction efficiencies, Qext, combining cavity ring-down spectroscopy (CRDS, λ = 405 nm) with a Bessel beam trap (λ = 532 nm) in tandem with phase function (PF) measurements. This approach allows direct measurements of the changing optical cross sections of individual aerosol particles over indefinite time-frames facilitating some of the most comprehensive measurements of the optical properties of aerosol particles so far made. Using volatile 1,2,6-hexanetriol droplets, Qext is measured over a continuous radius range with the measured Qext envelope well described by fitted cavity standing wave (CSW) Mie simulations. These fits allow the refractive index at 405 nm to be determined. Measurements are also presented of Qext variation with RH for two hygroscopic aqueous inorganic systems ((NH4)2SO4 and NaNO3). For the PF and the CSW Mie simulations, the refractive index, nλ, is parameterised in terms of the particle radius. The radius and refractive index at 532 nm are determined from PFs, while the refractive index at 405 nm is determined by comparison of the measured Qext to CSW Mie simulations. The refractive indices determined at the shorter wavelength are larger than at the longer wavelength consistent with the expected dispersion behaviour. The measured values at 405 nm are compared to estimates from volume mixing and molar refraction mixing rules, with the latter giving superior agreement. In addition, the first single-particle Qext measurements for accumulation mode aerosol are presented for droplets with radii as small as ∼300 nm.
I. Introduction
Aerosol can interact directly with solar radiation, perturbing how much solar energy reaches the Earth's surface. Knowledge of the complex refractive index (RI), m, is central to determining the scattering and absorption cross sections of aerosol particles and the collective impact of the aerosol ensemble on radiative forcing; the magnitude of the real component, n, influences the scattering of light, whereas the imaginary component, k, quantifies light absorption. Atmospheric aerosols also affect climate indirectly by acting as cloud condensation nuclei (CCN), impacting on the size, composition and lifetime of clouds.1 Quantifying the equilibrium partitioning of water between an aerosol particle and the gas phase, and the condensational growth that results as the relative humidity increases, is critical in describing the size distribution and composition of atmospheric aerosol. The primary motivation for the work presented here is to report the development of a new technique for reducing the uncertainties associated with the direct interaction of light with aerosol. The extinction cross section of a particle, σext, has contributions from the scattering cross section, σsca, and the absorption cross section, σabs.2 The ratio of σext to the geometric cross section σgeo is referred to as the extinction efficiency, Qext.Ensemble cavity ring-down spectroscopy (E-CRDS) is a well-established technique used routinely in the measurement of Qext for aerosol particles with sub-micron radii.3–5 E-CRDS involves measuring Qext by studying the extinction of light by a collection of hundreds to thousands of particles introduced into an optical cavity formed by two highly reflective mirrors at a separation of ∼1 m. In laboratory measurements, the cloud of particles is generated using an atomiser before some degree of size selection is performed prior to admitting the aerosol to the optical cavity. Rudich and co-workers reported studies of absorbing aerosols using E-CRDS at a variety of visible and UV wavelengths.4,6,7 By fitting Mie theory scattering simulations to their measured Qext trends, the authors reported trends in both the real and imaginary components of the RI. Mellon et al. measured Qext for a range of spherical and non-spherical aerosol particles at a wavelength of 1520 nm using an E-CRDS technique.8 Meanwhile, Mason et al. used E-CRDS to study the size and relative humidity (RH) dependence of Qext for sodium nitrate particles, and assessed the limitations inherent to E-CRDS.3 Most importantly, although size selection is commonplace in the E-CRDS experiments described in the literature, some inevitable polydispersity in size will remain which can be difficult to characterise. For all the drawbacks of E-CRDS, it has proven to be a robust technique that can be used in either the laboratory or the field, and is used routinely to probe aerosol with sub-micron radii from ∼500 nm down to ∼100 nm, i.e. the size regime bearing most atmospheric relevance in terms of loading and light extinction.
Studying a single particle, instead of an ensemble, by combining CRDS with an independent, nanometre-resolution method for determining particle size should improve the accuracy of Qext measurements. Further, to satisfy the needs of the atmospheric research community, any new technique for measuring Qext should retain the ability to study sub-micron particles. The motivation for studying aerosol in this regime is to reduce the uncertainty associated with the influence of aerosol on Earth's radiative balance.9 The variations of σext, σgeo and Qext with radius for spherical water droplets (n = 1.335 at λ = 532 nm) are well known.2 Importantly, the Qext curve peaks at approximately 500 nm radius, highlighting the need to perform measurements in the sub-micrometre regime.
The application of new techniques for the isolation and characterisation of single aerosol particles is crucial in understanding aerosol processes at a fundamental level.10 Well established techniques include electrodynamic balances11,12 and optical tweezers,13,14 both of which are limited to confining single particles larger than 2–5 μm in radius. We have previously shown that a zeroth-order Bessel laser beam (BB)15–17 optical trap can be used in the measurement of single particle processes, such as evaporation and hygroscopic response, for particle radii ranging from ∼5 μm to as small as ∼350 nm.18–21 Our experience has shown that BBs can be used to trap particles smaller than 350 nm, but the size of these particles cannot be determined reliably using visible light. Illuminating a particle with the core of a BB will result in a radiation pressure force acting on the particle, while optical gradient forces act in transverse directions to retain the particle within the core. For stable confinement, the radiation pressure force may be balanced by a second counter-propagating BB, although the stability of the alignment for such a system is poor.18,22–24 Instead, we have opted for a more robust and versatile method using a counter-propagating gas flow, which exerts a Stokes drag force on a particle and renders all forces balanced.19,20,25
We have recently demonstrated that optical extinction measurements on single particles can be made using a BB (λ = 532 nm) to control the position of a single aerosol particle within a CRD beam.20,25,26 By observing how the presence of a particle in the centre of the CRD beam changes the rate of decay of light from the high finesse optical cavity formed by two highly reflective mirrors, σext values for aerosols have been determined at a laser wavelength of 532 nm. In tandem with size determination from angular light scattering measurements, the variation of Qext was measured for the simple case of slowly evaporating 1,2,6-hexanetriol droplets25 and for the more complicated case of hygroscopic growth of sodium chloride droplets.20 Not only does optical confinement of a single particle remove the assumptions inherent in E-CRDS measurements and improve the size determination accuracy, but it also allows the same single particle to be studied over a long period of time. This latter advantage permits the optical cross section to be studied as a particle changes size or composition due to, for example, the evaporation of semi-volatile species, the uptake of water if the RH in the chamber increases, or even the chemical transformation accompanying heterogeneous aging.
Our previous publications20,25 are based on experiments using a CRD beam wavelength of 532 nm, which was chosen in part for experimental convenience but also because it is close to the measured maximum in the solar spectrum at sea level. Measurements were limited to particles with radii larger than ∼750 nm, outside the atmospherically-relevant accumulation mode regime (<500 nm). It is important that the range of wavelengths for which Qext is measured is extended to the UV and IR regions of the spectrum, to assess the impact of aerosols on the radiative balance at these wavelengths, and that measurements be made for accumulation mode particles. At shorter wavelength and, thus, larger size parameter, the number of features in a Qext resonance spectrum increases, improving the accuracy with which RI determinations can be made. At longer wavelengths (towards the IR region), water begins to absorb significantly, possibly allowing the effect of the imaginary RI component on the Qext spectrum to be explored. Further, our previous studies for hygroscopic growth of aerosols containing inorganic species did not report independent fits of the RI, but instead employed the parameterisations of Tang and Munkelwitz. Although providing a validation of previous results, this approach did not represent a strategy for determining the optical properties and hygroscopic response of aerosol of completely unknown RI and composition.27
The purpose of this publication is many fold. A new experiment is presented: although broadly similar to our single particle 532 nm CRDS apparatus detailed previously,20,25 CRDS measurements are performed at a wavelength of 405 nm allowing us to quantify the dispersion in RI between 532 and 405 nm. This new set-up is benchmarked by determination of Qext variation for 1,2,6-hexanetriol droplets; comparison with cavity standing wave (CSW) Mie theory calculations allows the constant RI of hexanetriol at λ = 405 nm to be extracted. Further, we describe a new method of fitting both the angular variation in elastically scattered light and the CRDS data for hygroscopic growth measurements to determine the RI of aerosol particles directly with no prior assumptions. Subsequently, CRDS measurements and RI determinations for the hygroscopic growth of ammonium sulfate and sodium nitrate droplets are presented. The resulting independent determinations of RI as a function of RH are compared with previous literature parameterisations, in addition to volume fraction and molar refraction mixing rules. Finally, using the previously described 532 nm CRDS apparatus20,25 with a reduced BB core, the first single particle measurements of Qext for droplets with radii as small as ∼250 nm are reported.
II. Experimental
The experimental apparatus for the 532 nm CRDS system has been described elsewhere;20,25 the new 405 nm CRDS system is similar in design, and is described here and summarised in Fig. 1. The beam from a 35 mW, single mode 405 nm diode laser (IQ Series, Power Technology Incorporated) was passed through an acousto-optic modulator (AOM, Brimrose) which split the beam into a series of diffraction spots. The first order diffraction spot was selected and injected into an optical cavity, while the zeroth and higher order spots were directed into a beam dump. The optical cavity was constructed from two highly reflective mirrors (Layertec) with reflectivities greater than 99.96% at 405 nm and radii of curvature of 1 m, separated by a distance of 0.8 m. One mirror was mounted on a piezo ring actuator (Piezomechanik), driven with a triangular waveform of amplitude 20 V at a fixed frequency in the range 10–20 Hz. Build-up of light inside the cavity was monitored using a photodiode (RedWave Labs, D101), and the intensity escaping the cavity was measured as an output voltage which was sent to both a Compuscope 12-bit digitizer (GaGe, Octopus CS8222) and a digital delay generator (Quantum Composers, Sapphire 9200). The digital delay generator sent a 5 V TTL pulse to the AOM when the voltage reached a pre-selected threshold, causing the first order diffraction beam from the AOM to extinguish, hence initiating a ring-down decay.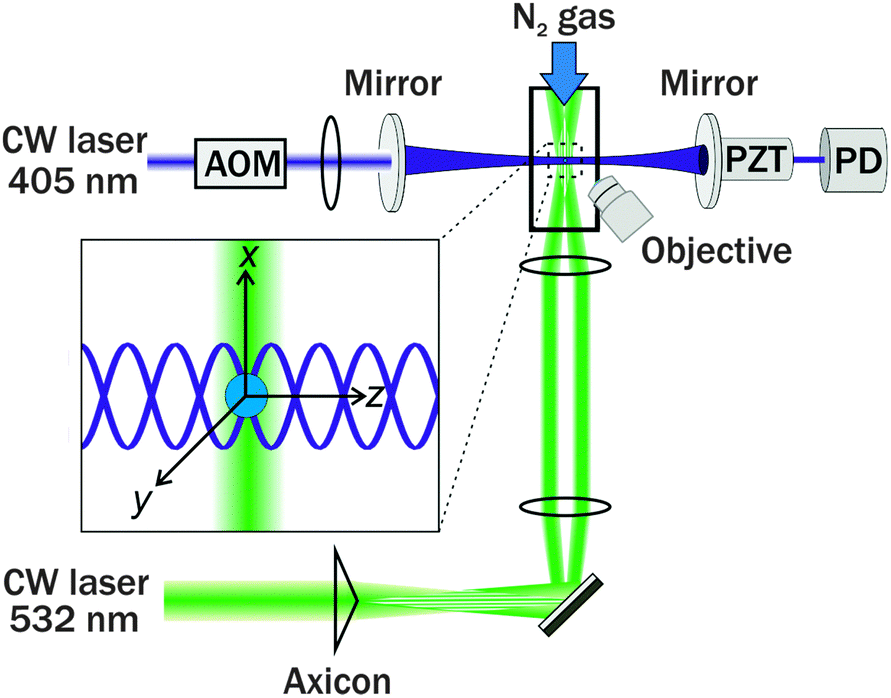 | ||
| Fig. 1 Schematic diagram of the apparatus used to perform CRDS on single aerosol particles optically trapped in a BB. AOM is an acousto-optic modulator, PZT is a piezoelectric transducer, PD is a photodiode. The inset defines the coordinate system used in CSW Mie theory calculations and shows a particle confined in a BB core intersected with the intra-cavity standing wave. | ||
To reduce the impact of light scattering by airborne dust particles on ring-down times (RDTs) and to prevent the mirrors getting dirty, nitrogen gas purge flows were directed across the faces of the cavity mirrors and through flow tubes which extended from the mirror faces to the trapping cell at the centre of the cavity. The cavity was aligned such that the TEM00 mode was preferentially excited; as a result, higher order modes with lower coupling efficiencies, and hence lower amplitude ring-down events, could be discriminated against in the data collection. The subsequent TEM00 mode ring-down traces of photodiode voltage (V) vs. time (t) were fitted to a single exponential function of the form V = V0![[thin space (1/6-em)]](https://www.rsc.org/images/entities/char_2009.gif) exp(−t/τ) + b where b accounts for any baseline offset, and τ is the RDT, which was recorded at a rate of between 5 and 10 Hz. In the case of the empty cavity purged with N2 gas, this RDT is denoted τ0, and typically has a value of 14.5 ± 0.5 μs depending on the cleanliness of the two cavity mirrors and their alignment, although remains constant over the course of a measurement with a typical standard deviation <0.1 μs.
exp(−t/τ) + b where b accounts for any baseline offset, and τ is the RDT, which was recorded at a rate of between 5 and 10 Hz. In the case of the empty cavity purged with N2 gas, this RDT is denoted τ0, and typically has a value of 14.5 ± 0.5 μs depending on the cleanliness of the two cavity mirrors and their alignment, although remains constant over the course of a measurement with a typical standard deviation <0.1 μs.
A 532 nm Gaussian laser beam (Laser Quantum 2W Opus) was passed through a 2° axicon (Altechna) to produce a Bessel beam. Immediately after the axicon, the BB core diameter was measured to be 55 μm, which is too large to trap micron-sized aerosol particles.18 Hence, a pair of lenses was used to reduce the core diameter to ∼5.5 μm. This beam was propagated vertically into the trapping cell using a 45° mirror. The mirror and the trapping cell were mounted on a translation stage. The radiation pressure exerted by this vertically propagating BB on a trapped particle was balanced by a humidified nitrogen gas flow of 100–200 sccm, the RH of which could be controlled. This gas flow was also used to purge the cell of excess aerosol. The RH inside the trapping cell was monitored using a capacitance probe (Honeywell). A camera coupled to a 20× long working distance objective with a numerical aperture (NA) of 0.42 was used to capture the angular variation of elastically scattered light (phase function) with s-polarisation from a single trapped aerosol particle. Aerosol particles were introduced into the cell via a medical nebuliser (Omron). If multiple particles were trapped, the trapping cell was evacuated and aerosol was again nebulised into the cell. This process was repeated until only a single particle was trapped.
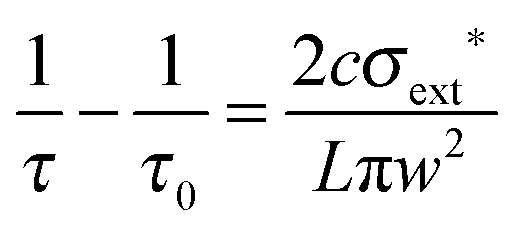
Once a single aerosol particle was optically trapped, its position was optimised to obtain a minimum in the measured RDTs. The position could be tuned in both transverse directions to the CRD beam, in the vertical direction by changing the laser power and in the horizontal direction by scrolling the translation stage on which the trapping cell was mounted. When the particle was centred in the CRD beam, laser feedback control was initiated to keep the particle in the centre over the course of the measurement, and RDTs were collected for the particle in the CRD beam, denoted by τ. Typically, the power of the laser required modulating between 400 and 2000 mW over the course of an experiment, depending on the size and composition range of the droplet levitated. From measured τ and τ0 values, the optical cross section was calculated using eqn (1), in which L is the cavity length, c is the speed of light and w is the CRD beam waist.20,28
 | (1) |
| σext* = ζ(m,a,z0)σext | (2) |
Once the optical cross section has been determined, the radius of the particle must be measured to calculate Qext. The radius of the particle is determined from the phase function (PF) image, which is analysed to give the one dimensional relative intensity distribution with scattering angle. This distribution is affected not only by particle radius but also by the RI of the particle. Measuring the angular variation in the scattered intensity and simulating the measured distribution using Mie theory provides a method of obtaining the particle size and RI, even for sub-micron aerosol particles.31
III. Optical extinction measurements for 1,2,6-hexanetriol droplets
To benchmark the experiment and assess its capability, it is important to measure σext* for a spherical particle of constant composition (RI) over a continuous size range and determine whether the data can be described using CSW Mie theory. Hexanetriol is a semi-volatile organic compound that is relatively non-hygroscopic, particularly when compared to the water uptake of inorganic species such as sodium chloride in high RH environments. Although having no atmospheric relevance, it serves as an ideal system to benchmark our experiment, and has been studied extensively in previous work.19,20,25,26 A hexanetriol droplet was optically trapped at low RH (<10%), and its position in the CRD beam optimised. The RDTs and PFs were subsequently measured over ∼2 hours as the particle evaporated.The radius, a, and constant RI of a droplet were determined from the PFs by comparing to a computed library of Mie-theory simulated PFs over a defined radius range for a constant value of the real component of the RI, n532. The Pearson correlation coefficient, C, between each of the simulated and measured PFs was calculated. For each measured PF, the simulation with the highest correlation defined the best-fit radius of the particle for the corresponding value of n532. Once the radii were determined for all the measured PFs in an entire data set, the mean correlation coefficient ![[C with combining macron]](https://www.rsc.org/images/entities/i_char_0043_0304.gif) is calculated for the value of n532 of the first iteration before varying n532 in a stepwise manner. Note that is defined as the arithmetic mean of the collection of Pearson correlation coefficients calculated for the entire data set for the particular trial value of n532. Then, by identifying the n532 that yielded the maximum calculated over the full range of trial values of n532, the best-fit constant RI for hexanetriol was determined.
is calculated for the value of n532 of the first iteration before varying n532 in a stepwise manner. Note that is defined as the arithmetic mean of the collection of Pearson correlation coefficients calculated for the entire data set for the particular trial value of n532. Then, by identifying the n532 that yielded the maximum calculated over the full range of trial values of n532, the best-fit constant RI for hexanetriol was determined.
The radius data for 10 such measurements are shown in Fig. 2(a); the largest droplet was initially trapped at a radius of 2140 nm, and the smallest droplet evaporated to a size of 725 nm. The inset shows how the mean correlation coefficient, , between the experimental and simulated PFs varies with n532 for one of the droplets (plotted using red data points). For this particular droplet, the best fit n532 peaks at ∼1.481; the average determined RI for all 10 droplets is 1.477 ± 0.004 where the error represents one standard deviation. This value of n532 for hexanetriol is consistent with previous measurements using either single aerosol particle CRDS (1.4782 ± 0.0007)25 at 532 nm, or a combination of radiation pressure and PF measurements (1.482 ± 0.001).19 We will now focus on the particle that has been highlighted in more detail.
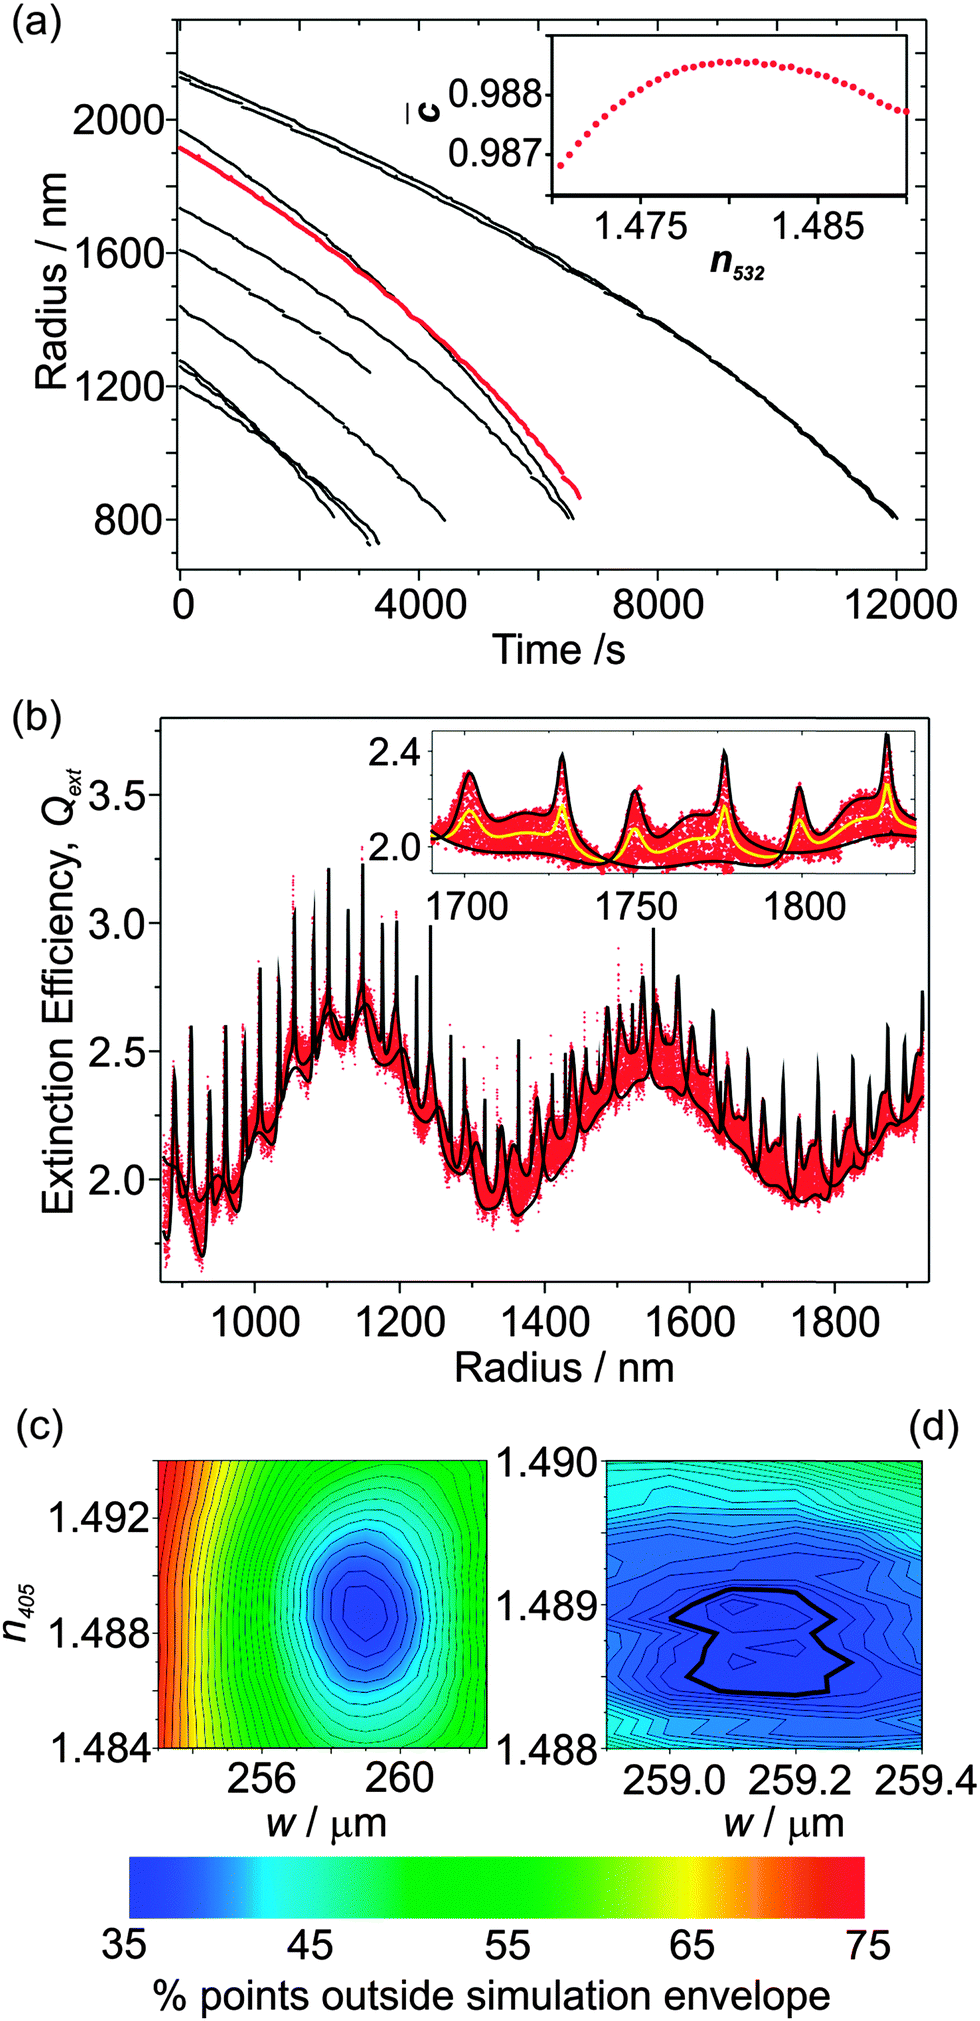 | ||
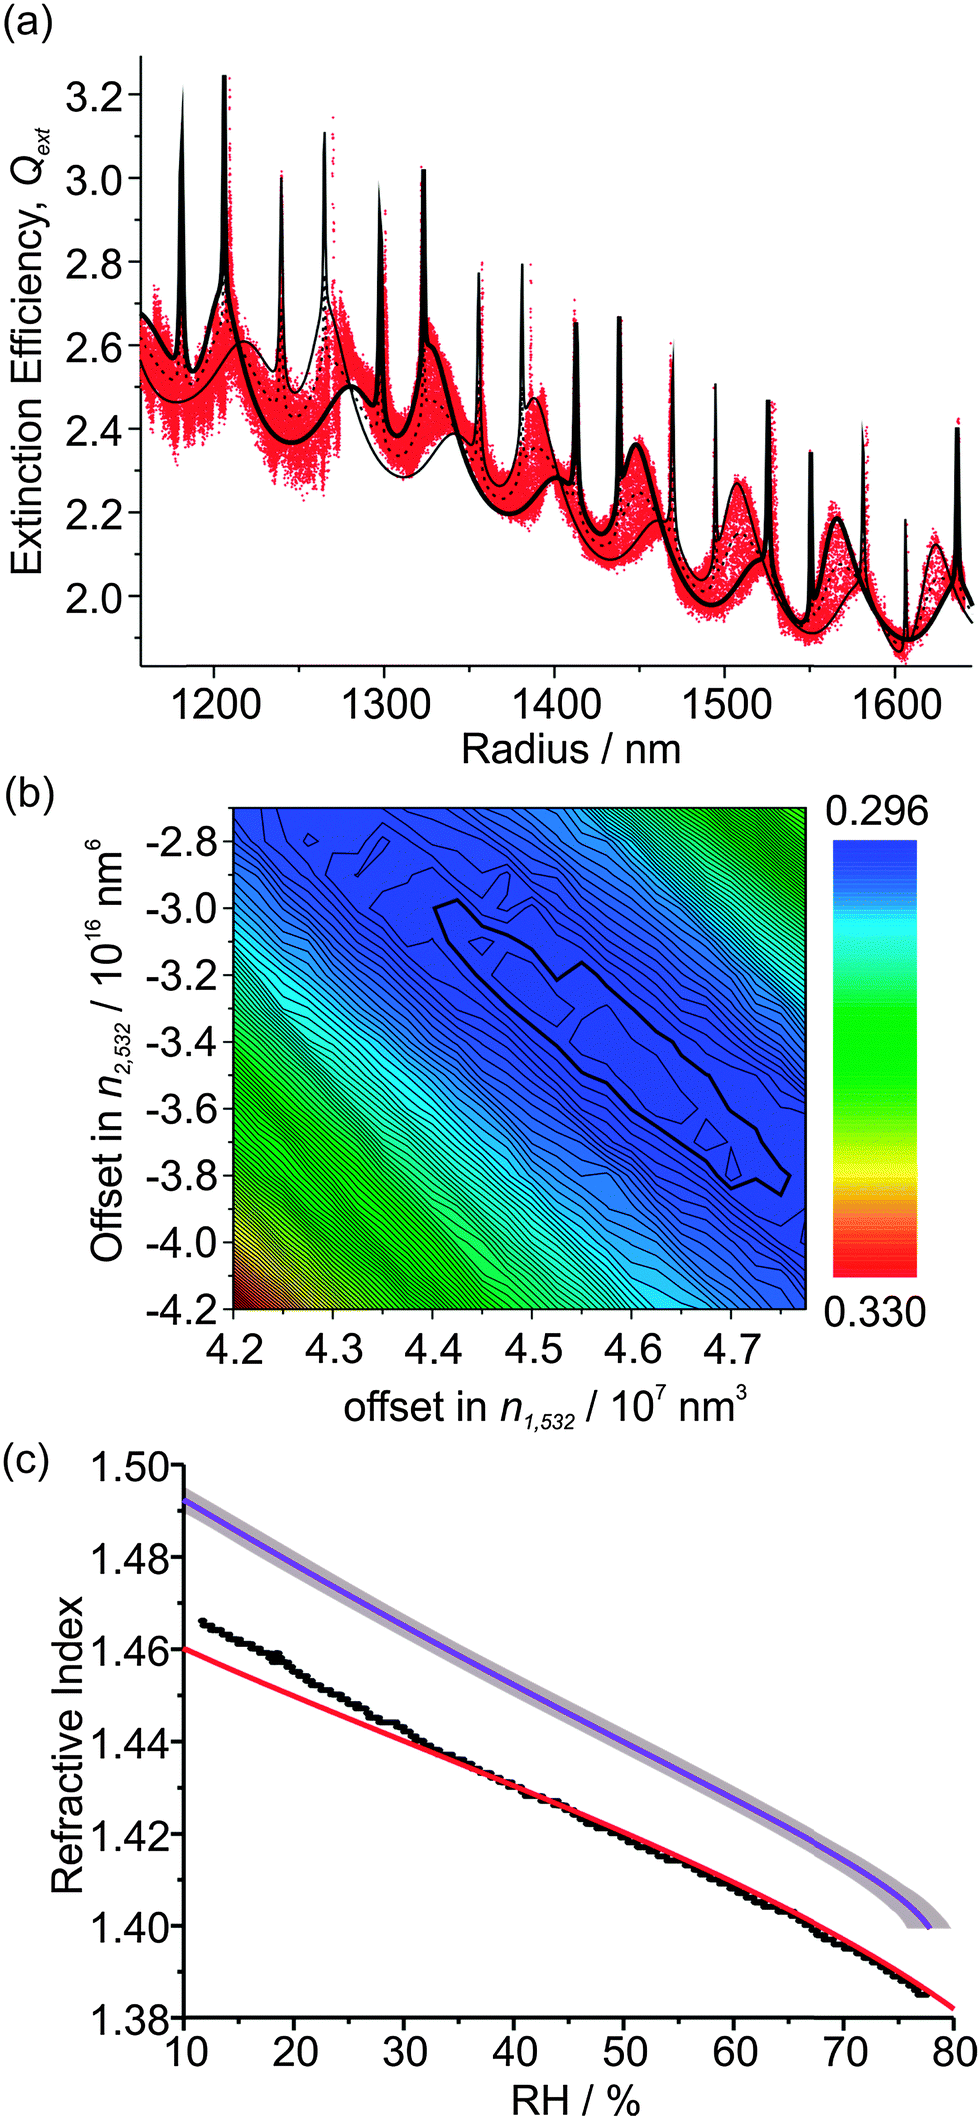
| Fig. 2 (a) The measured radius vs. time for ten 1,2,6-hexanetriol droplets. The inset shows the mean correlation coefficient, , between the measured and simulated PFs as a function of n532 for the radius data plotted with red data points. (b) The measured Qext for the radius data plotted in red in (a), along with the best fit CSW Mie simulation. The inset shows an expanded portion, highlighting the good agreement between the boundaries in the measured Qext and the CSW Mie simulations, along with a conventional Mie simulation (solid yellow line). (c) A contour plot of the percentage of points outside the CSW Mie simulation envelope as a function of the two fitting parameters, n405 and w. (d) An expanded portion of the contour plot in (c). | ||
Fig. 2(b) shows the Qext values inferred from the CRDS measurements at 405 nm as a function of particle radius, with the radius and geometric cross section determined from the PF measurements. The CSW Mie simulations of Qext are performed for the two limiting cases of the particle centred at a node and anti-node. These simulations depend on the RI at 405 nm; although n532 is known from the PF fitting, n405 is not known but can be determined by varying it as a fit parameter. In addition, the CRDS beam waist is varied, which has the effect of scaling the measured Qext data to larger or smaller values (i.e., an amplitude shift in Qext) as would be expected after inspection of eqn (1). We define a residual as the fraction of the measured Qext points that fall outside the simulation envelope, and this residual is minimised by varying w and n405. Accordingly, Fig. 2(b) shows the best fit CSW Mie theory simulations for the limiting node and anti-node cases. The inset to Fig. 2(b) shows an expanded portion of these Qext data accompanied with a conventional Mie theory simulation (solid yellow line). This inset emphasises how the measured Qext data are broadened by the impact of the cavity standing wave, with the Qext being scaled in equal proportion to higher and lower values about this Mie theory curve. It also emphasises how well the CSW Mie theory simulations describe the boundaries of this broad Qext envelope. Note that in previous publications where both the PF and the CRD data were measured at the same wavelength (532 nm), the droplet radius was scaled using an empirical formula when the RI was varied to correct for using an inaccurate RI in the PF fitting.25 This method cannot be used here because the PF and CRD data are measured at different wavelengths. Nonetheless, the agreement in the peak positions between the measured Qext data and the CSW Mie simulations is remarkable, indicating that the radius determination from the PF fitting is more accurate than for our previous single particle CRDS measurements.25
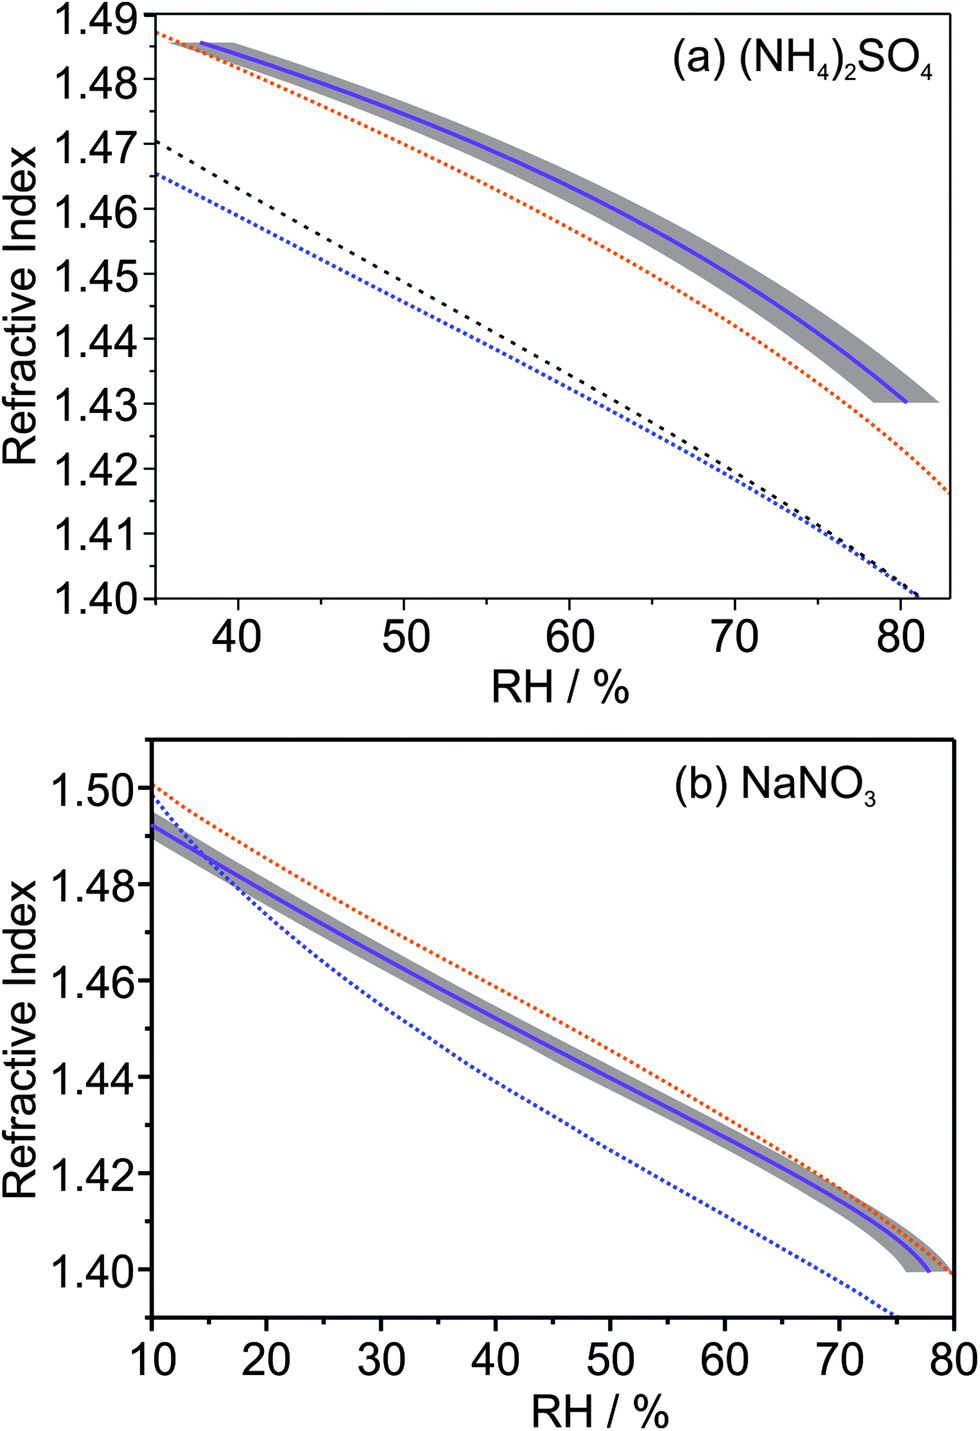
Fig. 2(c) shows a contour plot of the residual variation with n405 and w used in the CSW Mie simulations, with a region where the residual is minimised. Fig. 2(d) shows an expanded portion of this contour plot in which a finer grid search was performed. In this expanded portion, local minima can be seen because of the noise inherent in the measured Qext data. The best fit is defined as the midpoint of the contour where the residual rises above the baseline noise (shown by the thicker line in the figure). The best fit has 34.5% of points lying outside the simulated envelope, and gives w = 259.15 ± 0.2 μm and n405 = 1.48875 ± 0.0005. Note that only the real component of the RI is varied, and k is set to zero. The determined beam waist is in good agreement with the prediction of 253 μm obtained using theory for symmetrical resonators.29 The large value for the minimum in the residual is due to large contributions where the envelope in Qext narrows; where the CSW Mie simulations for the limiting node and anti-node cases cross, there is scatter in Qext deriving from noise in both τ and τ0.
Each of the radius-time data sets in Fig. 2(a) has corresponding RDT data, which were analysed to determine w and n405 for all 10 particles. The mean value of n405 is 1.4906 ± 0.0012, while the mean value of w is 264.4 ± 4.4 μm, where the errors represent one standard deviation in the measured values. The former mean value is in good agreement with previous determinations of n405 for hexanetriol using radiation pressure measurements, which gave a value of 1.485 ± 0.006.19 The percentage error in w is much larger than that in n405, which is expected; from one day to the next, the cavity alignment can drift and needs re-alignment. The measured n405 values are larger than the n532 values measured from the PFs and those reported previously by Mason and co-workers (1.4782 ± 0.0007), in accordance with the dispersion trends exhibited by most substances.25 Further, both the n405 and n532 values are higher than refractometer (Misco, Palm Abbe II) measurements which give a bulk RI of 1.4758 at a wavelength of 589.6 nm.
IV. Fitting refractive index for hygroscopic inorganic species
The analysis of the PF and RDT data for hexanetriol was relatively straightforward: each droplet has a composition (and hence RI) that does not change over time, assuming the RH remains constant at 0%. In this section, we look at measurements and the analysis of the PF and RDT data for hygroscopic inorganic salts as the ambient RH is varied. A changing RH results in the condensation or evaporation of water from a hygroscopic droplet. As a consequence, both the size and composition of the droplet change, leading to a size dependent RI. An aqueous inorganic salt solution with a typical solute concentration of 100 g L−1 was nebulised into the trapping cell, and a single aqueous droplet optically trapped in the BB core at a high RH (>70%). The position of the droplet was optimised until it was located at the centre of the λ = 405 nm CRD beam. The PFs and RDTs were collected while the RH was lowered steadily over time. In the following sections, we initially describe our PF fitting strategy for the determination of both radius and RI for hygroscopic growth measurements before demonstrating the ability to retrieve the RI at wavelengths of 405 nm and 532 nm for ammonium sulfate and sodium nitrate aerosol droplets. Finally, we test common literature mixing rules to assess their validity in predicting the variations of RI with relative humidity.IV. a Strategy for fitting PFs for hygroscopic growth measurements
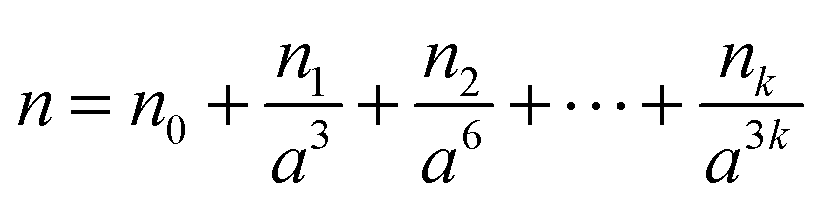
Previous radius determinations from PFs in the literature used either a fixed RI, or modelled a varying RI by linking the composition of a particle to its radius or the RH of the surrounding environment19,20 using the parameterisations of Tang and Munkelwitz.27 However, with recent improvements in the acquisition of PFs (in particular, noise reduction), as well as computational advances in fitting the PFs to Mie theory, we are now in a position to fit both the RI and the particle radius.32 In principle, a suitable approach to characterising a trapped particle is to find values of a and n that maximise the correlation between experimental and simulated PFs. In practice, even when a particle is homogeneous and spherical, this method yields best-fits that contain high uncertainties. Typically, the poor quality of the fits is noticeable when the analysis is applied to a series of PFs measured under experimental conditions where both a and n should change slowly over time. When these measurements are fitted and the results are plotted as a function of time, both a and n can be scattered and contain discontinuities that are contrary to the expectation that their change over time should be smooth. Needless to say, analysis and interpretation of these types of data are difficult.To reduce, or perhaps eliminate, the above problem, an alternative fitting scheme is implemented here. For a PF data set acquired for one droplet over a long time frame, the Pearson correlation coefficient C is maximised with respect to a over the whole data set, constraining the relationship between radius and n by the equation:
 | (3) |
across an entire set of PFs (for experiments performed here, there will typically be several thousand PFs in a data set). Maximised correlation coefficients between experimental and simulated PFs are found by fixing n1, n2,…,nk across all PFs and varying a in fitting each individual PF in the set. The resulting set of maximised correlation coefficients is then used to calculate for the chosen parameter set and represents one point on the k-dimensional space formed by n1, n2,…,nk. The goal is to find the point in this space that maximizes and, in this work, a grid-search is used to accomplish this task.33 After each calculation of , one of the parameters n1, n2,…,nk is incremented using a chosen step size and is calculated once more. This process is repeated until a maximum in the correlation coefficient is located. The point in the k-dimensional grid that maximises corresponds to the best-fit values for parameters n1, n2,…,nk (the values of a for each PF are found during the calculation of for this point). During testing, this method was found to reduce both noise and discontinuities in a and n. Note that the quality of the fits is also found to improve when both the lower and upper values of the angular range for the measured PFs are allowed to vary for each individual PF by 1.5° to account for changes in the computer-determined positions of the droplet edges during image processing.
When the particle radius is infinitely large (i.e. at infinite RH or dilution of solutes), eqn (3) simplifies to n = n0; thus n0 corresponds to the RI value for a pure water droplet, which is 1.335 at 532 nm. The terms n and n0, n1, n2,…,nk are wavelength dependent and will be denoted as nλ, n0,λ, n1,λ, n2,λ,…,nk,λ from this point forward. The nk,λ values will vary from one experiment to another depending on the mass of solute in the droplet, while the number of terms required to model accurately the RI will also vary, although typically only n1,λ and n2,λ are required. Initial ranges are set for n1,532 (typically between 0 and 1 × 10⁹ nm3 for radii < 2 μm) and n2,532 (between −3 and 3 × 10¹⁸ nm6), with n1,532 optimised initially while n2,532 is set to zero. is determined for every iteration of n1,532, with the highest corresponding to the optimum value of n1,532. Next, n2,532 is varied with n1,532 set to its optimum value. After these initial optimisations, refining grid search cycles are performed with the steps in the grid search being reduced by 50% after every search cycle.
IV. b Hygroscopic growth measurements for ammonium sulfate
Our initial discussion focuses on a hygroscopic growth measurement for an ammonium sulfate droplet, which was trapped at ∼80% RH; the ambient RH was subsequently lowered to ∼38%, at which point the droplet fell out of the trap following crystallisation. Fig. 3(a) shows how changes as n1,532 (red squares) and n2,532 (blue circles) are varied during their initial optimisation stages. The values for the n2,532 optimisation stage are higher as a result of n1,532 having been optimised, and n2,532 representing a small perturbation of the curve in n532/a−3 space. Fig. 3(b) shows the final radius-time determination (after the refining grid search cycles) corresponding to = 0.9701, accompanied by the variation in the RH over the measurement. The inset shows the final, best-fit RI curve as a function of a−3, and the impact of the variation of the n2,532 term can be clearly seen by the curvature in this plot. The values of n1,532 and n2,532 for this particular droplet are 8.84 × 10⁸ nm3 and −2.12 × 10¹⁸ nm6 respectively. Note that a small perturbation from a third-order term, n3,532, was also applied with a value of 2.00 × 1027 nm9 in order to refine further the RI description. The uncertainties in these values are difficult to quantify. However, we show later that the determined RI description behaves as expected when compared to parameterisations by Tang et al.27,34 The radius-time data decrease smoothly with very little experimental noise, and only exhibit a couple of discontinuities in the droplet radius, each with a magnitude of <5 nm. The low noise and smooth variation in the radius suggest that the improvements in the PF acquisition and subsequent Mie theory fitting procedure have resulted in better-quality radius determination compared to other published determinations from PFs of sub-2 μm droplets.19,20,35
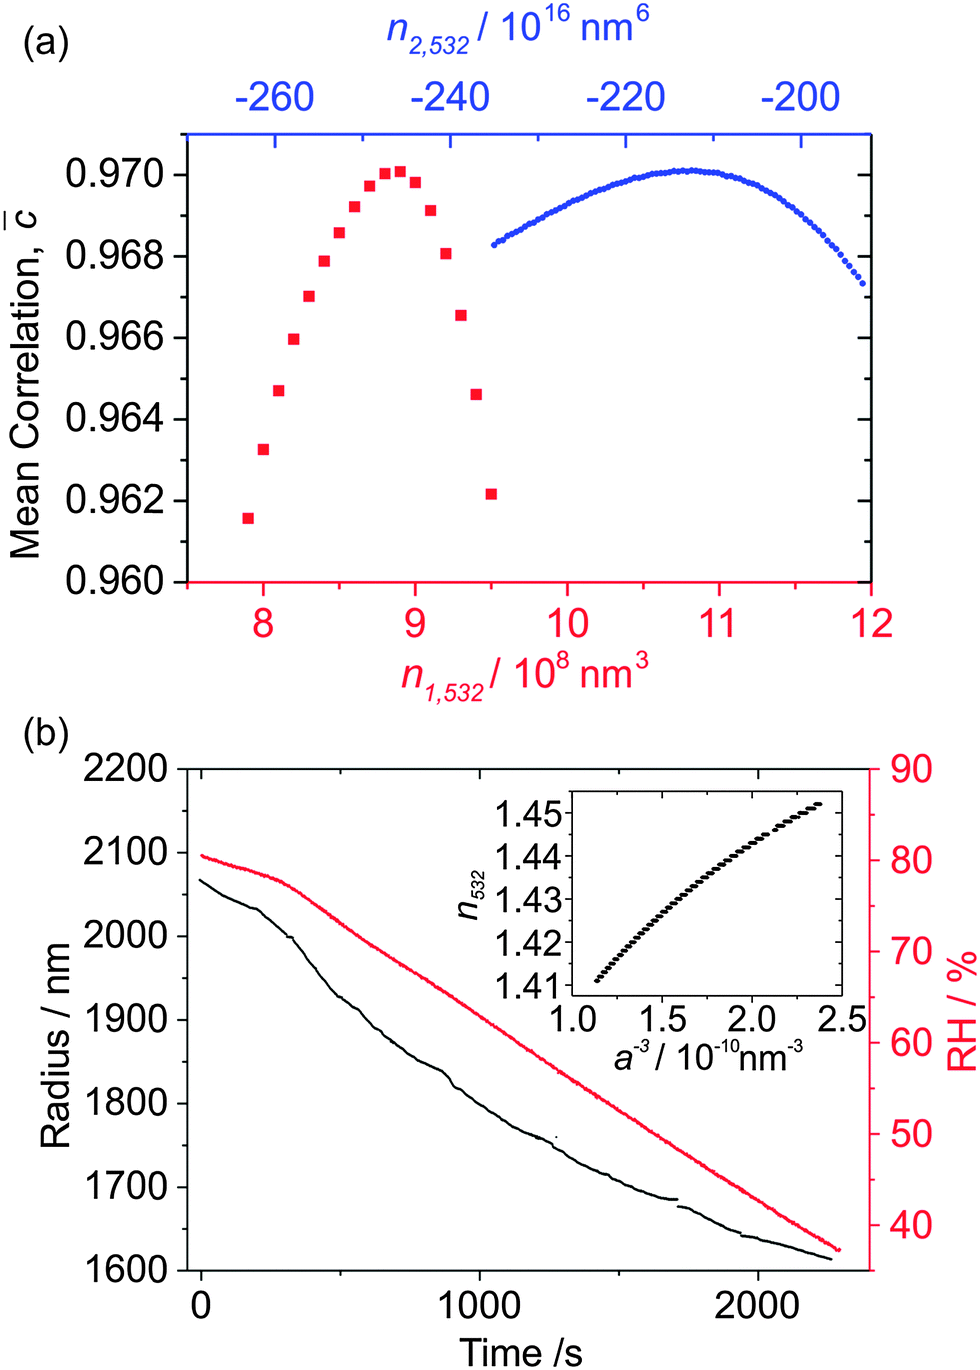 | ||
| Fig. 3 (a) The mean correlation, , as a function of n1,532 (red squares) and n2,532 (blue circles) during the initial stages of their optimisation through PF fitting for a hygroscopic growth measurement of ammonium sulfate. (b) The measured RH vs. time and determined radius vs. time for the ammonium sulfate droplet in (a). The inset shows how the determined RI at 532 nm varies with a−3. | ||
Now the radius of the particle has been determined, Qext may be calculated from the RDT data for a trial beam waist, which will later be treated as a fitting parameter. Knowing for certain the droplet size, simulating the Qext data with CSW Mie theory allows a retrieval of the variation in n405 with particle radius, leading to direct measurements of the dispersion in RI. We generate another expression of the form of eqn (3), but instead of using a value of n0,532 = 1.335, we now fix the RI of water to the known value of n0,405 = 1.343.36 Further, instead of fitting n1,405 and n2,405, we use:
 | (4) |
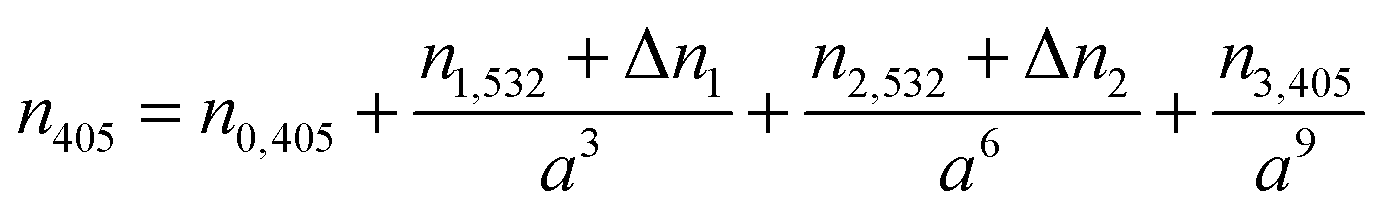
Unlike the experiments involving hexanetriol, as the RH variation is not perfectly linear in hygroscopic growth measurements (particularly evident at the beginning of the measurement in Fig. 3(b)), the ‘density’ of the measured Qext data points is not uniform in the radius domain. To ensure there is no bias in the fitting of CSW Mie simulations to higher density regions of Qext data, the values of Qext are collected into 1 nm bins and each point that falls outside the envelope is weighted by dividing by its associated bin's number count. The result of the fitting of CSW Mie theory simulations to the Qext data is shown in Fig. 4(a). Not only is there excellent agreement in the resonance peak positions of the measured Qext and CSW Mie simulations (further indicating accurate size determination of the droplet from PF analysis), but there is also a good description of the underlying contour of the data (indicating good determination of the variation in n405 over the measurement).
 | ||
| Fig. 4 (a) The measured Qext variation with particle radius for the hygroscopic growth of the (NH4)2SO4 droplet in Fig. 3 (red data points) and best-fit CSW Mie simulations (black lines). (b) Contour plot of the dependence of the residual on Δn1 and Δn2. (c) RH dependence of n532 (black data points) and n405 (purple line), with a comparison to the parameterisation of Tang et al. (λ = 633 nm, red line).27,34 The red envelope shows the uncertainty in n405 resulting from uncertainties in Δn1 and Δn2. The larger grey envelope shows the uncertainty caused by uncertainty in the RH measurement. The inset shows an expanded portion of these envelopes. | ||
Fig. 4(b) shows a contour plot of the residual in terms of Δn1 and Δn2, which exhibits a definite minimum, with several local minima resulting from noise in the Qext data. The values of Δn1 and Δn2 corresponding to a minimum in the residual are (0.95 ± 0.03) × 108 nm3 and (4.4 ± 0.2) × 1016 nm6,17 respectively, with uncertainties determined by the distance to the contour where the residual rises above the baseline noise. Note that the well in the residual is diagonal in shape, implying that Δn1 and Δn2 are inversely correlated, while the uncertainties in Δn1 and Δn2 may also be correlated. In a similar way, w is found to be 251.5 ± 0.5 μm.
The parameterisation of the variation of n532 and n405 with RH may be of value for applications in environmental research. Therefore, polynomial fits to the measured n405 and n532 variation with water activity, aw, used eqn (5), where Ci are polynomial coefficients, the values of which are reported in Table 1:
 | (5) |
| (NH4)2SO4 | NaNO3 | |||
|---|---|---|---|---|
| λ = 532 nm | λ = 405 nm | λ = 532 nm | λ = 405 nm | |
| C 0 | 1.476 | 1.526 | 1.481 | 1.504 |
| C 1 | −9.748 × 10⁻² | −1.547 × 10⁻¹ | −1.166 × 10⁻¹ | −9.947 × 10⁻² |
| C 2 | 1.501 × 10⁻¹ | 2.032 × 10⁻¹ | −1.233 × 10⁻¹ | −2.184 × 10⁻¹ |
| C 3 | −1.621 × 10⁻¹ | −1.973 × 10⁻¹ | 3.490 × 10⁻¹ | 4.973 × 10⁻¹ |
| C 4 | — | — | −2.613 × 10⁻¹ | −3.482 × 10⁻¹ |
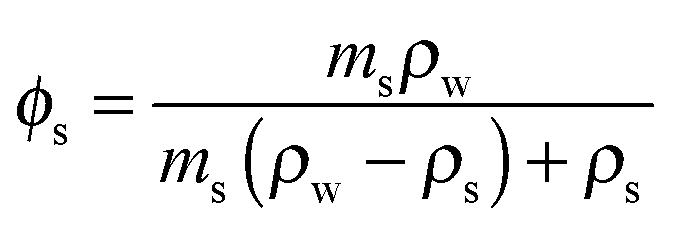
The uncertainties quoted in Δn1 and Δn2 allow the uncertainty envelope in n405 to be calculated. When parameterising n405 in the RH domain, these uncertainties in Δn1 and Δn2 are negligible when compared to the errors associated with the RH measured (±2%). This point is emphasised in Fig. 4(c) which shows the dependence of n405 (purple solid line) and n532 (black data points) on RH. The narrow red envelope represents the uncertainty in n405 if we only consider the errors obtained by fitting the Qext data, while the broad grey envelope takes into account the uncertainty in the RH probe measurement. Clearly, the ±2% uncertainty in the RH probe measurement is the dominant source of error in any RI–RH parameterisation. A comparison is also made to the parameterisation of Tang et al. (red solid line) determined at a wavelength of 632.8 nm.27,34 The measured n532 curve from the PF measurements is shifted towards higher RI compared to the Tang parameterisation, while the n405 curve is shifted towards higher RI relative to n532 (as expected given typical wavelength dispersion behaviour). Further, the separation between the n405 and n532 curves increases as the RH is lowered and the droplet composition tends to that of the solute, which is also expected given the higher chromatic dispersion of inorganic salts compared to water.
IV. c Hygroscopic growth measurements for sodium nitrate
Sodium nitrate aerosol is another atmospherically relevant system; NaNO3 particles form by the reaction of sea salt aerosol with nitric acid and NOx, and can impact the radiative forcing in marine environments.37 There is ongoing debate over the hygroscopic properties and the RH at which NaNO3 droplets effloresce, with Gysel et al. not observing any efflorescence at RHs as low as ∼6% using an ensemble technique.38 Thus, single NaNO3 droplets were confined within a Bessel laser beam and placed into the centre of our 405 nm CRD beam for the measurement of Qext with variations in RH.Fig. 5(a) shows the measured Qext variation with radius for one droplet which fell from the trap at ∼12% RH, although the particle loss may not be a consequence of efflorescence. Instead, the combination of both the small size of the droplet and its RI may have rendered the forces acting on it too weak for stable trapping. The measured Qext is again very well described by CSW Mie theory. Both the resonance peak positions and the underlying contour of the Qext curve agree well with the CSW Mie simulations. This agreement is indicative of correct size determination of the particle by PF analysis at 532 nm, as well as good determination of the variation of n532 and n405 with changing RH. The values of n1,532, n2,532 and n3,532 for this particular droplet are 2.28 × 10⁸ nm3, −3.28 × 10¹⁶ nm6 and 1.20 × 1025 nm9 respectively. The values of Δn1 and Δn2 corresponding to the minimum in the contour plot of Fig. 5(b) are (4.48 ± 0.03) × 107 nm3 and (−3.2 ± 0.1) × 1016 nm17 respectively. Fig. 5(c) compares the n532 determined from our measurement with Tang's parameterisation (λ = 633 nm), with an expected shift in n532 towards higher RI not observed.27 Further, the n405 variation with RH is displaced to higher values compared to the n532 curve, as expected. The similarity in the n532 and n633 curves suggests that the refractive index dispersion is a weak function of wavelength until the blue region of the spectrum is reached. Again, a polynomial was fitted to the measured n405 and n532 variation with water activity using eqn (5), and the coefficients are presented in Table 1 along with those for (NH4)2SO4.
 | ||
| Fig. 5 (a) The measured Qext variation with particle radius for the hygroscopic growth of a NaNO3 droplet (red data points) and best-fit CSW Mie simulations (black lines). (b) Contour plot of the dependency of the residual on Δn1 and Δn2. (c) The determined RH dependence of n532 (black data points) and n405 (purple line), with a comparison to the parameterisation of Tang et al. (λ = 633 nm, red line).27,34 The large grey envelope shows the uncertainty caused by uncertainty in the RH measurement. | ||
IV. d Comparison of determined RIs with literature mixing rules
Fig. 6 summarises the variation of n405 with RH for both the (NH4)2SO4 and NaNO3 droplets studied (purple solid lines). These variations can be compared with predictions from refractive index mixing rules, with the two most common being the volume fraction weighting and the molar refraction methods. The volume fraction mixing rule is widely encountered,39,40 and uses a volume fraction weighting of the pure solute, ns, and pure water, nw, RIs as shown in eqn (6) where ϕs is the volume fraction of solute.| n = ϕsns + (1 − φs)nw | (6) |
 | ||
| Fig. 6 Comparison of predictions from mixing rules with the measured n405 variation with RH (solid purple line) for (a) ammonium sulfate and (b) sodium nitrate. The grey envelopes show a ±2% uncertainty in the RH probe measurement. The dashed orange lines show the predictions of the molar refraction mixing rule, while the dashed blue lines show the conventional volume fraction mixing rule predictions, taking n405 of water to be 1.343 and n405 for the pure, inorganic liquid melt to be equal to the corresponding C0 value in Table 1. The densities of the pure, inorganic melt are described using the model of Clegg and Wexler.41 The dashed black line in (a) shows the prediction of the volume fraction mixing rule when the crystalline ammonium sulfate density (1.769 g cm−3) is used with the ADIENT value of n405 (1.54) for pure ammonium sulfate.43 | ||
The volume fraction of solute can be calculated from the mass fraction of solute, ms, provided the densities of the pure solute, ρs, and pure water, ρw, are known.
 | (7) |
The molar refraction mixing rule uses a mole fraction, x, weighting of the molar refraction, R, as described by eqn (8) and (9) where M is the molecular mass.39
| R = xsRs + (1 − xs)Rw | (8) |
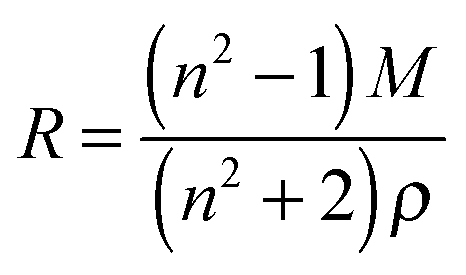 | (9) |
IV. e Further investigation of sodium nitrate's behaviour at low (<10%) RH
In this section, we demonstrate that sodium nitrate aerosol does not always effloresce at low (< 10%) RH. The reproducibility in Qext can therefore be studied by cycling the RH between high (>60%) and low values, which is of particular interest at low RH because the viscosity of sodium nitrate aerosol might reach appreciably high values. Thus, another aqueous NaNO3 droplet was subjected to detailed study, although in this instance the CRDS data were acquired at a wavelength of 532 nm using the apparatus described in previous publications.20,25,26 As shown in the inset of Fig. 7(a), the trapping cell RH was initially at ∼75% and was subsequently lowered and then held at an RH of ∼2% for ∼40 minutes. Over this measurement period, size determination from the PFs was reasonable (also shown in the inset to the figure) albeit with ∼20 nm jumps in the particle radius at regular intervals, and the droplet radius steadily reduced. During the ∼40 minute period at low RH, the droplet did not undergo efflorescence and remained trapped, with the size of the droplet stable. The RH was increased to high (∼66%) RH, and then back to low RH to investigate the possibility that there might be hysteresis in the droplet's RDT and Qext data, in particular at the high viscosities anticipated at low RH. The cycling of the RH also allows us to examine the reproducibility in the determination of the optical properties of the aerosol. The resulting RDT values are shown as a function of time in the main panel of Fig. 7(a).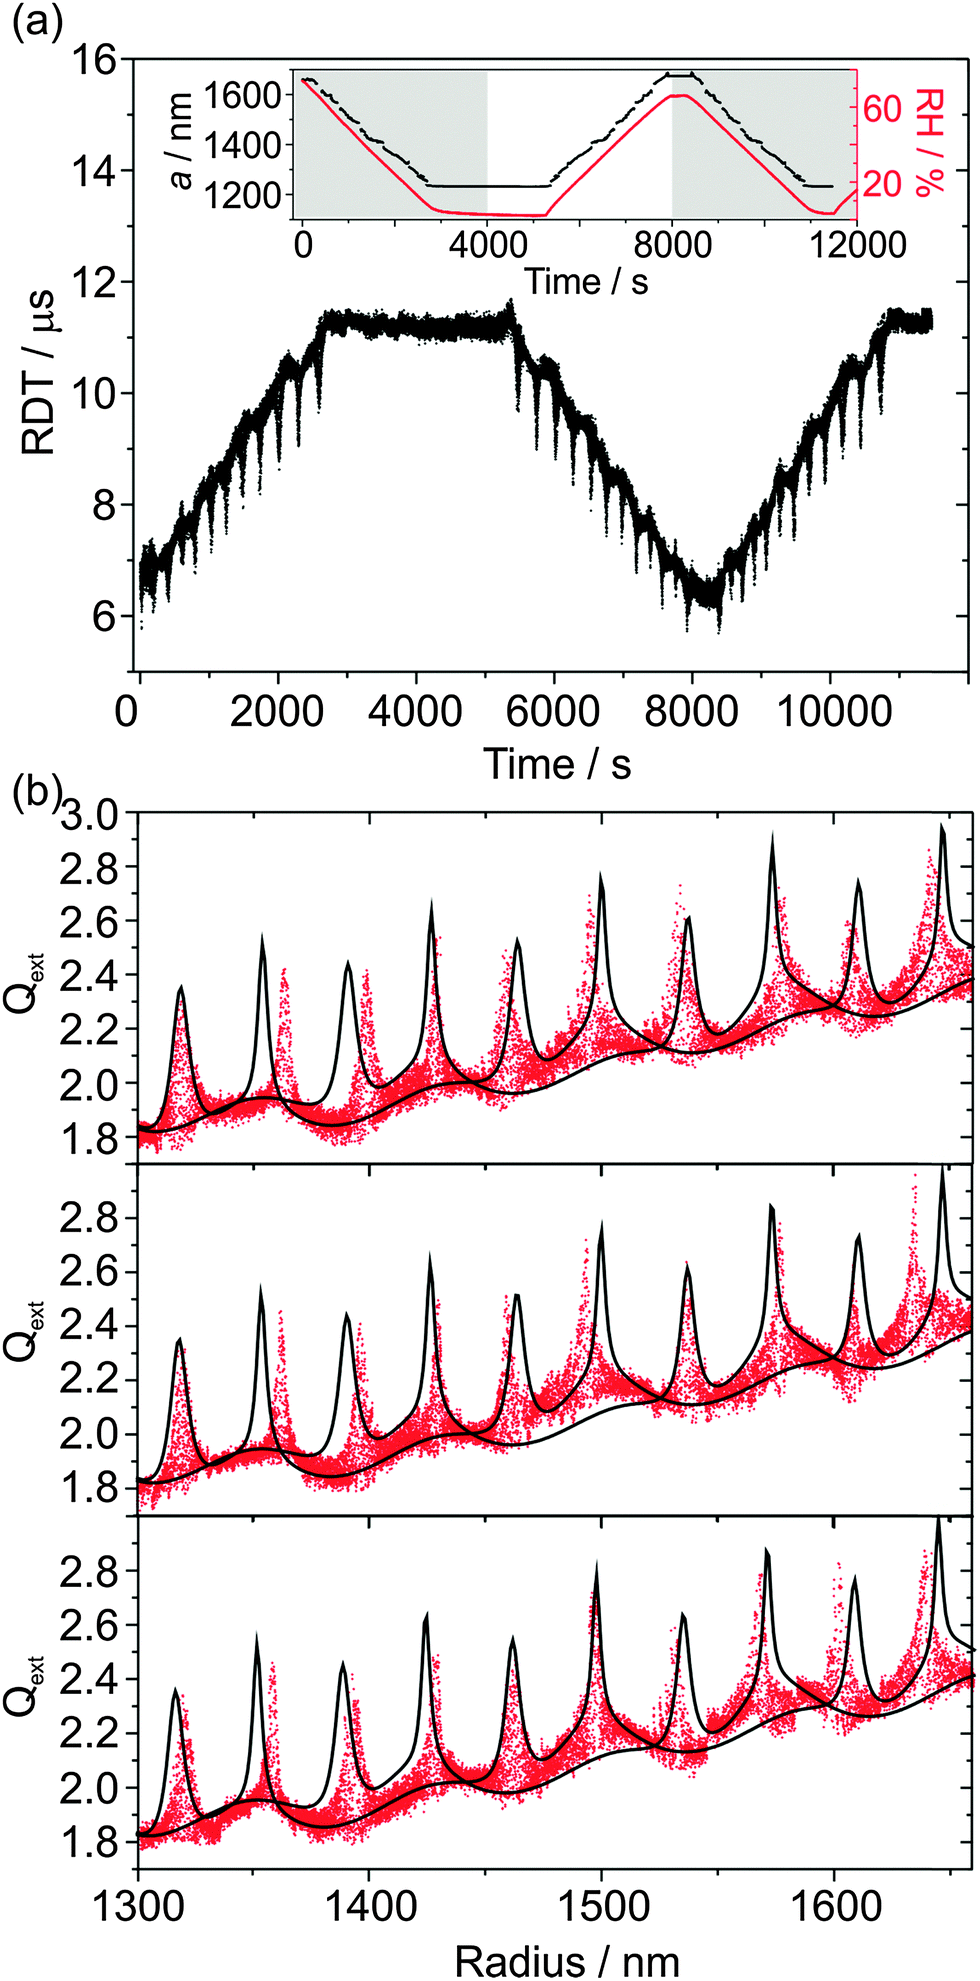 | ||
| Fig. 7 (a) The measured RDTs over time for a NaNO3 droplet in an experiment in which the RH was cycled between low and high RH. The inset shows how the RH and droplet radius varied over time, while the shaded panels demark regions where the Qext were determined separately. (b) The determined Qext as a function of radius for the three regions highlighted in the inset of (a), with accompanying CSW Mie simulations. | ||
There is clear symmetry in the RDTs as the RH is cycled between high and low RH. The three different phases to the RH cycling are now separately analysed in more detail, although the radius was determined from analysing all the PFs together for the three phases. These three phases are the first 4000 s during which the RH is initially lowered; 4000–8000 s in which the RH is subsequently increased; and 8000 s to the end of the measurement, for which the RH is once again lowered to ∼3%. These three phases are shown in the three panels of Fig. 7(b). There are a few mismatches in resonance peak locations in all cases resulting from the ∼20 nm jumps in the radius data, although there is reasonable agreement between the underlying contours of the measured Qext and the CSW simulations, implying that the fitted n532 is good. There is no noticeable hysteresis in the measured Qext, so there is no effect of inhibition of water transport between the droplet and the gas phase because of increases in viscosity on the timescales of RH variation performed here. The droplet finally fell from the trap at ∼3% RH upon the second RH reduction phase. This particle loss could be attributed to efflorescence, but could equally be due to the particle randomly exiting the trap through instability.
V. Measurement of Qext for accumulation mode aerosol
Up until this point we have only presented results for droplets which were larger than ∼800 nm in radius. As was discussed in the introduction, the most important aerosol particle size regime in terms of atmospheric optics is that for particles with radii >200 nm but <1000 nm. In this section, we report the first single particle Qext measurements, and companion CSW Mie theory simulations, for particles with radii ranging from 650 nm to as small as ∼250 nm. For these measurements, aerosol particles were optically trapped in a BB with a core diameter of ∼3 μm and positioned in the centre of a λ = 532 nm CRD beam for the measurement of Qext.Fig. 8(a) shows the time-dependence of the measured radius (black data points) for a hexanetriol droplet evaporating from a radius of 1040 nm to ≤300 nm. As the radius of the droplet approaches the wavelength of the illuminating beam (532 nm), size determination of the droplet is unreliable as the PFs become featureless, giving 50–100 nm jumps in the fitted radius. Because the evaporation of hexanetriol is well described by the Maxwell mass-flux equation,10,19 we fit a third order polynomial through the portion of the data which has been sized well using Mie theory (i.e., for droplet radii > 400 nm) and project the radius forwards in time, as shown by the solid red line in Fig. 8(a). The measured Qext data for this droplet, along with CSW Mie theory simulations, are shown in Fig. 8(b). The agreement between the CSW Mie theory simulations and the measured Qext data is excellent, with near-perfect agreement in the positions of resonance peaks even at droplet radii <400 nm. This good agreement at small particle sizes is emphasised in the inset, which shows an expanded portion of the data in the range 450–600 nm, and indicates that the use of a polynomial fit to predict the radius for small sizes was adequate in describing the size of the particle.
 | ||
| Fig. 8 (a) The determined radius as a function of time for a hexanetriol droplet which evaporates to accumulation mode sizes. A 3rd order polynomial is fitted to data >400 nm, and extrapolated to smaller radii (longer times). (b) The result of Qext fitting to CSW Mie simulations, using the radius determination from the third order polynomial fit. | ||
These results represent the first published single particle measurements of Qext for accumulation mode aerosol. The fitted n532 (which takes a constant value for this single-component system) is 1.4823 ± 0.0002, which is in reasonable agreement with previous single particle CRDS measurements for hexanetriol at λ = 532 nm of 1.4782 ± 0.0007.25 The value measured here agrees particularly well with the determined n532 from previously published radiation pressure measurements, which found n532 to be 1.482 ± 0.001.19 Reasons for the difference in these values might be variations in the RH at which the measurements were performed; however the exact RH probe measurements were not reported in these previous publications.
The same experimental set-up was used to examine the hygroscopicity of a sub-650 nm aqueous NaNO3 droplet at ∼68% RH which evaporated to a radius < 500 nm at low (∼2%) RH, as shown in Fig. 9(a). Because the droplet is so small, angular light scattering becomes featureless and sizing accuracy becomes poor. There are two ∼50 nm jumps in the determined radius, as well as unphysical undulations, despite smooth RH variation. Simply, the variation in scattering intensity with angle as recorded in the PF becomes increasingly featureless as the size diminishes, providing little constraint in the fitting of radius and RI. To describe the time variation in the droplet radius in a way which is more representative of the true radius evolution, a Kappa-Köhler dependence of the form:
 | (10) |
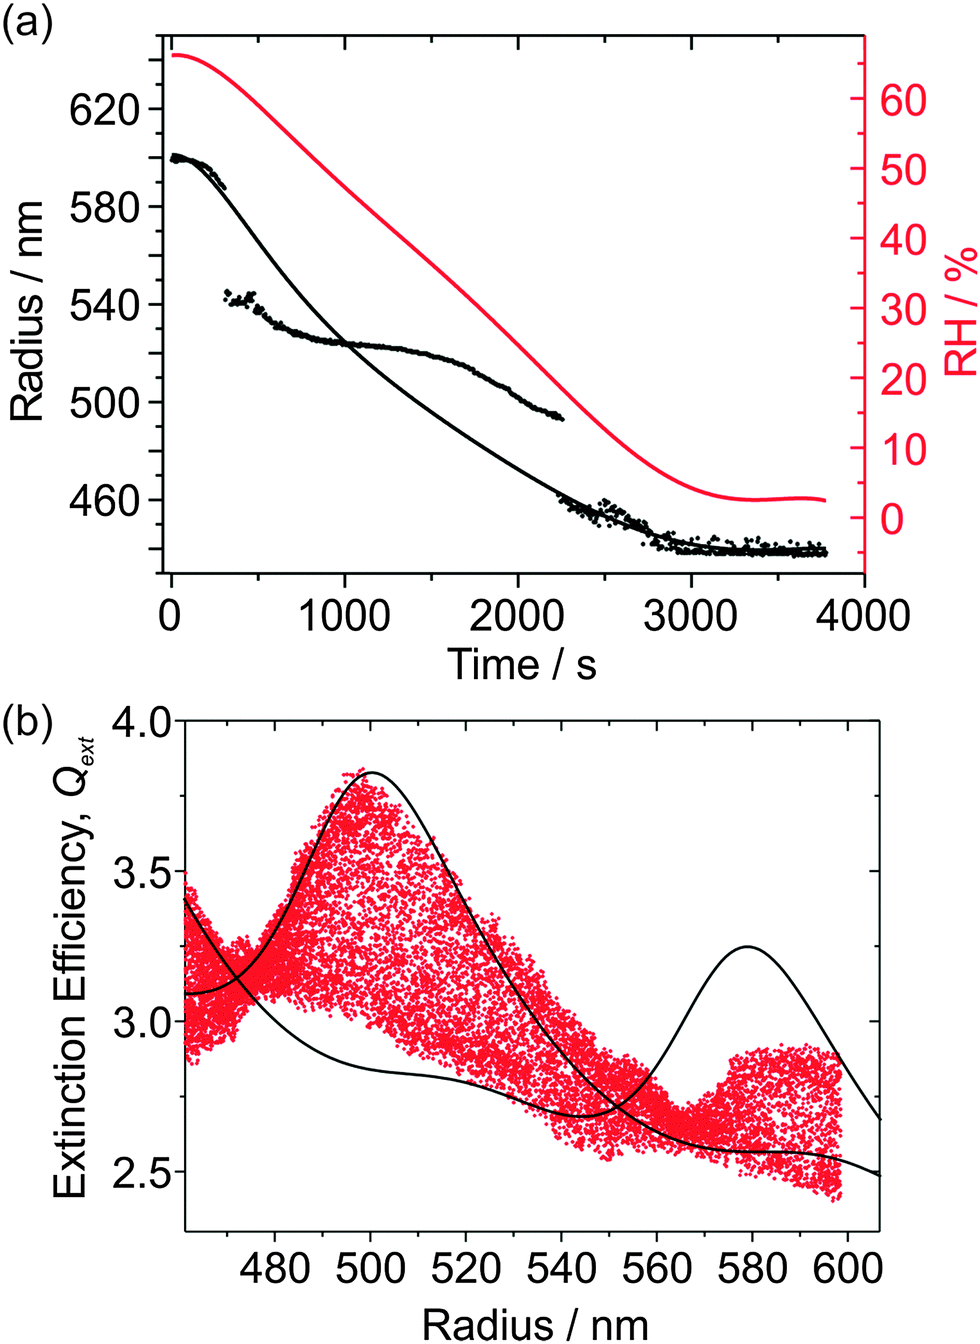 | ||
| Fig. 9 (a) Plot of the measured radius vs. time (grey data points) for a hygroscopic growth experiment on a small sodium nitrate droplet, with the RH variation also plotted (red solid line). Also shown is a fit of a Kappa-Köhler curve to the radius data (black solid line). (b) Measured Qext with accompanying best fit CSW Mie theory simulations. | ||
VI. Conclusions
A new experimental approach has been presented for the measurement of single aerosol particle Qext at a wavelength of 405 nm, combining CRDS (λ = 405 nm) with BB optical confinement (λ = 532 nm) in tandem with PF measurements. This technique has been benchmarked using semi-volatile droplets of 1,2,6-hexanetriol, allowing Qext to be measured over a continuous radius range. The measured distribution of Qext derives from the particle moving within the BB trap over a few microns, traversing several nodes and anti-nodes of the cavity standing wave, with the limits in Qext accounted for using CSW Mie theory. A residual is defined as the percentage of data points that fall outside the CSW Mie-theory simulation envelope and is minimized to obtain n405. Repeat measurements for 10 evaporating hexanetriol droplets give a mean value for n405 of 1.4906 ± 0.0012, in good agreement with previous determinations from radiation pressure measurements (1.485 ± 0.006).19For hygroscopic inorganic aerosol particles exposed to a decreasing RH, both particle radius and RI change as water partitions from the aerosol particle into the gas phase. A parameterisation of nλ in terms of the particle radius is presented, consisting of 2 or 3 fit parameters (depending on the inorganic species) which are optimised to maximise the mean correlation between the measured PFs and Mie theory simulations. Radius and RI determinations from PFs (λ = 532 nm) for both an aqueous (NH4)2SO4 and a NaNO3 droplet are presented. For both these systems, the determined n532 variation with RH agrees well with previous parameterisations by Tang et al., indicating correct n532 determination.27,34 Best-fit Qext variation to CSW Mie simulations allows n405 to be evaluated. For these simulations, n405 was fitted using a parameterisation relating n405 to the droplet radius in the same way as performed in the PF fitting procedure. The results show excellent agreement between the resonance peak positions of the measured Qext and CSW Mie simulations and a good description of the underlying contour of the data. This indicates accurate size determination from fitting the PFs and good n405 determination by CRDS. There are no literature parameterisations for the variation in n405 with RH for either (NH4)2SO4 or NaNO3 with which to compare our results. However, n405 is shifted to higher values of RI compared to n532, as expected given typical dispersion behaviour for most materials. Polynomials of the form of eqn (5) were fitted to the measured n405 and n532 variation with water activity, aw, for both (NH4)2SO4 and NaNO3. Table 1 summarises the coefficients obtained in these fits. The measured n405 variations for both a (NH4)2SO4 droplet and a NaNO3 droplet were compared with those predicted using two commonly encountered mixing rules. The volume fraction mixing rule gives poor agreement with the measured n405 data, even though extrapolated solute melt densities are used. However, the molar refraction mixing rule gives good agreement with the measured n405 data.
Although the first NaNO3 droplet reported here was observed to fall out of the BB trap at ∼12% RH, many subsequent droplets remained trapped to as low as ∼2% RH without undergoing crystallisation. When the RH was kept at ∼2% for ∼40 minutes, and subsequently increased to high RH and to low RH once more, no hysteresis was observed in the measured Qext, indicating that there is no inhibition of water transport from the aerosol particle to the gas phase on the timescales of the RH variation.
We present the first single particle measurements of Qext for accumulation mode aerosol. The measured Qext variation is shown for a sub-micron hexanetriol droplet evaporating from an initial radius of 1040 nm to ≤300 nm, which is well within the accumulation mode regime. The radius below ∼400 nm is poorly determined because the droplet radius is less than the wavelength of light. The evaporation of hexanetriol is described by the Maxwell mass flux equation, allowing extrapolation of a third order polynomial fitted to the >400 nm radius data. The agreement between the measured Qext and the fitted CSW Mie simulations is good, even at small radii where the droplet radius has been predicted using the polynomial extrapolation. Finally, the hygroscopicity of a sub-650 nm NaNO3 droplet is studied as it evaporates and shrinks to a radius < 500 nm at low (∼2%) RH. The radius determination by PF analysis is poor in this size regime. Using the measured RH variation, a Kappa Köhler curve is fitted to the radius data to describe the radius evolution. Using this description for radius, the Qext variation with size is presented along with best fit CSW Mie simulations. These simulations give a reasonable description of the measured Qext variation. The limitations in the radius determination by PF analysis might be improved by using a shorter wavelength laser source to illuminate the droplet.
Acknowledgements
JPR acknowledges financial support from the EPSRC through a Leadership Fellowship (EP/G007713/1). MIC acknowledges funding from NERC and the RSC through an Analytical Trust Fund studentship and support from the Aerosol Society in the form of a CN Davies award. BJM acknowledges the EPSRC for funding. We thank NERC for financial support for instrument development via grant NE/H001972/1.References
- J. Julin, M. Shiraiwa, R. E. H. Miles, J. P. Reid, U. Pöschl and I. Riipinen, J. Phys. Chem. A, 2013, 117, 410–420 CrossRef CAS PubMed.
- R. E. H. Miles, A. E. Carruthers and J. P. Reid, Laser Photonics Rev., 2011, 5, 534–552 CrossRef CAS.
- B. J. Mason, S.-J. King, R. E. H. Miles, K. M. Manfred, A. M. J. Rickards, J. Kim, J. P. Reid and A. J. Orr-Ewing, J. Phys. Chem. A, 2012, 116, 8547–8556 CrossRef CAS PubMed.
- J. Michel Flores, R. Z. Bar-Or, N. Bluvshtein, A. Abo-Riziq, A. Kostinski, S. Borrmann, I. Koren and Y. Rudich, Atmos. Chem. Phys., 2012, 12, 5511–5521 CrossRef.
- A. R. Attwood and M. E. Greenslade, J. Phys. Chem. A, 2012, 116, 4518–4527 CrossRef CAS PubMed.
- E. Dinar, A. Abo Riziq, C. Spindler, C. Erlick, G. Kiss and Y. Rudich, Faraday Discuss., 2008, 137, 279–295 RSC.
- N. Lang-Yona, Y. Rudich, E. Segre, E. Dinar and A. Abo-Riziq, Anal. Chem., 2009, 81, 1762–1769 CrossRef CAS PubMed.
- D. Mellon, S. J. King, J. Kim, J. P. Reid and A. J. Orr-Ewing, J. Phys. Chem. A, 2011, 115, 774–783 CrossRef CAS PubMed.
- N. Alexander, S. Allen, T. F. Stocker, D. Qin, G.-K. Plattner, M. M. B. Trignor, J. Boschung, Y. Xia, V. Bex and P. M. Midgley, Working Group I Contribution to the Fifth Assessment Report of the Intergovernmental Panel on Climate Change, 2013 Search PubMed.
- U. K. Krieger, C. Marcolli and J. P. Reid, Chem. Soc. Rev., 2012, 41, 6631–6662 RSC.
- J. F. Davies, A. E. Haddrell and J. P. Reid, Aerosol Sci. Technol., 2012, 46, 666–677 CrossRef CAS.
- J. F. Davies, A. E. Haddrell, A. M. J. Rickards and J. P. Reid, Anal. Chem., 2013, 85, 5819–5826 CrossRef CAS PubMed.
- R. E. H. Miles, J. S. Walker, D. R. Burnham and J. P. Reid, Phys. Chem. Chem. Phys., 2012, 14, 3037–3047 RSC.
- R. M. Power, S. H. Simpson, J. P. Reid and A. J. Hudson, Chem. Sci., 2013, 4, 2597–2604 RSC.
- J. Durnin and J. J. Miceli, Phys. Rev. Lett., 1987, 58, 1499–1501 CrossRef PubMed.
- J. Durnin, J. Opt. Soc. Am. A, 1987, 4, 651–654 CrossRef.
- J. Durnin, J. J. Miceli and J. H. Eberly, Opt. Lett., 1988, 13, 79 CrossRef CAS PubMed.
- A. E. Carruthers, J. S. Walker, A. Casey, A. J. Orr-Ewing and J. P. Reid, Phys. Chem. Chem. Phys., 2012, 14, 6741–6748 RSC.
- M. I. Cotterell, B. J. Mason, A. E. Carruthers, J. S. Walker, A. J. Orr-Ewing and J. P. Reid, Phys. Chem. Chem. Phys., 2014, 16, 2118–2128 RSC.
- J. S. Walker, A. E. Carruthers, A. J. Orr-Ewing and J. P. Reid, J. Phys. Chem. Lett., 2013, 4, 1748–1752 CrossRef CAS PubMed.
- D. McGloin and K. Dholakia, Contemp. Phys., 2005, 46, 15–28 CrossRef.
- A. E. Carruthers, J. P. Reid and A. J. Orr-Ewing, Opt. Express, 2010, 18, 14238–14244 CrossRef CAS PubMed.
- J. W. Lu, M. Isenor, E. Chasovskikh, D. Stapfer and R. Signorell, Rev. Sci. Instrum., 2014, 85, 095107 Search PubMed.
- I. Thanopulos, D. Luckhaus, T. C. Preston and R. Signorell, J. Appl. Phys., 2014, 115, 154304 CrossRef.
- B. J. Mason, J. S. Walker, J. P. Reid and A. J. Orr-Ewing, J. Phys. Chem. A, 2014, 2083–2088 CrossRef CAS PubMed.
- J. P. Reid, B. J. Mason, M. I. Cotterell, T. C. Preston and A. J. Orr-Ewing, Proc. SPIE, 2014, 9164, 91641Y1–91641Y8 CrossRef.
- I. N. Tang and H. R. Munkelwitz, J. Geophys. Res., 1994, 18801–18808 CrossRef.
- T. J. A. Butler, J. L. Miller and A. J. Orr-Ewing, J. Chem. Phys., 2007, 126, 174302 CrossRef PubMed.
- H. Kogelnik and T. Li, Proc. IEEE, 1966, 54, 1312–1329 CrossRef.
- J. L. Miller and A. J. Orr-Ewing, J. Chem. Phys., 2007, 126, 174303 CrossRef PubMed.
- J. P. Reid and L. Mitchem, Annu. Rev. Phys. Chem., 2006, 57, 245–271 CrossRef CAS PubMed.
- T. C. Preston and J. P. Reid, J. Opt. Soc. Am. A, 2015, 32, 1053–1062 CrossRef PubMed.
- P. R. Bevington and D. K. Robinson, Data Reduction and Error Analysis for the Physical Sciences, McGraw-Hill, 3rd edn, 2003 Search PubMed.
- I. N. Tang, A. C. Tridico and K. H. Fung, J. Geophys. Res., 1997, 102, 23269–23275 CrossRef CAS.
- J. W. Lu, A. M. J. Rickards, J. S. Walker, K. J. Knox, R. E. H. Miles, J. P. Reid and R. Signorell, Phys. Chem. Chem. Phys., 2014, 16, 9819–9830 RSC.
- M. Daimon and A. Masumura, Appl. Opt., 2007, 46, 3811–3820 CrossRef PubMed.
- Q.-N. Zhang, Y. Zhang, C. Cai, Y.-C. Guo, J. P. Reid and Y.-H. Zhang, J. Phys. Chem. A, 2014, 118, 2728–2737 CrossRef CAS PubMed.
- M. Gysel, E. Weingartner and U. Baltensperger, Environ. Sci. Technol., 2002, 63–68 CrossRef CAS.
- Y. Liu and P. H. Daum, J. Aerosol Sci., 2008, 39, 974–986 CrossRef CAS.
- J. L. Hand and S. M. Kreidenweis, Aerosol Sci. Technol., 2002, 36, 1012–1026 CrossRef CAS.
- S. L. Clegg and A. S. Wexler, J. Phys. Chem. A, 2011, 3393–3460 CrossRef CAS PubMed.
- S. L. Clegg, P. Brimblecombe and A. S. Wexler, J. Phys. Chem. A, 1998, 102, 2155–2171 CrossRef CAS.
- ADIENT database: http://www.met.rdg.ac.uk/adient/refractiveindices.html.
| This journal is © the Owner Societies 2015 |