 Open Access Article
Creative Commons Attribution 3.0 Unported Licence
First principles investigation of the activity of thin film Pt, Pd and Au surface alloys for oxygen reduction†
Vladimir
Tripkovic
*abc,
Heine Anton
Hansen
a,
Jan
Rossmeisl
bc and
Tejs
Vegge
a
aDepartment of Energy Conversion and Storage, Technical University of Denmark, DK-4000 Roskilde, Denmark. E-mail: tripce@gmail.com
bCenter for Atomic-scale Materials Design, Department of Physics, Technical University of Denmark, DK-2800 Kgs. Lyngby, Denmark
cNano-Science Center, Department of Chemistry, University of Copenhagen, Universitetsparken 5, DK-2100 Copenhagen, Denmark
First published on 1st April 2015
Abstract
Further advances in fuel cell technologies are hampered by kinetic limitations associated with the sluggish cathodic oxygen reduction reaction. We have investigated a range of different formulations of binary and ternary Pt, Pd and Au thin films as electrocatalysts for oxygen reduction. The most active binary thin films are near-surface alloys of Pt with subsurface Pd and certain PdAu and PtAu thin films with surface and/or subsurface Au. The most active ternary thin films are with pure metal Pt or Pd skins with some degree of Au in the surface and/or subsurface layer and the near-surface alloys of Au with mixed Pt–Pd skins. The activity of the binary and ternary catalysts is explained through weakening of the OH binding energy caused by solute elements. However, given the low alloy formation energies it may be difficult to tune and retain the composition under operating conditions. This is particularly challenging for alloys containing Au due to a high propensity of Au to segregate to the surface. We also show that once Au is on the surface it will diffuse to defect sites, explaining why small amounts of Au retard dissolution of Pt nanoparticles. For the PtPd thin films there is no pronounced driving force for surface segregation, diffusion to defects or surface self-assembling. On the basis of stability and activity analysis we conclude that the near surface alloy of Pd in Pt and some PdAu binary and PtPdAu ternary thin films with a controlled amount of Au are the best catalysts for oxygen reduction.
1. Introduction
The development of new materials in the field of energy conversion and storage is a prerequisite for finding an alternative to the environmentally detrimental use of fossil fuels. One possible solution is to use the proton exchange membrane fuel cell (PEMFC). However, the PEMFC technology is not cost-competitive with contemporary internal combustion engines due to the high cost of the platinum catalyst. Reducing the Pt-loading at the cathode by improving the catalyst performance (activity & stability) is a key factor needed for commercialization of the technology. However, the Pt loading cannot be reduced without overcoming kinetic limitations associated with the cathodic oxygen reduction reaction (ORR) and/or extending the life-time of the catalyst.1,2 Although, the maximum theoretical efficiency in PEMFCs is 83%, in practice, the efficiency is about half of the theoretical value. The loss of catalytic activity is mainly attributed to surface poisoning of the catalyst by water oxidation products. The poisoning shifts the working potential by ca. 0.4 V from the equilibrium potential even on the most active Pt-group catalysts.3–7 The stability loss, on the other hand, is associated with platinum dissolution under highly corrosive conditions at the PEMFC cathodes.2 Several strategies to improve the activity and stability performance have been implemented over the past decades. For instance, the Pt activity can be satisfactorily tuned by alloying Pt with non-noble metal elements.8–13 The idea behind alloying is to change the electronic properties of the platinum surface in order to retard the onset potential for water oxidation. This, in turn, will increase the working potential and the overall efficiency of the cell. Activity enhancements might, however, be offset by degradation of the membrane electrode assembly caused by leaching-out of base-metals and contamination of the ion-exchange sites in the membrane.2 Alloying Pt with metals that have higher dissolution potentials, such as noble metals, can overcome this problem.Different alloys of Pt, Pd and Au have previously been investigated as potential catalysts for oxygen reduction. In the following section we will examine the current status of research on these alloys. The activity for the ORR of Pt(111) skins on late-transition metals has been systematically analyzed in the past.14 A Pt(111) monolayer on Pd(111) stood out as the only catalyst whose activity surpassed that of Pt(111). The same analysis performed for Pd(111) skins showed no activity improvement whatsoever with respect to Pd(111).15,16 Different formulations of PtPd bulk catalysts have been synthesized and tested for oxygen reduction. In ref. 17, the authors found that non-supported PtPd aerogels exhibited a volcano-type dependence on the Pd content, with the highest activity centered at 20–30% Pd. The virtue of these catalysts is that they combine high stability of extended surfaces with high surface area of nanoparticulate catalysts. Other nanostructured PtPd alloys have also shown very encouraging results.18–27 Despite the fact that Pt and Au are immiscible in the whole concentration range, it is possible to make PtAu alloys using specific synthesis procedures.28–30 The activity of PtAu was found to be strongly dependent on the catalyst pretreatment. After heating the catalyst in a CO atmosphere or cycling it into the oxide formation region, the observed activity was greater than that on Pt.26,28,31–34 The activity enhancement was attributed to a reversible surface segregation of Pt induced by CO or O adsorbates. Au has a low surface energy and thus naturally prefers to be on the surface. On the other hand, CO binds more strongly to Pt, which can stabilize Pt in the surface layer. In addition to prompting the activity, Au has shown another beneficial effect on Pt. Small Au clusters added to Pt nanoparticles improved its stability by increasing the average nanoparticle dissolution potential.35,36 PdAu alloys have mainly been used as electrocatalysts for the oxidation of small organic molecules such as CO,37 formic acid,38,39 ethanol40 or glycerol.41 The only reported study on the ORR activity was for PdAu nanowires.42 The PdAu nanowires displayed an approximately two-fold activity increase with respect to archetypal Pt. As for the ternary catalysts, there are promising new reports for nanoparticles with Pt shell on a Pd core with some additional gold in the subsurface layer.42 The role of gold was ascribed to lowering the activity loss during operation.
In this work using density functional theory (DFT) calculations, we systematically investigate different formulations of Pt, Pd and Au binary and ternary thin films for the ORR. We establish composition–activity and activity–stability relationships using the binding energy (BE) of OH and surface energy of the thin film terminated slab as activity and stability descriptors. Furthermore, we discuss stability in terms of how easily the composition can be changed during operation and the driving forces behind the change. More specifically, we analyze and compare surface segregation energies without the presence of adsorbates and with OH/O at a fixed 1/3 monolayer (ML) coverage. In addition, we examine the site and distribution preference for segregation. The site preference indicates whether solute atoms segregate more favorably to terraces or defects. The distribution preference indicates whether solute atoms segregate forming uniform distributions, alike those in surface alloys, or distinct solute enriched domains. For establishing the composition–activity and activity–stability relationships, we employ the most stable and well-defined close-packed (111) termination. For the analysis of a defect driven diffusion, we employ the stepped (221) surface.
2. Results and discussion
2.1. Binary alloys
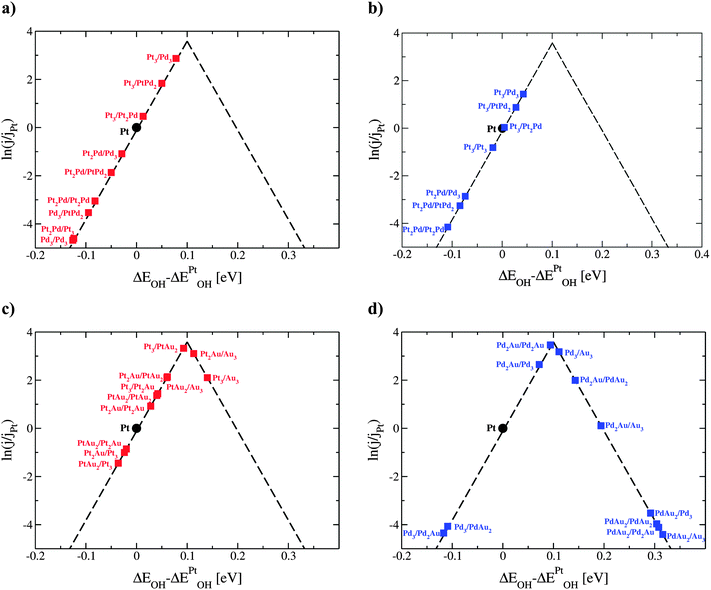
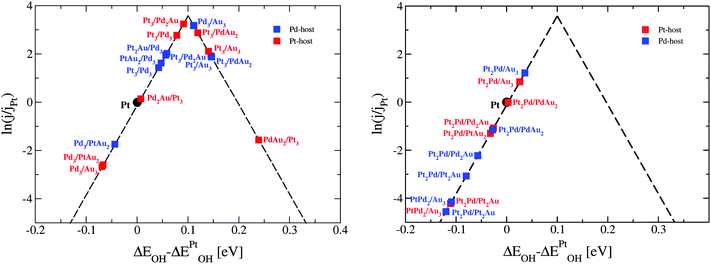
Six binary combinations of Pt, Pd and Au elements are initially investigated, i.e. Pt@PtPd, Pt@PtAu, Pd@PtPd, Pd@PdAu, Au@PtAu and Au@PdAu, where composition before the @ sign is for the core element and after for the thin films. Utilizing a √3 × √3R30° unit cell size allows the composition in each layer to be varied uniformly in increments of 1/3 ML, yielding in total 16 possible compositions for the two surface layers. Four possible arrangements of the host and solute elements in the surface layer are presented in Fig. 1. Two out of six thin films, Au@PtAu and Au@PdAu are discarded a priori. Presumably these thin films will not be active for the ORR due to the large Au lattice constant. Overlaying a Au substrate with a Pt or Pd overlayer will induce a tensile strain in the overlayer. This will, in turn, increase the OH BE making the catalysts even more prone to surface poisoning. As a result, the ORR activity will decrease.11,16 Hereafter, in order to distinguish between different compositions, in the text the thin alloy films are denoted by the composition of the surface layer, subsurface layer and bulk using the following nomenclature 1st layer/2nd layer/bulk composition. The composition in the 1st and 2nd layer is denoted by the number of atoms in the surface unit cell, and bulk composition by the host element symbol. For example, the Pt2Au/Pt3/Pt notation denotes a thin film that has two Pt and 1 Au atom in the surface layer, 3 Pt atoms in the subsurface layer while rest is bulk Pt. We use the same nomenclature in the figures with a difference that the host element is given by color; red for Pt and blue for Pd.Almost all thin films with the activities greater than that of Pt have at least 1/3 ML solute element content in the subsurface layer. The weakening of the OH BE is explained through a ligand effect brought about by the subsurface solute atoms. The influence of the ligand effect depends on the host and solute elements. It is weak for PtPd and greater for the PtAu and PdAu thin films. For thin films that have a high Au concentration on the surface, and are predicted to be very active for the ORR (e.g. PtAu2/Au3/Pt), the 4-electron reduction to water will take place through a non-surface mediated splitting of the OOH bond.46,47 The strain effect is fixed and given by the metal host. Since Pt and Pd have very similar lattice constants, the strain imposed on the surface is similar. The influence of the strain effect can be best discerned by comparing data in Fig. 2a and b.
The ligand effect of Au is at first glance counterintuitive. Pt or Pd overlayers bind more weakly in the presence of subsurface Au, suggesting that the OH BE should be stronger on these alloys. The reason why the opposite is seen is because the average number of electrons in the surface layer, subsurface layer and OH is further away from fulfilling the octant rule in comparison to OH on pure Pt or Pd.48
We start the stability analysis by discussing the calculated bulk alloy formation energies in Table 1. We assumed that the alloys crystallize in the face-centered-cubic crystal structure, given that this is the native crystal structure of all the metals. Formation energies are a first indication of how facile is to retain different compositions. Owing to the low alloying energies, the noble metal alloys form solid solutions with no distinct atom arrangements as in the case of e.g. intermetallic alloys. The activity of these catalysts is given by a weighted sum of activities over a range of possible compositions. As expected, the formation energies are lower when the unit cell is allowed to relax than when it is constrained to the Pt/Pd lattice, with the differences increasing with the solute element content and generally being higher for Au containing alloys. The latter values are more relevant because the surface unit cell of the thin films is fixed to the Pt/Pd lattice constant.
| PtAu3 | 0.035/0.172 | PdAu3 | −0.072/0.068 | PtPd3 | −0.004/−0.003 |
| Pt2Au2 | 0.080/0.143 | Pd2Au2 | −0.072/−0.016 | Pt2Pd2 | −0.013/−0.012 |
| Pt3Au | 0.054/0.071 | Pd3Au | −0.035/−0.019 | PtPd3 | −0.014/−0.014 |
The change in composition can happen either between different layers or within the same layer. In the former case, the change is known as surface segregation and in latter case surface diffusion. Surface segregation can be further separated into an intrinsic surface segregation (ISS) and an adsorbate-induced surface segregation (AISS) depending on a driving force. For the ISS, the main driving force is the difference in surface energies between the elements in the alloy. The driving force for the AISS is the difference in the BE of adsorbate on different elements forming the alloy. The ISS and OH/O AISS are schematically illustrated in Fig. 3 on the example of the Pt3/Au3/Pt near surface thin film.
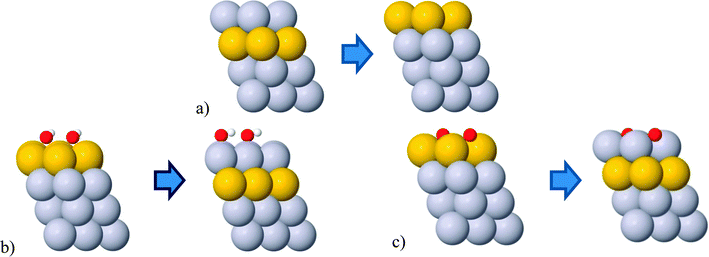 | ||
| Fig. 3 Illustrations of the (a) intrinsic, (b) OH induced and (c) O induced surface segregations. The OH/O coverage is 1/3 ML. Gray and yellow balls represent Pt and Au atoms, respectively. | ||
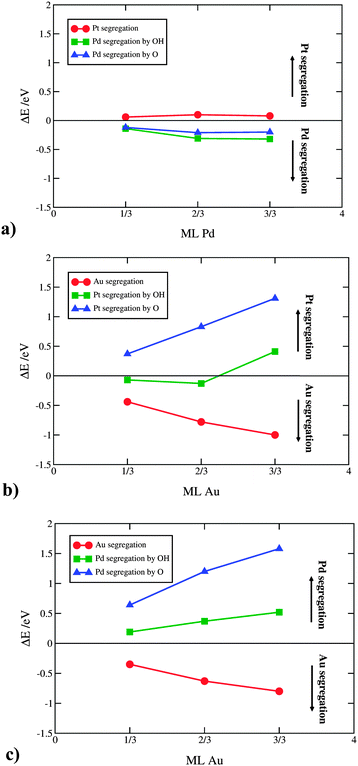
It is important to note that the OH/O AISS energies also include the ISS energy of the second component. Applied to the above example, in order to get the OH/O AISS energy of Pt, one has to subtract the ISS of Au from the OH/O AISS energy of the total system. This is because Pt segregates to the surface simultaneously with Au displacement to the subsurface layer (see Fig. 3b and c). Hereafter, the AISS of the second component is simply termed the AISS. The ISS and OH/O AISS energies at 1/3 ML coverage are shown in Fig. 4 for the bimetallic thin films as a function of the number of solute atoms in the subsurface layer. The reported energies are integral energies referring to a simultaneous exchange of all solute atoms between the subsurface and surface layer. The corresponding energies for substitution between the 2nd and the 3rd layer are typically more than an order of magnitude smaller. This indicates that there is a very strong driving force for surface segregation from subsurface and a small driving force for segregation beneath the surface layers. Actually, it has been shown that Au deep inside nanoparticles can prevent dissolution of a non-noble component in multimetallic Pt alloys.49,50 Which energy prevails, the ISS or AISS energy, is given by differences between the red and blue/green lines in Fig. 4. The two segregation energies for the PtPd thin films are almost identical owing to similar surface energies of the two metals. Pd displays a slight preference for the surface over the bulk, which is in agreement with experimental surface energies of the two metals.51 For the PtAu and PdAu thin films, the ISS energies of Au are generally very high. They are highest for the 1/3 ML Au subsurface concentration and decay monotonically per Au atom with increasing Au content. Au has a somewhat higher propensity to segregate to the surface in PtAu than PdAu thin films. Moreover, the OH/O AISS energies are higher on PdAu than PtAu, implying that Au segregation will more readily occur in PtAu than PdAu thin films. The energy gain from Au segregation can be offset by a potential dependent O induced platinum segregation. The resulting direction of segregation depends on the coverage of oxygenated species. It is clear from Fig. 4 that the 1/3 ML OH coverage is not sufficient to instigate Pt segregation. This is achieved only if OH is entirely oxidized to O. It should be noted that running reactions at potentials corresponding to 1/3 ML O, i.e. 1.0 V, is not possible because kinetic limitations set in already at potentials corresponding to ca. 1/3 ML OH coverage, i.e. 0.85 V.52,53 Avoiding activity losses caused by Au segregation can be accomplished by periodical potential excursions to higher potentials. In reality, this happens during stop-and-go drives, where the potential occasionally jumps to 1.5 V.
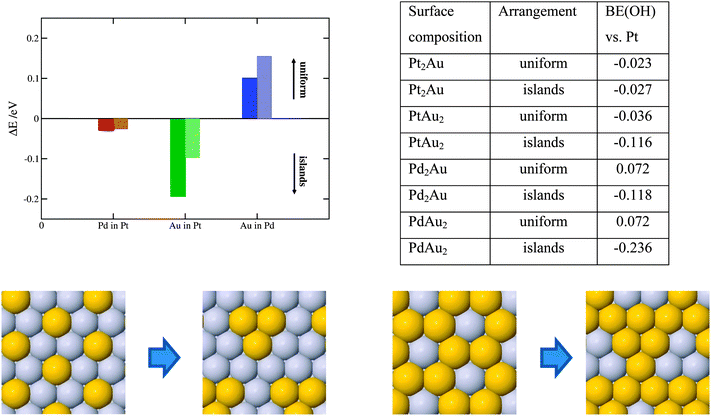
Solute atoms that segregate to the surface can organize in different ways, e.g. forming a uniform distribution, such as a surface alloy or homogenous islands. The outcome is given by the preference of solutes to be surrounded by other solute atoms or host element atoms. To elucidate the surface ordering of solutes, we have performed calculations with fixed 1/3 and 1/6 ML surface concentrations of solutes in an otherwise pure Pt or Pd host. Here, we employed a larger non-orthogonal (111) cell with 3 × 3 surface atoms. The energy differences between two structure extremities are shown in Fig. 5.
As seen, there is a tiny driving force for making Pd rich domains in Pt and a larger driving force for making Au rich domains in Pt. Au on the Pd(111) surface, on the other hand, energetically prefers to form surface alloys. The higher the solute concentration, the lower the probability the solute atoms will form islands. In the following, we discuss how surface ordering of solute atoms affects the ORR activity. For Pt with 2/3 ML surface Au the activity reduces by 0.08 eV (more than an order of magnitude) going from the uniform to energetically more stable island distribution. For the lower, 1/3 ML Au concentration, the effect on the activity is negligible. For the PdAu thin films the OH BE increases (becomes more negative) when surface Au atoms organize into islands irrespective of the solute element content. This is detrimental for the activity, however, as the island formation is not favored in the PdAu thin films, their activities will not be appreciably affected. Formation of uniform Pd–Au distributions is very good from a perspective of the active Pd2Au/Pd3 thin film. The theoretically estimated activity is more accurate because the assumed distribution model is uniform (see Fig. 1).
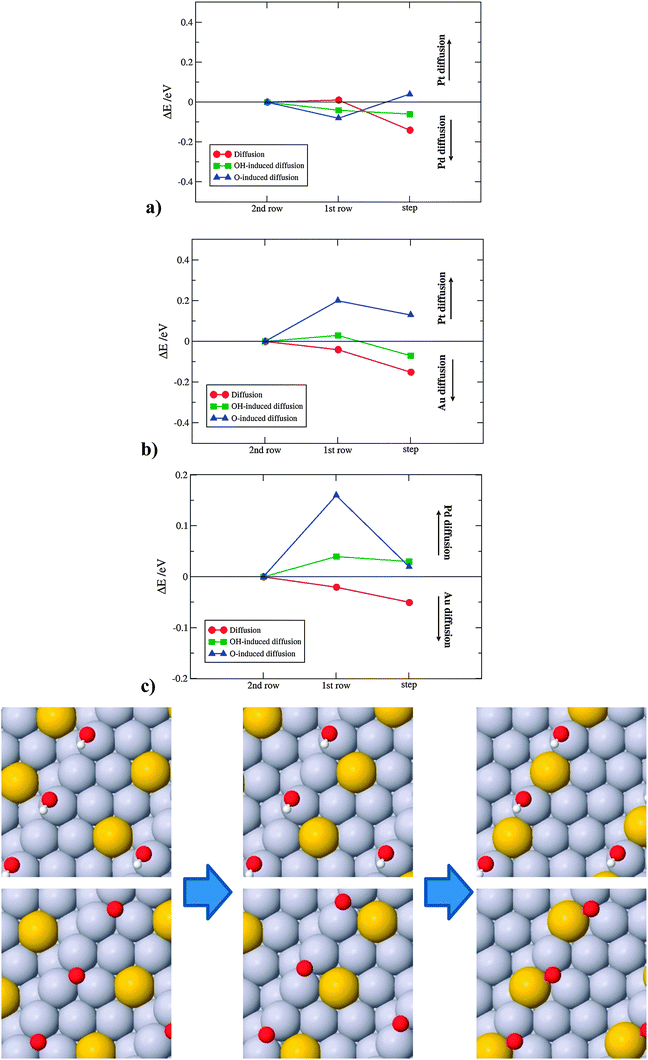
For Pd on Pt(221), the energy differences are small, which supports the notion that alloys of Pt with Pd are typical solid solutions of the two metals. For diffusion of Au on Pt(221) and Pd(221) there is a significant difference that favors Au segregation to the step. This difference can be rationalized through a higher surface energy gain from moving an Au atom from a terrace to a step site than a Pt atom in the opposite direction. Here, we have used the stepped crystal as the simplest model for a surface defect. We expect that an even larger energy gain is obtained on more under-coordinated sites. Diffusion of Au to defects can add interpretation to experimental evidences in which small amounts of Au are found to stabilize Pt nanoparticles against dissolution. The results further evince that the formation of oxygen on defects, which sets in at lower potentials than on terraces,54 will force Au atoms to change the direction of diffusion, from steps to terraces.
 | (1) |
| EsurfB = (E(m+n)B − (m + n)EsurfB)/2 | (2) |
 and EsurfB are surface energies of an AmBn binary thin film (A-solute and B-host element) and B, respectively, where m and n are the total numbers of A and B atoms in the slab. For the √3 × √3R30° surface unit cell and 4 layers thick slabs, the number of atoms, m + n, in the slab sums up to 12. EbulkB and EbulkA are the energies of A and B in bulk and E(m+n)B is the total energy of the fixed slab made of pure element B. The first three terms in eqn (1) are used to calculate surface energies of AmBn thin films. As each slab has two surfaces exposed to vacuum, in order to get the surface energy of a thin film terminating side of the slab one has to subtract the surface energy of metal B, EsurfB, from backside of the slab. Eqn (2) is used to estimate EsurfB using a similar rationale as for AmBn. Number 2 enters into eqn (2) because slab B has two equivalent surfaces. Here, we have used the bulk values as references, which is justified by the small alloying energies of the thin films (see Table 1). If the alloy formation energies were larger then the chemical potential of the solute element in the alloy would be the right reference.
To select the best bimetallic thin films catalysts, in Fig. 7 we plot the activity against the stability. The activity is approximated by the OH BE on the x-axis and the stability by surface energy on the y-axis. The grey box in Fig. 5 designates the area, where the activities are higher than that on pristine Pt(111); that is, for the OH BE values ranging from that on Pt(111) to a symmetric point on the opposite side of the volcano. As seen, for the binary PtPd systems (red triangles) it is best to have the near-surface alloy of Pd in Pt or Pt skin on Pd (see the ESI†). Notice that surface energies for the PtPd thin films change linearly with the Pd content in the subsurface layer. There are many PtAu and PdAu thin film formulations that fall in the designated area, however, many of these are not stable owing to high surface energies. Even those formulations with Au that have low surface energies might be considered unstable because if Au is present in excess, it will segregate to the surface and change the thin film compositions to those with smaller surface energies and lower activities for the ORR (see the points in the lower-right corner of Fig. 7). However, if the amount of Au is carefully dosed, e.g. in Pd to form Pd2Au/Pd3, then the Pd2Au/Pd3 thin film might be a good catalyst for the ORR. It is noteworthy that surface energies of the PdAu thin films are generally lower than those for the PtAu or PtPd thin films. This is a result of several effects: (1) the computed Pd surface energy is lower than Pt surface energy, (2) the formation energies of PdAu alloys are greater than those of PtAu alloys (see Table 1) and (3) the assumed distribution is uniform, which is energetically the less stable configuration for the PtAu thin films (see Fig. 5).
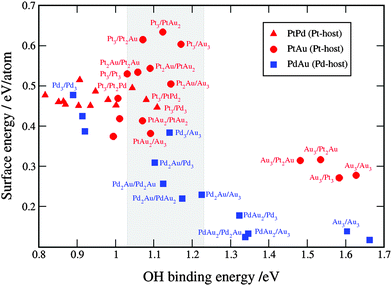 | ||
| Fig. 7 Comparison between the activity and stability descriptors used to assess the catalyst performance. The grey shaded box is the area with the activities higher than that on Pt(111). For clarity reasons, only points with the OH binding energies higher than that on Pt are labeled. A table with the surface and OH binding energies for the bimetallic systems is given in note 3 in the ESI.† | ||
2.2. Ternary thin films
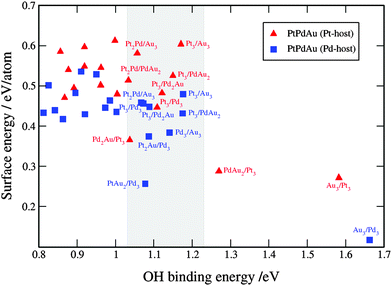 | ||
| Fig. 9 Comparison between the activity and stability descriptors used to assess the catalyst performance. The grey shaded box is the area with the activities higher than that of Pt(111). For clarity reasons, only points with the OH binding energies higher than that of Pt are labeled. A table with the surface and OH binding energies for the ternary systems is given in note 3 in the ESI.† | ||
3. Conclusions
In summary, we have shown that certain binary and ternary Pt, Pd and Au thin films display high activities towards the ORR. The major conclusions can be summarized in the following points.(1) The activity is very sensitive to the alloy composition. Due to the low alloy formation energies the thin films form solid solutions with a range of compositions. It might be therefore, difficult to retain the composition with the highest activity. Nonetheless, in the case of many thin films, there are several different formulations with high activities. For instance, as long as Pd in the binary PtPd thin films is restricted below the surface layer the activities will remain high. Moreover, the higher the Pd subsurface content the more stable the alloy. As for the binary and ternary thin films with Au, there are many formulations with Au in the surface and/or subsurface layer that are quite active for oxygen reduction. However only few of these are stable, such as Pd2Au/Pd3/Pd or PtAu2/Pd3/Pd, and that is under condition that there is no excess Au that can change the compositions over time towards more Au enriched surfaces.
(2) Solute elements in the subsurface layer are generally found to weaken the OH BE through the ligand effect. The higher the solute atom concentration, the more the OH BE is weakened. Having Pt or Pd in the bulk (below the subsurface layer) does not appreciably affect the results (see Fig. 2a and b for comparison). Strain effects are essentially the same for the two metal hosts, whilst ligand effects from the 3rd and subsequent layers are largely screened at the surface.
(3) There is a large thermochemical driving force for Au to segregate to the surface. The segregation energy can be offset by oxygen mediated Pt/Pd segregation. This will happen only if the oxygen coverage on the surface is 1/3 ML or greater. As this coverage is attained at potentials at which the ORR is kinetically inhibited, occasional excursions to higher potentials are required to recover the activity, i.e. the lost platinum surface area.
(4) There is a thermochemical driving force for Au, once segregated to the surface, to diffuse to more under-coordinated sites. Au renders Pt less prone to dissolution through charge transfer effects. Diffusion of Au atoms to defects can explain high stabilities observed for Pt nanoparticles decorated by Au clusters. In addition, Au in Pt shows a tendency to self-assemble into islands and in Pd into surface alloys.
(5) There is almost no, or a very little, driving force for Pd to segregate to the Pt surface irrespective of the surface oxidation state. In addition, Pd in Pt shows no preference for defects or surface self-assembling.
On the basis of the presented data, we conclude that the binary PtPd thin films, in which Pt comprises the skin and Pd is restricted to the subsurface layer(s) are the best catalysts for oxygen reduction. Addition of a small, controlled amount of Au can, however, further improve the performance of the PtPdAu thin films (e.g. Pt2Au/Pd3/Pd and PtAu2/Pd3/Pd) by retarding the dissolution of under-coordinated Pt atoms, and perhaps even enhancing the activity, making the ternary PtPdAu systems interesting for the ORR in PEMFCs.
4. Theory
Total energies are calculated using density functional theory (DFT) calculations employing grid-based projector-augmented wave method (GPAW) code integrated with atomic simulation environment (ASE).55 Calculations are performed using the RPBE exchange–correlation functional56 and a grid spacing of 0.15 Å. The RPBE relaxed lattice constants of Pt and Pd are 3.991 and 3.980 Å, respectively. The occupation of the one-electron states is calculated at an electronic temperature of kBT = 0.1 eV, and then extrapolated to kBT = 0 K.Pt(111) and Pt(221) electrodes are represented by periodically repeated slabs separated by at least 10 Å vacuum. Two unit cells with (√3 × √3)R30° and (3 × 3)R30° size in the surface plane are used to represent the (111) surface. The Pt(221) electrode was made from the 2 × 4 Pt(111) slab by adjusting the unit cell parameters. The slab thickness for all the electrodes is 4 layers. The bottom two layers are fixed both in terms of composition and coordinates, while the remaining atoms and adsorbates are allowed to relax in order to assume minimum energy positions. In the ESI† we also provide a table showing how the BEs relative to Pt(111) change as a function of the number of slab layers.
The total number of configurations for each binary system given the unit cell size is 42. For all surfaces the Brillouin zone was sampled by a 4 × 4 × 1 Monkhorst–Pack k-point grid, which was sufficient to obtain converged results.57 The convergence is reached when the sum of absolute forces acting on the atoms becomes less than 0.05 eV Å−1. Symmetry and dipole corrections are applied to reduce the number of k-points in the Brillouin zone and to electrostatically decouple the interaction of neighboring slabs.
Acknowledgements
The financial support of the European Commission under the FP7 Fuel Cells and Hydrogen Joint Technology Initiative grant agreement FP7-2012-JTI-FCH-325327 for the SMARTcat project and FP7-2011-JTI-FCH-303492for the CATHcat project is gratefully acknowledged. We would also like to acknowledge Paul C. Jennings for valuable discussions.References
- M. K. Debe, Nature, 2012, 486, 43–51 CrossRef CAS PubMed.
- H. A. Gasteiger, S. S. Kocha, B. Sompalli and F. T. Wagner, Appl. Catal., B, 2005, 56, 9–35 CrossRef CAS PubMed.
- X. Zhao, M. Yin, L. Ma, L. Liang, C. P. Liu, J. H. Liao, T. H. Lu and W. Xing, Energy Environ. Sci., 2011, 4, 2736–2753 CAS.
- N. Markovic, H. Gasteiger and P. N. Ross, J. Electrochem. Soc., 1997, 144, 1591–1597 CrossRef CAS PubMed.
- B. B. Blizanac, P. N. Ross and N. M. Markovic, Electrochim. Acta, 2007, 52, 2264–2271 CrossRef CAS PubMed.
- S. Kondo, M. Nakamura, N. Maki and N. Hoshi, J. Phys. Chem. C, 2009, 113, 12625–12628 CAS.
- F. H. B. Lima, J. Zhang, M. H. Shao, K. Sasaki, M. B. Vukmirovic, E. A. Ticianelli and R. R. Adzic, J. Phys. Chem. C, 2007, 111, 404–410 CAS.
- S. Mukerjee, S. Srinivasan, M. P. Soriaga and J. McBreen, J. Electrochem. Soc., 1995, 142, 1409–1422 CrossRef CAS PubMed.
- V. R. Stamenkovic, B. Fowler, B. S. Mun, G. F. Wang, P. N. Ross, C. A. Lucas and N. M. Markovic, Science, 2007, 315, 493–497 CrossRef CAS PubMed.
- J. Greeley, I. E. L. Stephens, A. S. Bondarenko, T. P. Johansson, H. A. Hansen, T. F. Jaramillo, J. Rossmeisl, I. Chorkendorff and J. K. Nørskov, Nat. Chem., 2009, 1, 552–556 CrossRef CAS PubMed.
- R. R. Adzic, J. Zhang, K. Sasaki, M. B. Vukmirovic, M. Shao, J. X. Wang, A. U. Nilekar, M. Mavrikakis, J. A. Valerio and F. Uribe, Top. Catal., 2007, 46, 249–262 CrossRef CAS.
- S. Koh and P. Strasser, J. Am. Chem. Soc., 2007, 129, 12624–12625 CrossRef CAS PubMed.
- S. Mukerjee and S. Srinivasan, J. Electroanal. Chem., 1993, 357, 201–224 CrossRef CAS.
- A. U. Nilekar, Y. Xu, J. Zhang, M. B. Vukmirovic, K. Sasaki, R. R. Adzic and M. Mavrikakis, Top. Catal., 2007, 46, 276–284 CrossRef CAS.
- V. Climent, N. M. Marković and P. N. Ross, J. Phys. Chem. B, 2000, 104, 3116–3120 CrossRef CAS.
- M. H. Shao, T. Huang, P. Liu, J. Zhang, K. Sasaki, M. B. Vukmirovic and R. R. Adzic, Langmuir, 2006, 22, 10409–10415 CrossRef CAS PubMed.
- W. Liu, P. Rodriguez, L. Borchardt, A. Foelske, J. Yuan, A.-K. Herrmann, D. Geiger, Z. Zheng, S. Kaskel, N. Gaponik, R. Kötz, T. J. Schmidt and A. Eychmüller, Angew. Chem., Int. Ed., 2013, 52, 9849–9852 CrossRef CAS PubMed.
- C. Koenigsmann, A. C. Santulli, K. Gong, M. B. Vukmirovic, W. Zhou, E. Sutter, S. S. Wong and R. R. Adzic, J. Am. Chem. Soc., 2011, 133, 9783–9795 CrossRef CAS PubMed.
- M. Shao, G. He, A. Peles, J. H. Odell, J. Zeng, D. Su, J. Tao, T. Yu, Y. Zhu and Y. Xia, Chem. Commun., 2013, 49, 9030–9032 RSC.
- R. Choi, S.-I. Choi, C. H. Choi, K. M. Nam, S. I. Woo, J. T. Park and S. W. Han, Chemistry, 2013, 19, 8190–8198 CrossRef CAS PubMed.
- G. Zhang, Z.-G. Shao, W. Lu, F. Xie, H. Xiao, X. Qin and B. Yi, Appl. Catal., B, 2013, 132–133, 183–194 CrossRef CAS PubMed.
- L. Liu, G. Samjeske, S. Nagamatsu, O. Sekizawa, K. Nagasawa, S. Takao, Y. Imaizumi, T. Yamamoto, T. Uruga and Y. Iwasawa, J. Phys. Chem. C, 2012, 116, 23453–23464 CAS.
- S. M. Alia, K. O. Jensen, B. S. Pivovar and Y. Yan, ACS Catal., 2012, 2, 858–863 CrossRef CAS.
- H. Zhang, Y. Yin, Y. Hu, C. Li, P. Wu, S. Wei and C. Cai, J. Phys. Chem. C, 2010, 114, 11861–11867 CAS.
- J. X. Wang, H. Inada, L. Wu, Y. Zhu, Y. Choi, P. Liu, W.-P. Zhou and R. R. Adzic, J. Am. Chem. Soc., 2009, 131, 17298–17302 CrossRef CAS PubMed.
- G. V. Fortunato, L. B. Venarusso and G. Maia, ChemElectroChem, 2014, 1, 625–636 CrossRef CAS PubMed.
- B. Y. Xia, H. B. Wu, Y. Yan, X. W. D. Lou and X. Wang, J. Am. Chem. Soc., 2013, 135, 9480–9485 CrossRef CAS PubMed.
- P. Hernández-Fernández, S. Rojas, P. Ocón, J. L. Gómez de la Fuente, J. San Fabián, J. Sanza, M. A. Peña, F. J. García-García, P. Terreros and J. L. G. Fierro, J. Phys. Chem. C, 2007, 111, 2913–2923 Search PubMed.
- H. Lang, S. Maldonado, K. J. Stevenson and B. D. Chandler, J. Am. Chem. Soc., 2004, 126, 12949–12956 CrossRef CAS PubMed.
- J. Luo, M. M. Maye, V. Petkov, N. N. Kariuki, L. Wang, P. Njoki, D. Mott, Y. Lin and C.-J. Zhong, Chem. Mater., 2005, 17, 3086–3091 CrossRef CAS.
- C.-W. Liu, Y.-C. Wei, C.-C. Liu and K.-W. Wang, J. Mater. Chem., 2012, 22, 4641 RSC.
- Y. Ma, H. Zhang, H. Zhong, T. Xu, H. Jin and X. Geng, Catal. Commun., 2010, 11, 434–437 CrossRef CAS PubMed.
- H.-Y. Park, T.-Y. Jeon, J. H. Jang, S. J. Yoo, K.-H. Choi, N. Jung, Y.-H. Chung, M. Ahn, Y.-H. Cho, K.-S. Lee and Y.-E. Sung, Appl. Catal., B, 2013, 129, 375–381 CrossRef CAS PubMed.
- K.-S. Lee, H.-Y. Park, H. C. Ham, S. J. Yoo, H. J. Kim, E. Cho, A. Manthiram and J. H. Jang, J. Phys. Chem. C, 2013, 117, 9164–9170 CAS.
- J. Zhang, K. Sasaki, E. Sutter and R. R. Adzic, Science, 2007, 315, 220–222 CrossRef CAS PubMed.
- Y. Zhang, Q. Huang, Z. Zou, J. Yang, W. Vogel and H. Yang, J. Phys. Chem. C, 2010, 114, 6860–6868 CAS.
- H. C. Ham, J. A. Stephens, G. S. Hwang, J. Han, S. W. Nam and T. H. Lim, J. Phys. Chem. Lett., 2012, 3, 566–570 CrossRef CAS.
- Y. Suo and I.-M. Hsing, Electrochim. Acta, 2011, 56, 2174–2183 CrossRef CAS PubMed.
- S.-Y. Lee, N. Jung, J. Cho, H.-Y. Park, J. Ryu, I. Jang, H.-J. Kim, E. Cho, Y.-H. Park, H. C. Ham, J. H. Jang and S. J. Yoo, ACS Catal., 2014, 4, 2402–2408 CrossRef CAS.
- J. B. Xu, T. S. Zhao, S. Y. Shen and Y. S. Li, Int. J. Hydrogen Energy, 2010, 35, 6490–6500 CrossRef CAS PubMed.
- M. Simões, S. Baranton and C. Coutanceau, Appl. Catal., B, 2010, 93, 354–362 CrossRef PubMed.
- C. Koenigsmann, E. Sutter, R. R. Adzic and S. S. Wong, J. Phys. Chem. C, 2012, 116, 15297–15306 CAS.
- J. Rossmeisl, A. Logadottir and J. K. Nørskov, Chem. Phys., 2005, 319, 178–184 CrossRef CAS PubMed.
- F. Abild-Pedersen, J. Greeley, F. Studt, J. Rossmeisl, T. R. Munter, P. G. Moses, E. Skulason, T. Bligaard and J. K. Nørskov, Phys. Rev. Lett., 2007, 99, 16105 CrossRef CAS.
- J. K. Nørskov, J. Rossmeisl, A. Logadottir, L. Lindqvist, J. R. Kitchin, T. Bligaard and H. Jonsson, J. Phys. Chem. B, 2004, 108, 17886–17892 CrossRef.
- S. Siahrostami, A. Verdaguer-Casadevall, M. Karamad, D. Deiana, P. Malacrida, B. Wickman, M. Escudero-Escribano, E. A. Paoli, R. Frydendal, T. W. Hansen, I. Chorkendorff, I. Stephens and J. Rossmeisl, Nat. Mater., 2013, 12, 1137–1143 CrossRef CAS PubMed.
- F. Calle-Vallejo, J. I. Martínez, J. M. García-Lastra, E. Abad and M. T. M. Koper, Surf. Sci., 2013, 607, 47–53 CrossRef CAS PubMed.
- F. Calle-Vallejo, J. I. Martinez, J. M. Garcia-Lastra, J. Rossmeisl and M. T. M. Koper, Phys. Rev. Lett., 2012, 108, 116103 CrossRef CAS.
- C.-E. Kim, D.-H. Lim, J. H. Jang, H. J. Kim, S. P. Yoon, J. Han, S. W. Nam, S.-A. Hong, A. Soon and H. C. Ham, J. Chem. Phys., 2015, 142, 034707 CrossRef PubMed.
- Y. Kang, J. Snyder, M. Chi, D. Li, K. L. More, N. M. Markovic and V. R. Stamenkovic, Nano Lett., 2014, 14, 6361–6367 CrossRef CAS PubMed.
- L. Vitos, A. V. Ruban, H. L. Skriver and J. Kollar, Surf. Sci., 1998, 411, 186–202 CrossRef CAS.
- J. Rossmeisl, G. S. Karlberg, T. Jaramillo and J. K. Nørskov, Faraday Discuss., 2008, 140, 337–346 RSC.
- A. S. Bondarenko, I. E. L. Stephens, H. A. Hansen, F. J. Pérez-Alonso, V. Tripkovic, T. P. Johansson, J. Rossmeisl, J. K. Nørskov and I. Chorkendorff, Langmuir, 2011, 27, 2058–2066 CrossRef CAS PubMed.
- V. Tripković, I. Cerri, T. Bligaard and J. Rossmeisl, Catal. Lett., 2014, 144, 380–388 CrossRef.
- J. Mortensen, L. Hansen and K. Jacobsen, Phys. Rev. B: Condens. Matter Mater. Phys., 2005, 71, 035109 CrossRef.
- B. Hammer, L. Hansen and J. Nørskov, Phys. Rev. B: Condens. Matter Mater. Phys., 1999, 59, 7413–7421 CrossRef.
- H. J. Monkhorst, Phys. Rev. B: Condens. Matter Mater. Phys., 1976, 13, 5188 CrossRef.
Footnote |
| † Electronic supplementary information (ESI) available. See DOI: 10.1039/c5cp00071h |
| This journal is © the Owner Societies 2015 |


