 Open Access Article
Creative Commons Attribution 3.0 Unported Licence
A pulsed uniform Laval expansion coupled with single photon ionization and mass spectrometric detection for the study of large molecular aggregates
Bernhard
Schläppi
,
Jessica H.
Litman
,
Jorge J.
Ferreiro
,
David
Stapfer
and
Ruth
Signorell
*
ETH Zürich, Laboratory of Physical Chemistry, Vladimir-Prelog-Weg 2, CH-8093, Zürich, Switzerland. E-mail: rsignorell@ethz.ch
First published on 16th March 2015
Abstract
We report on a new instrument that allows for the investigation of weakly-bound molecular aggregates under equilibrium conditions (constant temperature and pressure). The aggregates are formed in a Laval nozzle and probed with time-of-flight mass spectrometry in the uniform postnozzle flow; i.e. in the equilibrium region of the flow. Aggregates over a very broad size range from the monomer to particle sizes of 10–20 nm can be generated and studied with this setup. Soft ionization of the aggregates is performed with single photons from a homemade vacuum ultraviolet laser. The mass spectrometric detection provides molecular-level information on the size and chemical composition of the aggregates. This new instrument is useful for a broad range of cluster studies that require well-defined conditions.
1. Introduction
Molecular aggregates with sizes ranging from a few molecules per cluster (oligomers) to many nanometers play an important role in planetary and lunar atmospheres and in interstellar space. Such aggregates are relevant for the formation of aerosol and cloud particles in atmospheres, thereby influencing the planet's radiative balance. The properties of weakly-bound neutral molecular aggregates are of special interest in this context since they influence all processes from pre-nucleation and nucleation to growth. However, we are still far from a molecular-level understanding of their influence largely because their characterization is very difficult, not only in atmospheric environments but also in the laboratory. These weakly-bound aggregates are so delicate that their formation under well-defined conditions (temperature, pressure) and their characterization pose significant challenges.In laboratory studies, weakly-bound molecular aggregates are typically generated by expanding molecular and atomic gases through a small nozzle into vacuum (referred to as “free supersonic jets”).1 Even though free jets have been extensively used for cluster formation and successfully combined with various characterization methods they suffer from an intrinsic limitation. Free expansions are non-uniform inevitably resulting in strong anisotropies in temperature, pressure (number density), and velocity in the flow.2 Cluster studies under well-defined (equilibrium) conditions are therefore not possible using free jets. As demonstrated earlier, uniform flows generated by Laval nozzles are an interesting alternative to overcome this limitation.3 The convergent–divergent shape of the Laval nozzle produces a flow with constant Mach number at the nozzle exit. By properly matching the static pressure in the expansion chamber this uniform flow can be maintained after the nozzle over an extended distance. The temperature, pressure (number density), and velocity in this postnozzle flow are constant, which in principle allows for studies under equilibrium conditions.
Continuous and pulsed Laval nozzles have been used to study reaction kinetics of molecules at low temperatures exploiting the thermally equilibrated conditions in the uniform postnozzle flow.3–10 To the best of our knowledge, Leone and co-workers were the first who probed the postnozzle flow using mass spectrometry.6 With respect to the formation of weakly-bound molecular aggregates, Laval nozzles have been combined with various characterization methods. Bartell and co-workers probed the kinetics of freezing clusters formed in a pulsed Laval nozzle with electron diffraction after the nozzle exit.11–15 However, they did not match the static pressure in the expansion chamber so that their postnozzle flow was not uniform. They essentially used the Laval nozzle simply to form large clusters. Wyslouzil and coworkers studied nucleation rates of various substances inside two-dimensional Laval nozzles using neutron scattering,16 X-ray scattering and Fourier transform infrared spectroscopy17 (FTIR). They exploited the characteristic temperature drop inside a Laval nozzle. Similarly, the clustering of UF6 inside a Laval nozzle was probed with FTIR spectroscopy by Takeuchi and coworkers in the mid-90s.18
In this contribution we report on an instrument that allows the characterization of weakly-bound molecular aggregates in the uniform postnozzle flow of a Laval expansion with soft single photon vacuum ultraviolet ionization and mass spectrometric detection. This instrument can be used for aggregate sizes that cover the whole size range from the monomer up to particle sizes of 10–20 nm (several hundred thousand mass units). The uniform postnozzle flow ensures that equilibrium conditions are maintained over an extended distance after the nozzle exit. Single photon vacuum ultraviolet (VUV) ionization close to the ionization threshold ensures that the fragmentation of the weakly-bound aggregates is minimized for a broad range of substances.19–24 Finally, the mass spectrometric detection allows not only to cover an extended cluster size range but it also provides molecular-level information (number of monomers and chemical composition) on smaller and medium-sized clusters through mass resolution.
2. Experimental
Fig. 1 shows a scheme of the experimental setup. The Laval nozzle and proper pressure matching (see below) produce a pulsed uniform low temperature gas flow in the expansion chamber. Part of this pulsed postnozzle flow is sampled by a skimmer and passes through the differential pumping chamber before it enters the ionization/detection chamber. The molecular aggregates are ionized either by resonance-enhanced multiphoton ionization (REMPI) using an ultraviolet (UV) laser with fixed wavelength (266 nm) or by single photon ionization (SPI) using a tunable, table-top vacuum ultraviolet laser at energies between 6 and 18 eV. In contrast to REMPI, SPI enables the ionization of the majority of molecular aggregates and is thus much more broadly applicable. Furthermore, SPI is a soft ionization method for many types of molecular aggregates (see Dong et al.,21 Litman et al.23 and references therein). Fárník and coworkers have very recently demonstrated that in contrast to SPI electron ionization (EI) even with very low kinetic energy electrons (13 eV) leads to substantial destruction of weakly-bound molecular aggregates.24 In our setup, the ionic aggregates are mass separated using a Wiley–McLaren type time-of-flight (TOF) configuration. In order to detect nanometer-sized aggregates with the microchannel plate (MCP) detector, the ion optical assembly has to be designed for high extraction voltages (>20 kV).25 Details of the experimental setup are provided in the subsequent sub-chapters.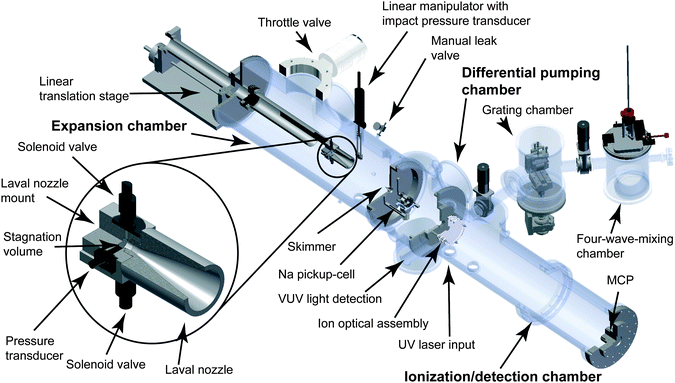 | ||
| Fig. 1 Scheme of the experimental setup. The zoomed-in section shows the cube-shaped Laval nozzle mount. | ||
2.1. Expansion chamber
The Laval nozzle, two pulsed solenoid valves (Parker Hannifin, General Valve series 9) and a pressure transducer (Omega PX170 series) are installed on a cube-shaped mount of similar construction as described earlier (see Lee et al.6). A linear translation stage is used to move the entire mount to change the distance between the nozzle exit and the skimmer. The two pulsed solenoid valves (variable repetition rate, see Section 2.6) with 1 mm orifices feed the 0.9 cm3 stagnation volume of the Laval nozzle. A pressure transducer measures the stagnation pressure p0 in the stagnation volume (stagnation temperature T0). The pulsed solenoid valves are connected to a gas reservoir of a volume of 240 cm3 that contains the sample gas mixtures (typically a condensable gas mixed with a carrier gas). To achieve steady and uniform mixing of the gases, the flow rates of condensable gas and the carrier gases are adjusted by mass flow controllers (MKS Instruments GM50A). For the experiments reported here, we used He (PanGas, 5.0), Ar (PanGas, 5.0), N2 (PanGas, 5.0), Kr (Messer, 5.0), and CO2 (PanGas, 4.5) as carrier or condensable gas and C2H6 (Air Liquide, 99.95%), CH3OCH3 (Air Liquide, 99.9%), and liquid toluene (Sigma Aldrich, >99.7%) as condensable gas.The convergent–divergent shape of the Laval nozzle produces a uniform flow at a constant Mach number at the nozzle exit, which can be extended into the postnozzle region if the pressure in the expansion chamber pexp is matched properly (see below and Fig. 4a). As a result, gradients in temperature, pressure, and velocity are absent in the postnozzle flow and local equilibrium is established. The expansion chamber is a stainless steel chamber (80 cm length and 25 cm diameter) that is pumped by a roots blower (Pfeiffer Octa 2000) which is backed by a rotary piston vacuum pump (Leybold E250) (typical pump speed of 1900 m3 h−1 at 0.1 mbar). Typical chamber pressures during experiments range from pexp = 0.1 to 1 mbar (monitored with a MKS Instruments Baratron 626). The pressures and flow conditions have to be optimized to realize flow uniformity in the postnozzle region. In particular, the pressure in the expansion chamber pexp is required to be approximately equal to the flow pressure pF, which is the static pressure felt in the flow frame. This is achieved by adjusting the carrier gas flow rate, by supplying an additional slip gas into the expansion chamber, and by adjusting the pumping speed using a PID controlled exhaust throttle valve (MKS Instruments 653B), which is located at the entrance of the exhaust line. The slip gas (He or N2) is supplied by a manual leak valve. The pressure in the expansion chamber can be controlled to within better than 0.005 mbar, which allows us to collimate the postnozzle flow over a distance that corresponds to several nozzle diameters (typically over 10–20 cm). Fine control of pexp is of uttermost importance as the uniformity of the postnozzle flow depends sensitively on the chamber pressure.
The pressure transducer (Omega PX170 series) that is mounted on a linear manipulator and located in the postnozzle region serves to measure the impact (or dynamic) pressure pI. By shifting this pressure transducer radially (perpendicular to the flow direction) and moving the nozzle mount axially (in flow direction) one can map pI in the postnozzle region. The Mach number M of the expansion can be determined from pI and from the stagnation pressure p0 with the Rayleigh–Pitot formula:
 | (1) |
 is the ratio of the heat capacities at constant pressure and constant volume, respectively, of the sample gas. Once the Mach number M is known, energy conservation can be employed to obtain a relation between flow temperature TF and stagnation temperature T0:
 | (2) |
 | (3) |
Flow temperatures TF determined as described above have been compared with spectroscopic studies on rotational temperatures of OH radicals by Spangenberg et al.8 Good agreement between the two methods was found in this study. Similar good agreement (less than 10% deviation) was obtained from relative line intensities in LIF spectra of CN radicals.5 Based on these results, we assume that the above described way to determine the relevant expansion characteristics is reasonable.
2.2. Laval nozzle design and manufacturing
To design Laval nozzles and tailor them for our needs, we use interactive software described in detail by Atkinson and Smith.3 It allows one to generate profiles of the divergent part of the nozzle which is then combined with the convergent part. Considerable effort is being made to match the convergent and divergent sections of the profiles to prevent abrupt discontinuities resulting in turbulences. Furthermore, the profiles are smoothened using polynomial fits in order to filter any irregularities and numeric inconsistencies from the nozzle design software. To verify the quality of the designed nozzles, the expansion in the nozzle and in the postnozzle region is simulated with computational fluid dynamics (CFD) software (Fluent ANSYS 14.5). These simulations enable us to characterize the quality of the expansion, to visualize the expansion, and to predict expected changes in the expansion that arise from a change of the carrier gas. Furthermore, the simulations provide us with a set of starting parameters for the experimental refinement of the flow conditions.The Laval nozzles are manufactured in the ETH in-house mechanical workshop: Either the nozzle is produced from a single piece of aluminum or stainless steel using a CNC lathe or the nozzle is printed on a 3D printer (3DSystem Projet 3500 HD) using Visijet X as print material. We estimate the accuracy of the lathed nozzles to be on the order of 50 μm. The 3D printed nozzles are manufactured at a layer resolution of 16 μm. The choice of the nozzle material depends on the properties of the condensable gas in the sample gas mixture used (resistance against corrosives etc.). So far, both ways of nozzle manufacturing have proved equally suitable for our purpose.
2.3. Differential pumping chamber
Part of the uniform postnozzle flow is sampled by a skimmer, which is mounted on the flange that separates the expansion chamber and the differential pumping chamber (Fig. 1). The skimmer is a nickel skimmer of hyperbolic shape with a very thin sharp orifice of 1 mm diameter (Beam Dynamics, Inc., Nr. 2). It is designed to minimize perturbations of the flow during sampling. After the skimmer the beam passes the differential pumping chamber. During operation, the pressure in the differential pumping chamber reaches approximately 2 × 10⁻⁴ mbar, which is achieved with a turbomolecular pump (Pfeiffer TPH 521, 440 l s−1) backed by a scroll pump (Leybold Vacuum SC30D). The differential pumping chamber is separated from the detection/ionization chamber (Fig. 1) by a 6 mm diameter orifice.For the sodium-doping experiments described in Section 3.3, a sodium pick-up cell was installed in the differential pumping chamber. The cell has an entrance and an exit aperture to allow passage of the molecular beam. Doping of the molecular aggregates with a single or a few Na-atoms happens in this pick-up cell (Na, Sigma-Aldrich, 99.0%). By controlling the temperature of the pick-up cell (typically between 433 and 523 K), the vapor pressure of the Na and thereby the degree of doping can be varied. For more details concerning the Na-doping method, we refer the reader to earlier work (Yoder et al.,22 Schläppi et al.25).
2.4. Ionization/detection chamber
The ionization of the molecular aggregates occurs in the ion-optical assembly which is located at the entrance of the 860 mm long TOF tube (Fig. 1a). The ion-optical assembly is a Wiley–McLaren type extractor which is used to (time) focus the ions onto the detector. The detector is an assembly of two microchannel plates (MCP) of 25 mm diameter in chevron configuration and an impedance matched anode (Photonis USA, Inc.; APD 2 APTOF 25/6/5/12 D 60:1 MP EDR). A 500 MHz oscilloscope (LeCroy WaveRunner 6050) is used to record the arrival time of ions relative to the ionization laser pulse. During operation, the pressure in the detection chamber is typically around 1 × 10⁻⁶ mbar (Pfeiffer HiPace 1200 turbomolecular pump backed by a Leybold Vacuum SC30D scroll pump).One of the important features of this setup is the possibility to record cluster ion signals over a very broad mass range (up to several hundred thousand mass units). It is known, that the detection efficiency for large masses (mass to charge ratios) is strongly reduced compared to low masses because it depends on the impact velocity of the ions on the MCPs. This dependence arises from the velocity-dependence of the secondary electron yield,26 which initiates the electron amplification in the ion detection process. We have modified our ion optical assembly and the electrical connections using homebuilt feedthroughs such that we can increase the impact energy up to 30 keV e−1 (e: ion charge). This is essential to detect large masses (typically above a few thousand amu e−1).
With the linear TOF tube, the mass resolution is typically m/Δm = 320 at 2000 amu e−1. This is sufficient to obtain mass resolution and thus molecular-level information on small aggregates (typically < 10![[thin space (1/6-em)]](https://www.rsc.org/images/entities/char_2009.gif) 000 amu e−1, depending on substance). If higher mass resolution is required, the linear TOF tube can be replaced with a commercially available high resolution reflectron (Tofwerk, HTOF, m/Δm = 3000 up to 5000 amu e−1). This is useful for the investigation of multicomponent molecular aggregates, where mass spectra are much more congested.
000 amu e−1, depending on substance). If higher mass resolution is required, the linear TOF tube can be replaced with a commercially available high resolution reflectron (Tofwerk, HTOF, m/Δm = 3000 up to 5000 amu e−1). This is useful for the investigation of multicomponent molecular aggregates, where mass spectra are much more congested.
2.5. Laser light sources
The aggregates are ionized either by resonance enhanced multiphoton ionization (REMPI) with photons from a UV laser or by single photon ionization (SPI) with photons from a home-built VUV laser. For REMPI, the fourth harmonic of a fixed wavelength portable Nd:YAG laser (Quantel Ultra 50) is used to generate 266 nm (4.66 eV) UV photons. This wavelength is sufficient to ionize aromatic hydrocarbons, such as benzene or toluene, by (1 + 1) REMPI. The 266 nm Quantel laser is collimated (not focused!) to a diameter of 1.5 mm at the intersection with the molecular beam. Under these conditions and with moderate laser powers (typically 1 mJ per pulse), REMPI is a relatively soft ionization method even for weakly-bound aggregates.19 However, REMPI is not universally applicable and at 266 nm it is limited to the ionization of a few select compounds.To overcome this limitation, we have built a pulsed, tunable VUV laser light source for SPI that provides energies between 6 and 18 eV.27,28 In contrast to REMPI, SPI with tunable VUV light is a broadly applicable ionization method. Furthermore, it is in general a soft ionization method even for weakly-bound aggregates.19–24 The VUV photons are generated by resonance enhanced 2-color-4-wave mixing in a pulsed supersonic expansion of krypton (Kr) or xenon (Xe) gas generated by a small nozzle (Parker-Hannifin, General Valve series 9). The nozzle is mounted on a 3D movable flange in the four-wave-mixing chamber (Fig. 1). The 2-photon resonances of the noble gases are pumped by the frequency doubled or tripled output of a dye laser (Radiant Dyes Narrow Scan). A second dye laser (Radiant Dyes Narrow Scan) is used to produce the third (tunable from 220–800 nm) pump photon. Both dye laser outputs are tightly focused on the noble gas jet. The two dye lasers are pumped with higher harmonic outputs (532 nm, 355 nm) of a Nd:YAG laser (Continuum Powerlite PR 9020) with a pulse duration of approximately 8 ns (FWHM). The grating chamber (Fig. 1) serves to separate the desired VUV frequency from other frequencies using a stepper-motor driven, toroidal diffraction grating (Horiba Jobin Yvon). A photo-electron multiplier (Hamamatsu R5150-10) with 50 mm2 active area is installed in the ionization/detection chamber in the line of sight of the VUV beam to monitor the light intensity (Fig. 1). The photon flux is estimated to be approximately 1010 photons per pulse.27 Typical pressures in the four-wave-mixing chamber and the grating chamber are 1 × 10⁻⁴ mbar and 2 × 10⁻⁷ mbar, respectively. Turbomolecular pumps (Pfeiffer TPH 521, 440 l s−1 for the four-wave-mixing chamber and Pfeiffer HiPace 300, 260 l s−1 for the grating chamber) backed by a single scroll pump (Leybold Vacuum SC30D) are used to evacuate these chambers.
2.6. Synchronization and timing
For the temporal synchronization of the pulsed Laval expansion and the pulsed lasers, delay generators (Stanford Research Systems DG535 and DG645) are used for external triggering. The system typically runs at 20 Hz, however, the low-density Laval nozzles (i.e. number densities of approximately 1016 cm−3) require low pressures in the Laval expansion chamber (pexp) which is not always compatible with 20 Hz due to the limited pumping capacity. We therefore introduced a pulse skipper between the master delay generator running at the base frequency of 20 Hz and a slave delay generator for the operation of the Laval nozzle running at an integer divider of the base frequency (10, 5, 4, 2 or 1 Hz). In this way, the time integrated flow through the Laval nozzle can be reduced maintaining the same flow rate during each pulse. The master delay generator is used to trigger the flashlamps and the Q-switch of the Nd:YAG laser for VUV light generation and the flashlamps of the 266 nm Quantel laser. The slave generator is used to trigger the pulsed noble gas expansion used in the four-wave-mixing process for VUV light generation, the Q-switch of the 266 nm Quantel laser, and the two pulsed feeding valves of the Laval nozzle. The laser pulses are used as start signal for the TOF mass spectrum. They are measured with the photo-electron multiplier (Hamamatsu R5150-10) and a photodiode (Thorlabs Det10A) for the VUV laser and the 266 nm Quantel laser, respectively. The two lasers can be synchronized by comparing signals from the photo-electron multiplier and the photodiode. Synchronization of the two lasers allows one to probe the same temporal and spatial part of the expansion and thus to compare the corresponding mass spectra.3. Results
3.1. Characterization of the Laval expansion
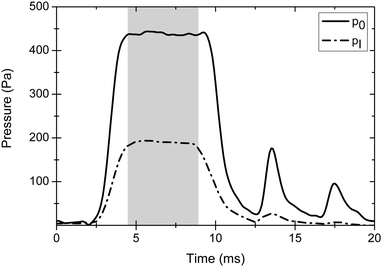
This section describes the experimental characterization of the postnozzle flow based on impact pressure measurements (Section 2.1) and compares typical experimental results with CFD simulations (Section 2.2). Fig. 2 shows typical experimental temporal profiles of the stagnation pressure p0 and the impact pressure pI for a pure argon gas pulse of 5.4 ms nominal duration. The impact pressure transducer was placed in the centre of the postnozzle flow at an axial distance of 40 mm from the nozzle exit. The similar temporal profiles of the two pressure traces demonstrate that both pressures reach steady state conditions on the same time scale. The formation of broad temporal plateaus is essential for a good quality of the pulsed Laval expansion. Other flow properties, such as TF and pF, can be derived from the pressure measurements using eqn (1)–(3).
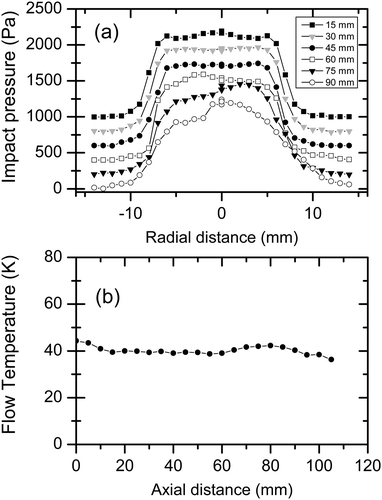
Fig. 3 shows the results from systematic impact pressure measurements along the radial and axial directions for a Mach 4.4 nozzle and an argon–toluene mixture with 1.5% toluene. The average Mach number of 4.4 is determined from the experimental data as described below. The pulse repetition rate was 5 Hz and the expansion chamber pressure was pexp = 0.56 mbar. Fig. 3a shows radial profiles of pI for different axial distances. Except for the larger axial distances, the radial profiles are nicely uniform across the region where uniform flow is expected (radius smaller than 7 mm). The slight perturbation at larger axial distance indicates the expected loss in flow quality with increasing distance from the nozzle exit. The conversion of the measured impact pressures along the central axis (i.e. radial distance 0 mm) yields the flow temperature TF as a function of axial distance from the nozzle exit. Fig. 3b shows that reasonable uniformity of TF over axial distances of more than 8 cm (corresponding to about 4 nozzle diameters) is found. The Mach number of 4.4 ± 0.1 is determined from the experimental results for the argon–toluene mixture as an average of measurements from 0–80 mm axial distance (eqn (1)). The flow temperature TF over the same distance amounts to 40.1 ± 1.9 K (eqn (2)), which corresponds to fluctuations in the impact pressures in the centre of the expansion of approximately 85 Pa or 7.3%. The quality of our Laval expansion is comparable to the best expansions reported in the literature for pulsed Laval nozzles.6,8 Temperature fluctuations in continuously operated Laval expansions are also of comparable magnitude.5 The experimental measurements yield an average flow temperature of 40.1 K, an average number density of nF = 7.5 × 1016 cm−3 (from eqn (3)), and an average flow velocity of approximately 520 ms−1. The uniform flow in Fig. 3 is the result of an experimental optimization during which the fluctuations of  is minimized over the greatest possible axial distance. The repetition rate, the flow rate, the amount of slip gas, and the pumping speed (using the throttle valve) are varied to optimize the conditions. The whole optimization is first carried out with pure carrier gas and then with the desired amount of condensable sample. In most cases, a slight re-optimization after the addition of condensable gases is sufficient to regain uniform postnozzle flows. Note that the expansion chamber pressure pexp is typically slightly higher than the flow pressure pF, in agreement with the results observed and discussed by others (see e.g. Lee et al.6).
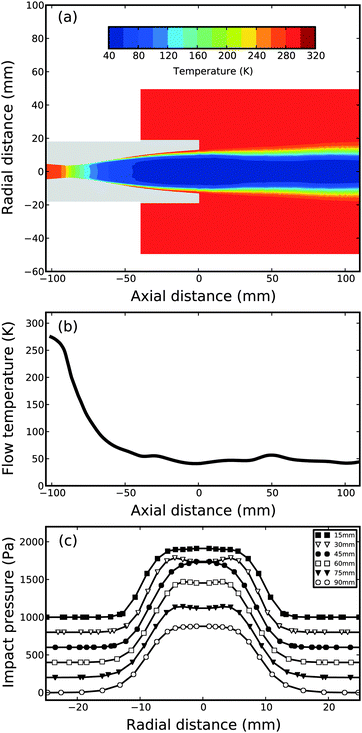
The results of a CFD simulation (Section 2.2) for the same Laval nozzle but with pure argon gas are summarized in Fig. 4. Fig. 4a shows a contour plot of the flow temperature TF inside the nozzle (axial distance < 0 mm) and in the postnozzle region. A uniform postnozzle flow is maintained over several nozzle exit diameters. This is also evident from the corresponding simulated flow temperature which is plotted as a function of axial distance in Fig. 4b. The CFD simulation predicts over an axial distances from 0–100 mm a Mach number of 4.1 ± 0.2, a postnozzle flow temperature of TF = 47.0 ± 4.1 K, and a number density of nF = (1.1 ± 0.2) × 1017 cm−3. The corresponding design values from the interactive software (compare Section 2.2) at the nozzle exit are M = 4.0, TF = 46.6 K, and nF = 1 × 1017 cm−3 for pure argon. As mentioned above, corresponding experimentally determined values lie around M ∼ 4.4, TF ∼ 41.0 K and nF ∼ 7.5 × 1016 cm−3 under the same operating conditions. (Note that the experimental values for pure argon and an argon–toluene mixture of 1.5% are virtually identical.) Such deviations between design, simulation, and experiment are typical for Laval expansions. For completeness, Fig. 4c shows the simulated impact pressure profiles at various axial distances. The trends are very similar to the experimental ones in Fig. 3a.
3.2. Aggregate formation
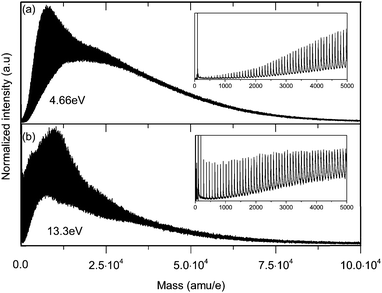
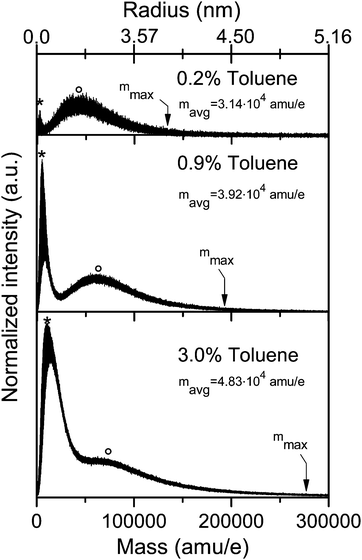
Fig. 5a and b show mass spectra of aggregates that were formed in the argon/toluene Laval expansion discussed in the previous subsection. They were recorded after REMPI and SPI, respectively. The two mass spectra show similar characteristics. Both distributions are bimodal with maxima at approximately the same mass to charge ratio. Toluene is highly supersaturated under the selected experimental conditions so that toluene nucleates and grows in the nozzle (TF = 40.1 ± 1.9 K). We observe bimodal distributions only in highly saturated flows (see for comparison Fig. 6). This is the result of different growth processes which occur under such conditions. These include condensation of gas phase molecules as well as agglomeration and coagulation of existing clusters. Note that detailed mechanisms for such growth processes are in general unknown and can also not be extracted from the mass spectra. The insets of Fig. 5 also reveal that the individual resolved mass peaks correspond to multiples of the molecular mass of toluene. Neither mixed argon–toluene nor pure argon aggregates have been detected. The absence of argon containing aggregates for mixed and pure argon expansions was also confirmed in higher Mach number nozzles; i.e. under even colder conditions. (Note that these studies were performed with 17.5 eV VUV light because the ionization energy of argon monomer is 15.759 eV.29) These observations are consistent with results obtained in cryogenic nucleation pulse chambers and from Laval expansions (see Iland et al.30 and Feldmar et al.31 and references therein), which predict that argon should not nucleate in our Laval expansions. The ionization method (REMPI versus SPI) seems to have an influence on the cluster size distribution (Fig. 5). Part of the deviation arises from the different mass resolution of the two mass spectra due to the different laser spot-sizes. Other effects might arise from differences in the ionization cross sections or from partial cluster decay. Corresponding systematic studies, such as those published by Litman et al.23 and Lengyel et al.,24 are beyond the scope of the present contribution.Fig. 6 and 7 demonstrate how the cluster size distribution can be tuned by varying the expansion conditions. This can either be achieved by changing the Laval nozzle or the operating conditions of a Laval nozzle (carrier gas) or by changing the amount of the condensable gas in the sample gas mixture. As an example, Fig. 6 shows how the cluster size distribution can be tuned by changing the toluene content in an argon/toluene expansion. Similar to Fig. 5, bimodal distributions of toluene aggregates are observed. The most abundant cluster sizes of the two bands of the bimodal distributions (asterisk and circles, respectively), the total average cluster size (mavg), and the maximum cluster size (mmax) clearly increase with increasing toluene content.
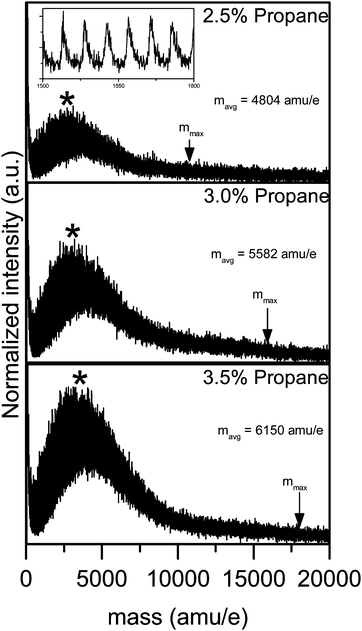 | ||
| Fig. 7 Mass spectra of small aggregates generated in a mixed argon–propane flow (M = 4.0 ± 0.1, TF = 47.1 ± 1.2 K and nF = 6.3 × 1016 cm−3) using different relative propane concentrations recorded after SPI. The labels are the same as in Fig. 6. The strong mass peak at very low mass is monomer. The inset shows that all cluster mass peaks are resolved. | ||
Fig. 7 provides example mass spectra of propane clusters recorded under conditions where growth processes such as coagulation of clusters do not yet take place. These cluster distributions do not show bimodal features as observed in Fig. 5 and 6. The size distribution clearly changes with changing concentration of the condensable gas. Note that for the three spectra in Fig. 7 only the concentration of the propane changes but not the temperature or the density in the flow. The observed growth in cluster size originates only from a change in saturation at constant temperature. We find a similar sensitive behaviour by changing the carrier gas composition under otherwise identical conditions, i.e. for the same propane concentration and the same total density (data not shown). In this case the change in cluster sizes originates from a change in saturation at constant pressure. Small temperature differences down to about 1 K can be realized for example by adding a few percent of N2 to the Ar carrier gas. As expected, colder expansions produce larger clusters. The very small temperature changes allow us to modify the cluster size distributions very sensitively. Note that the minor change in the carrier gas composition only changes the temperature and not the type of collisions since the large majority of collisions are still with Ar atoms. We have performed a series of systematic studies in which we demonstrate how the cluster size can be tuned systematically by tuning the flow temperature (results will be provided in a forthcoming publication). The results in Fig. 5 to 7 demonstrate that clusters over a very broad size range can be formed in Laval expansions and can be detected with mass spectrometry. The variation of the expansion conditions allows us to tune the size from monomer only, to small oligomers, and even to very large clusters very sensitively. To the best of our knowledge this is the first time such cluster studies have been demonstrated in Laval nozzles.
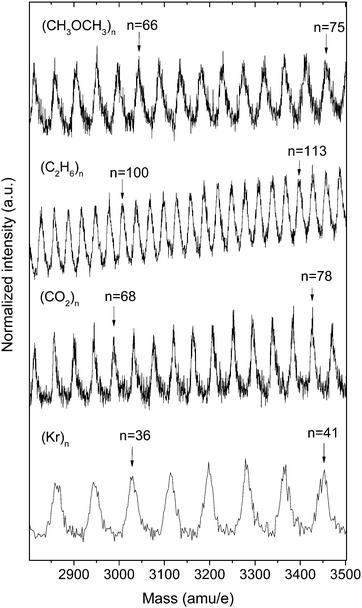
Finally, Fig. 8 illustrates the broad applicability of Laval nozzles combined with SPI and mass spectrometric detection for the formation of molecular aggregates of various chemical compositions for the example of dimethylether (CH3OCH3), ethane (C2H6), carbon dioxide (CO2) and krypton (Kr). All mass spectra were recorded after VUV ionization with photons of 13.3 eV energy. For the first three compounds, argon was used as a carrier gas, while pure krypton was expanded to form krypton aggregates. These examples demonstrate that in principle chemical information on the cluster composition can be obtained from the mass spectra. To determine the composition of mixed clusters, a higher mass resolution than the one in Fig. 8 might be required.
3.3. Evidence for thermal equilibrium
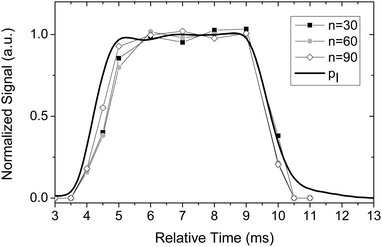
For gas expansions, equilibrium is established for the monomers in the uniform postnozzle flow of a Laval nozzle. However, it is not a priori clear that larger clusters also reach thermal equilibrium with the surrounding gas. This aspect is investigated in the present subsection. Stable cluster size distributions in the (temporal and spatial) regions where the Laval expansion is uniform provide evidence that the clusters are in thermal equilibrium with the surroundings. Clusters that are not in thermal equilibrium would shrink or grow during the expansion pulse or change with changing spatial position. Fig. 9 illustrates the change in cluster size distribution during the expansion pulse. For this purpose, we have recorded mass spectra of toluene clusters during the gas pulse by changing the relative timing between the trigger of the feeding nozzles and the laser pulse. From these spectra we have determined the temporal intensity profile of different cluster sizes. The corresponding results for clusters with 30, 60, and 90 toluene molecules per cluster are depicted in Fig. 9 together with the temporal profile of the impact pressure. The impact pressure was determined as described for Fig. 2. The intensity profiles of the clusters show a temporal profile almost identical to the one obtained for the impact pressure. In particular, the cluster size distribution is stable in the plateau region (5–9 ms), which clearly hints at stable cluster conditions during this time. The agreement of the impact pressure trace and the mass spectrometric data also shows that the sampling at the skimmer does not perturb the flow. The ion signals and the impact pressure return to the baseline after the pulse. Problems with sampling at the skimmer were previously reported by Soorkia et al.7 A similar measurement showed a significant broadening and a long tail (>20 ms) of the ion signal compared to the pressure trace. These effects were interpreted by the authors as a result of “perturbation in the Laval expansion by thermalized gases that accumulate around the skimmer”. With our setup, we never observed this problem, which clearly demonstrates that in our case sampling at the skimmer does not perturb the flow.In a second series of experiments we have investigated the change in cluster size distribution as a function of the axial distance of the skimmer from the nozzle exit in the postnozzle flow region. Clusters detected at larger axial distances have spent a longer time in the postnozzle flow region; i.e. under equilibrium conditions. If equilibrium for clusters were not reached after the nozzle one would expect to record different cluster size distributions with varying axial distance. For this purpose, mass spectra of a cluster distribution were recorded as a function of the axial distance after the nozzle. The relative intensities of clusters with 5 and 50 (In=5/In=50) and 10 and 50 (In=10/In=50) toluene molecules, respectively, and absolute intensity of the cluster that corresponds to the maximum of the distribution (referred to as “mode intensity”) were extracted from these mass spectra and plotted in Fig. 10. In addition to these intensities the mass of the maximum of the cluster size distribution (referred to as “mode mass”) is displayed as a function of the axial position. (Note that all values are normalized to their respective average between 20 and 80 mm.) All values are nearly constant (less than 10% variation) over a fairly large distance between 20 and 80 mm, i.e. over the region where the postnozzle flow is uniform (see Fig. 3b). Again, the fact that the cluster size distribution is stable in the uniform flow region clearly hints at stable cluster conditions over this region. The slight deviations at short axial distances agree with deviations found in the flow temperature profile in Fig. 3b. Either a minor disturbance caused by the nozzle exit or a minor disturbance resulting from the close proximity of nozzle exit and skimmer flange could be potential explanations for this observation. At large distances, the mass distribution changes because the expansion begins to disintegrate slowly (Fig. 3b). Obviously, the cluster size distribution seems to be very sensitive to the prevailing conditions. Stable cluster size distributions are thus a strong indication that thermal equilibrium is indeed reached in the uniform postnozzle flow right after the nozzle exit.
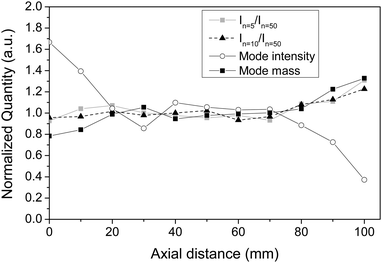 | ||
| Fig. 10 Characteristic quantities extracted from mass spectra of toluene clusters recorded as a function of the axial distance from the nozzle exit (see Fig. 4a). Same experimental conditions as in Fig. 3. The mass spectra were recorded after REMPI. | ||
Further clear evidence for thermal equilibrium of clusters comes from an estimate of the number of collisions a molecular aggregate experiences. A simple estimate of the collision rate in the region where the flow temperature strongly decreases in the Laval nozzle (from −100 to −50 mm in Fig. 4b) is difficult. However, it is clear that most of the collisions and cooling already happen in this region inside the Laval nozzle (see Fig. 4b). Even if we neglect the large number of collisions in this region and only include estimates for the number of collisions in the region where the flow temperature is approximately constant (above −50 mm in Fig. 4b), we end up with collision numbers that are at least equal to collision numbers in ion traps, for which thermal equilibrium for larger systems has been spectroscopically proven.32–34 This can be seen by the following example. For a single toluene molecule we estimate a collision frequency of roughly 2.5 × 10⁷ s−1 in the region above −50 mm (Fig. 4b). Combining this with the flow speed (520 ms−1 for the M = 4.4 nozzle, see Section 3.1) and the distance over which the flow temperature is approximately constant before the nozzle exit (from −50 mm to 0 mm, see Fig. 4b), we determine the number of collisions for a single toluene molecule to be on the order of 2 × 10³ in the region where the final temperature has almost been reached (above −50 mm). Note that collisions with the carrier gas dominate over collisions between toluene molecules. For a molecular cluster with a diameter of 2.5 nm (corresponding to ∼48 molecules), this number scales accordingly and amounts to more than 3 × 10⁴ collisions (more than many hundred collisions per molecule). Results from ion traps show that it requires approximately 2 × 10³ collisions with He bath gas atoms to cool and thermalize a (H2O)−48 anion cluster to 120 K; i.e. several ten collisions per molecule.32 For a molecular aggregate of about 200 molecules (diameter ∼ 4 nm) the number of collisions exceeds 105 in our Laval nozzle, which again corresponds to more than several hundred collisions per molecule. Once more, the total number of collisions in the Laval nozzle is much higher (by several orders of magnitude) because the large number of collisions at the beginning of the nozzle (between −100 and −50 mm in Fig. 4b) are not even considered in this estimate. In addition, the collisions after the nozzle exit, i.e. in the postnozzle flow, are also not yet considered in our simple estimation. We would like to note that spectroscopic studies to prove equilibrium as (rarely) performed in ion traps32–34 cannot be performed for our broad cluster distributions. The cluster spectra are congested with many bands from all cluster sizes which cannot be assigned and which make it impossible to identify hot bands. Equilibrium conditions for monomers in Laval expansions have already been proven experimentally.5,8 Together with the experimental observations described above, these estimates and comparisons with ion trap results provide clear evidence that the aggregates in the uniform postnozzle flow are indeed in thermal equilibrium with the surrounding gas.
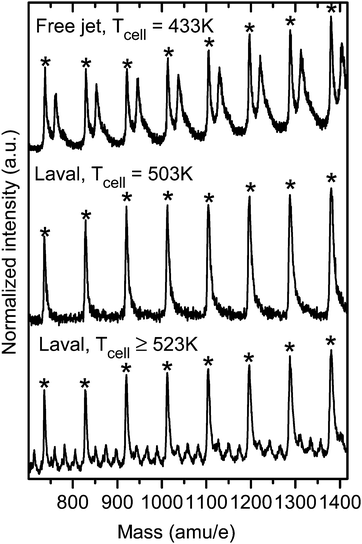
Fig. 11 illustrates the difference with respect to collisions with the carrier gas between a free supersonic expansion and a uniform Laval expansion. For this purpose, the Na-doping cell was installed in the differential pumping chamber (Section 2.3) and heated to temperatures between 373 and 523 K and the same measurements were performed once with a Laval nozzle and once with a simple free jet nozzle attached to the expansion chamber. Temperatures of the Na-doping cell between 373 and 523 K correspond to a variation in the Na vapor pressure between 1.8 × 10⁻⁷ to 2.7 × 10⁻³ mbar. Molecular aggregates that pass the Na-doping cell pick up many more Na atoms per cluster at higher Na vapor pressures than at lower pressures. In a free jet, the collision frequency with the carrier gas is negligible after a few nozzle diameters (typically a few mm), i.e. at the position where the Na-doping cell is located.22,23,25 As a consequence, all Na atoms that are picked up by a cluster formed in a free jet will stay attached to the cluster until they are ionized and can thus be detected in the mass spectrum. In the Laval expansion, by contrast, the many collisions with the carrier gas that occur in the region between the Na-doping cell and the ionization remove a large fraction of the Na atoms that were originally picked up by the clusters in the Na-doping cell. Under the same experimental conditions (cell temperature), clusters with fewer Na atoms should thus be detected in the mass spectrum of the Laval expansion compared with the mass spectrum of the free jet expansion. This is illustrated in Fig. 11 for toluene clusters that were ionized with the 266 nm Quantel laser. The mass peaks labelled with asterisks are REMPI peaks of undoped clusters (no Na attached). The mass peaks at 23 mass units higher that are visible in the free jet mass spectrum (top trace) are clusters that have picked-up a single Na atom. As can be seen, single Na pick up is efficient in the free jet expansion at a cell temperature of about 433 K (Na vapor pressure of about 1.3 × 10⁻⁵ mbar). At higher temperatures, mass peak that correspond to multiple Na pick-up become increasingly dominant (spectra not shown). In the Laval nozzle, by contrast, only bare clusters with no Na atom attached are detected up to a cell temperature of about 503 K (Na pressure of about 1.0 × 10⁻³ mbar) as a consequence of the many collisions with the carrier gas (middle trace in Fig. 11). Temperatures around 523 K are required to detect any Na-doped clusters in the Laval expansion. The bottom trace shows an example for which multiple Na-doping is visible. The comparison of the top spectrum with the middle and the bottom spectrum nicely visualizes the fundamentally different environment in a free supersonic jet expansion (non-equilibrium) compared with a Laval expansion (equilibrium).
4. Conclusions
We have combined uniform Laval expansions with single photon VUV ionization and linear time of flight mass spectrometry for the generation and characterization of weakly-bound molecular aggregates under equilibrium conditions (constant temperature and pressure). The temperature, the pressure, the concentration, and the size of the aggregates can be tuned by using different Laval nozzles and by varying the flow conditions. This allows one to study properties of molecular aggregates under well-defined conditions over a wide range of sizes from the monomer up to particles of 10–20 nm in diameter. This size range is of great importance for various atmospheric processes including new aerosol particle formation. Potential applications of the new instrument include fundamental studies of nucleation from the gas phase. For such investigations three features of the new setup are crucial: the possibility to realize well-defined tunable conditions (pressure, temperature), the option to detect clusters over a wide size range in a single experiment, and the fact that molecular-level information on the aggregates can be extracted from the mass spectra. More generally, the new instrument is useful for all studies on molecular aggregates that require well-defined conditions; e.g. for temperature-dependent and size-dependent cluster investigations.Acknowledgements
We are very grateful to Dr. Kevin Wilson and Dr. Jordy Bouwman from the Lawrence Berkeley National Laboratory for the opportunity to perform test measurements with their setup. We gratefully acknowledge Prof. M. A. Smith at the University of Arizona for providing his software to design Laval nozzles. We thank Markus Kerellaj and Markus Steger from the LPC shops for their assistance in developing the experimental setup. Financial support was provided by the ETH Zürich and the Swiss National Science Foundation (SNF project no. 200021_146368). JL acknowledges funding through an NSERC graduate fellowship.References
- S. B. Ryali and J. B. Fenn, Bunsenges. Phys. Chem. Ber., 1984, 88, 245–253 CrossRef CAS.
- L. K. Randeniya and M. A. Smith, J. Chem. Phys., 1990, 93, 661–673 CrossRef.
- D. B. Atkinson and M. A. Smith, Rev. Sci. Instrum., 1995, 66, 4434 CrossRef CAS.
- B. R. Rowe, J.-B. Marquette and C. Rebrion, J. Chem. Soc., Faraday Trans., 1989, 85, 1631–1641 RSC.
- I. R. Sims, J. L. Queffelec, A. Defrance, C. Rebrion-Rowe, D. Travers, P. Bocherel, B. R. Rowe and I. W. M. Smith, J. Chem. Phys., 1994, 100, 4229 CrossRef CAS.
- S. Lee, R. J. Hoobler and S. R. Leone, Rev. Sci. Instrum., 2000, 71, 1816 CrossRef CAS.
- S. Soorkia, C.-L. Liu, J. D. Savee, S. J. Ferrell, S. R. Leone and K. R. Wilson, Rev. Sci. Instrum., 2011, 82, 124102 CrossRef.
- T. Spangenberg, S. Köhler, B. Hansmann, U. Wachsmuth, B. Abel and M. A. Smith, J. Phys. Chem. A, 2004, 108, 7527–7534 CrossRef CAS.
- E. Vöhringer-Martinez, B. Hansmann, H. Hernandez, J. S. Francisco, J. Troe and B. Abel, Science, 2007, 315, 497–501 CrossRef.
- M. Liessmann, B. Hansmann, P. G. Blachly, J. S. Francisco and B. Abel, J. Phys. Chem. A, 2009, 113, 7570–7575 CrossRef CAS.
- L. S. Bartell, R. K. Heenan and M. Nagashima, J. Chem. Phys., 1983, 78, 236 CrossRef CAS.
- E. J. Valente and L. S. Bartell, J. Chem. Phys., 1983, 79, 2683 CrossRef CAS.
- L. S. Bartell and R. J. French, Rev. Sci. Instrum., 1989, 60, 1223 CrossRef CAS.
- L. S. Bartell and T. S. Dibble, J. Phys. Chem., 1991, 95, 1159–1167 CrossRef CAS.
- T. S. Dibble and L. S. Bartell, J. Phys. Chem., 1992, 96, 2317–2322 CrossRef CAS.
- Y. J. Kim, B. E. Wyslouzil, G. Wilemski, J. Wölk and R. Strey, J. Phys. Chem. A, 2004, 108, 4365–4377 CrossRef CAS.
- H. Laksmono, S. Tanimura and B. E. Wyslouzil, J. Chem. Phys., 2011, 135, 074305 CrossRef.
- S. Tanimura, Y. Okada and K. Takeuchi, J. Phys. Chem., 1996, 100, 2842–2848 CrossRef CAS.
- C. Bobbert, S. Schütte, C. Steinbach and U. Buck, Eur. Phys. J. D, 2002, 19, 183–192 CAS.
- S. Schütte and U. Buck, Int. J. Mass Spectrom., 2002, 220, 183–192 CrossRef.
- F. Dong, S. Heinbuch, J. J. Rocca and E. R. Bernstein, J. Chem. Phys., 2006, 124, 224319 CrossRef CAS.
- B. L. Yoder, J. H. Litman, P. W. Forysinski, J. L. Corbett and R. Signorell, J. Phys. Chem. Lett., 2011, 2, 2623–2628 CrossRef CAS.
- J. H. Litman, B. L. Yoder, B. Schläppi and R. Signorell, Phys. Chem. Chem. Phys., 2013, 15, 940–949 RSC.
- J. Lengyel, A. Pysanenko, V. Poterya, J. Kočišek and M. Fárník, Chem. Phys. Lett., 2014, 612, 256–261 CrossRef CAS.
- B. Schläppi, J. J. Ferreiro, J. H. Litman and R. Signorell, Int. J. Mass Spectrom., 2014, 372, 13–21 CrossRef.
- G. W. Fraser, Int. J. Mass Spectrom., 2002, 215, 13–30 CrossRef CAS.
- P. W. Forysinski, P. Zielke, D. Luckhaus and R. Signorell, Phys. Chem. Chem. Phys., 2010, 12, 3121–3130 RSC.
- B. L. Yoder, A. H. C. West, B. Schläppi, E. Chasovskikh and R. Signorell, J. Chem. Phys., 2013, 138, 044202 CrossRef.
- L. Minnhagen, J. Opt. Soc. Am., 1973, 63, 1185–1198 CrossRef CAS.
- K. Iland, J. Wölk, R. Strey and D. Kashchiev, J. Chem. Phys., 2007, 127, 154506 CrossRef.
- L. M. Feldmar, J. Wölk and R. Strey, AIP Conf. Proc., 2013, 1527, 15–18 CrossRef CAS.
- A. Piechaczek, PhD thesis, University of Freiburg, 2013.
- O. V. Boyarkine, personal communication.
- O. V. Boyarkine and V. Kopysov, Rev. Sci. Instrum., 2014, 85, 033105 CrossRef.
| This journal is © the Owner Societies 2015 |

