 Open Access Article
Creative Commons Attribution 3.0 Unported Licence
The structures of hexadecylamine films adsorbed on iron-oxide surfaces in dodecane and hexadecane
Michael
Doig
and
Philip J.
Camp
*
School of Chemistry, University of Edinburgh, David Brewster Road, Edinburgh, EH9 3FJ, Scotland, UK. E-mail: philip.camp@ed.ac.uk
First published on 21st January 2015
Abstract
Molecular-dynamics simulations are used to gain insights on recent sum-frequency spectroscopy and polarised neutron reflectometry measurements of the structure of hexadecylamine films adsorbed on iron-oxide surfaces in dodecane and hexadecane. Simulations were carried out under quiescent and high-shear conditions. Mass-density profiles, molecular-height and molecular-orientation probability distribution functions, and in-layer radial distribution functions were calculated. The simulation results show that at high surface coverage, the film thickness is about 15 Å, and that the molecules are mainly pointing upwards from the surface at an angle of 40–50°. The results are compared critically against published experimental results, and the agreement is found to be good. The in-layer ordering of the hexadecylamine head-group atoms is found to be dictated by the crystalline structure of the iron-oxide surface, but this influence rapidly diminishes along the molecular backbone. The tail-group atoms show almost no positional ordering. Finally, an example calculation of the kinetic friction coefficient under high-shear conditions is presented. The lateral (friction) force is measured as a function of the normal (applied) force, and the kinetic friction coefficient is determined to be about 0.09, which is typical for this kind of system.
1 Introduction
Controlling the adsorption of surfactant molecules at solid–oil interfaces is important for a wide range of technological applications. For instance, oil recovery from reservoirs is enhanced by adding surfactants that lower the oil–water interfacial tension, but the competing adsorption on solid surfaces such as clays leads to retention in the reservoir and this can limit efficiency.1,2 Adsorption at solid–oil interfaces is required for the control of friction, wear, and lubrication in combustion engines. In typical engine applications, the surfactants are relatively simple aliphatic chains with polar head groups, such as carboxylic acids, amines, and their derivatives. The solid surface is usually quite heterogeneous, consisting of a metal (such as iron) and its oxides,3,4 or glassy polyphosphate phases formed from zinc dialkyldithiophosphate (ZDDP), an anti-wear agent added to lubricants.Surfactant adsorption at the solid–oil interface has received far less attention than at the solid–water interface.5–9 Clearly, the structural and tribological properties of surfactants adsorbed at the solid–oil interface are extremely complex, and depend on many critical factors such as surface composition and chemistry, oil composition, surface roughness, pressure, and shear rate. As a result, it is crucial to explore each of these factors in isolation and under controlled conditions. Experimental and computational studies of surfactant adsorption at the solid–oil interface, and in some cases the effects on tribology, have been reported in the literature.10–20 Some of the most detailed structural investigations of structure in surfactant films involve techniques such as sum-frequency spectroscopy (SFS) and polarised neutron reflectometry (PNR). Using such techniques, it is possible to probe the thickness of the adsorbed film and the average orientation of the molecules. For example, the adsorption of hexadecanoic acid [CH3(CH2)14COOH] on to iron-oxide surfaces from hexadecane was examined using PNR.17 The surfactant was seen to form two adlayers: the first layer was dense, tilted, and with a thickness of around 16 Å; the existence of a second layer was assumed in order to fit the reflectometry results, but the apparent concentration was much lower, and the thickness was 35–45 Å depending on the bulk-solution concentration. The adsorptions of the corresponding amine – hexadecylamine [CH3(CH2)15NH2] – on to iron-oxide surfaces from dodecane and hexadecane have recently been examined using SFS and PNR.19 Although hexadecylamine is a cationic surfactant in aqueous solution, in oil it is expected to remain unprotonated due to charge separation being unfavourable in low-polarity media. Water impurities could lead to amine protonation, but these are kept at low levels. The adsorption isotherm from dodecane shows that surface concentrations of up to Γ = 5 × 10⁻⁶ mol m−2 can be achieved. SFS and PNR measurements show that at Γ = 2.26 × 10⁻⁶ mol m −2 and Γ = 4.05 × 10⁻⁶ mol m−2, the layer thickness is (16 ± 3) Å, while at Γ = 4.41 × 10⁻⁶ mol m−2 and Γ = 5.46 × 10⁻⁶ mol m−2, it is (20 ± 3) Å. The experimental uncertainty is comparable to the difference between the two quoted values of layer thickness. Additional complications include the surface roughness (estimated to be about 5 Å) and that the adsorbed molecules may penetrate the porous oxide surface. The length of an extended hexadecylamine molecule is about 21.5 Å,21 on which basis the molecular tilt angles in 16 Å and 20 Å films are expected to be 42° and 22°, respectively. An assumption of the analysis is that the monolayer is dense and that there is little orientational disorder in the film; this assumption is unlikely to hold at lower surface concentrations. In this work, atomistic molecular-dynamics (MD) simulations are used to study the microscopic structure of hexadecylamine adsorbed on to iron oxide from dodecane and hexadecane. The results complement those from experiments,19 and shed light on the structures over a broad range of surface concentrations.
MD simulations have been used before to provide insight on the structures and properties of adsorbed surfactant films at the solid–oil interface, the main motivation being to understand the tribological properties. For instance, atomistic simulations have been used to study structure and friction in confined hydrocarbons,22,23 ZDDP in hexadecane confined between iron-oxide surfaces,24 and silane monolayers between silica surfaces.25–27 Doig et al. have recently examined, in detail, the structure and friction of stearic acid and oleic acid films adsorbed on iron-oxide surfaces in squalane.28 The current work contributes new information on the structures of hexadecylamine films at the solid–oil interface, and makes direct contact with recent experimental studies.19 This is achieved by calculating a wide variety of structural functions, including the surfactant and lubricant contributions to the mass-density profiles, the specific locations of the head-group atoms binding to the surface, and molecular-height and molecular-orientation probability distributions. The in-layer structure is explored using two-dimensional radial distribution functions. Finally, in one example, the frictional force is calculated under high-shear conditions as a function of the applied load, and the kinetic friction coefficient is determined by fitting the results with the extended Amontons–Coulomb law.
The simulation model and methods are summarised in Section 2, the results are presented in Section 3, and Section 4 concludes the article.
2 Simulation model and methods
Atomistic MD simulations were performed using LAMMPS.29,30 Two α-Fe2O3 (haematite) slabs with the (100) faces exposed were simulated in a cuboidal box with periodic boundary conditions applied. The hexagonal unit-cell properties of haematite are a = b = 5.038 Å, c = 13.772 Å, α = β = 90°, and γ = 120°.31 The slabs were oriented in the laboratory frame (x,y,z) such that the unit-cell vectors b‖y and c‖x. The x × y × z dimensions of each slab were 55.09 × 50.38 × 8.61 Å, and each slab contained 2400 atoms. The (100) surfaces of the slabs were put in contact with a layer of 340–500 dodecane or hexadecane lubricant molecules, and various numbers of hexadecylamine surfactant molecules, so that the total number of carbon atoms was roughly constant; the exact numbers are given in Table 1. (The hexadecylamine and dodecane/hexadecane molecules are referred to as surfactant and lubricant, respectively, while acknowledging that in applications, the surfactant is a component of the lubricant.) With the periodic boundary conditions applied, this corresponds to a layer of lubricant confined in the z direction by the two interior (100) surfaces of the slabs in the xy plane. The number of lubricant molecules was sufficiently large so that there was no contact between the two adsorbed surfactant films. The number of surfactant molecules adsorbed on each interior surface was varied in order to span an experimentally relevant range of surface coverages: a high surface coverage of Γ = 2.99 × 10⁻⁶ mol m−2 or 1.80 nm−2 corresponds to 50 surfactant molecules per surface; 33 surfactant molecules per surface gives an intermediate surface coverage of Γ = 1.97 × 10⁻⁶ mol m−2 or 1.19 nm−2; and a low surface coverage of Γ = 1.02 × 10⁻⁶ mol m−2 or 0.61 nm−2 involves 17 surfactant molecules per surface. Initial configurations of surfactant and lubricant molecules were generated using Packmol.32,33 Some tests were carried out with equilibrated solutions of surfactant molecules in lubricant, which were then put in contact with the solid surfaces to allow adsorption to occur. This was a very slow process, but eventually the surfactant molecules formed uniform monolayers on the surfaces. No self-assembly of the hexadecylamine surfactants was observed in the solutions, which is to be contrasted with the formation of reverse micelles by other friction modifiers such as glycerol derivatives.34–37| N s | N l | Γ/mol m−2 | Γ/nm−2 | ρ 0/g cm−3 | z 0/Å | ξ/Å | 〈h〉/Å | 〈θ1,8〉/° | 〈θ1,16〉/° | 〈R1,16〉/Å |
|---|---|---|---|---|---|---|---|---|---|---|
| Dodecane T = 298 K | ||||||||||
| 34 | 500 | 1.02 × 10⁻⁶ | 0.61 | 0.038(1) | 12.2(1) | 4.0(1) | 7.0 | 28 | 23 | 15.7 |
| 66 | 500 | 1.97 × 10⁻⁶ | 1.19 | 0.100(2) | 14.04(8) | 3.45(9) | 9.6 | 36 | 30 | 16.8 |
| 100 | 450 | 2.99 × 10⁻⁶ | 1.80 | 0.194(1) | 14.57(3) | 2.71(4) | 11.9 | 41 | 39 | 17.5 |
| Hexadecane T = 313 K | ||||||||||
| 34 | 400 | 1.02 × 10⁻⁶ | 0.61 | — | — | — | 5.4 | 27 | 18 | 16.2 |
| 66 | 400 | 1.97 × 10⁻⁶ | 1.19 | — | — | — | 9.3 | 37 | 31 | 16.7 |
| 100 | 340 | 2.99 × 10⁻⁶ | 1.80 | — | — | — | 9.7 | 38 | 31 | 16.4 |
The atomic interactions of the iron-oxide slabs were given by the Lennard-Jones (LJ) and Coulomb potentials with parameters defined by Berro et al.24 The interactions of the surfactant and lubricant molecules were given by the OPLS-AA force field38 adapted to amines by Price et al.39 The partial charges on the atoms are given in Table 2. LJ cross interactions were evaluated using the Lorentz–Berthelot mixing rules. All LJ interactions were cut off at 10 Å and the long-range Coulomb interactions were handled using a slab-adapted particle–particle particle–mesh method, designed to cancel out interactions between periodic images in the z direction.
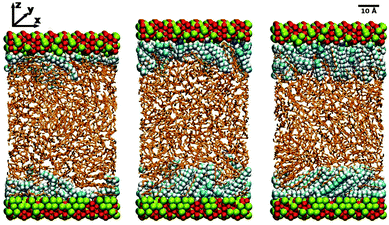
MD simulations were performed under constant-load conditions by applying a net normal force (in the z direction) on to the atoms in one of the surfaces, and holding the other surface fixed. The corresponding pressure is then P = FN/A, where FN is the force, and A = 2775 Å2 is the area of a surface. Most simulations were performed at P = 1 atm; frictional forces were also studied under higher loads, but this is described separately in Section 3.6. Constant temperatures of T = 298 K for dodecane and T = 313 K for hexadecane were maintained using a Nosé–Hoover thermostat. (The higher temperature of hexadecane was necessary to overcome the melting temperature of the simulation model: the experimental melting temperature is T = 291 K.40) The MD equations of motion were integrated with the velocity-Verlet algorithm and a timestep of 1 fs. Some simulation snapshots of hexadecylamine adsorbed on iron oxide in dodecane are shown in Fig. 1. (The apparent disorder of the Fe and O atoms is just due to where the simulation box and applied periodic boundary conditions cut the instantaneous atomic configuration.)
3 Results
3.1 Mass-density profiles
Fig. 2 shows the local mass-density profiles of the atoms in the hexadecylamine and lubricant molecules as functions of the vertical distance z from the top-most layer of surface atoms, at three surface coverages and with each lubricant (dodecane at T = 298 K or hexadecane at T = 313 K). Fig. 2(a)–(c) shows the results with dodecane. At the highest surface coverage (Γ = 1.80 nm−2), the hexadecylamine profile shows two strong peaks at z ≃ 1.0 Å and 2.4 Å, a small peak at z ≃ 7.0 Å, and a broad shoulder out to z ≃ 10 Å, followed by a gradual decay out to z ≃ 20 Å. The first three peaks in the profile indicate layering of the component atoms, and this occurs near the ‘heads’ of the molecules that are anchored to the surface; the decay of the profile shows that the tails extend in to the lubricant layer, but that there is very little ordering of the tails of the molecules. The dodecane profile overlaps with the tail of the hexadecylamine profile, showing that the two species interdigitate.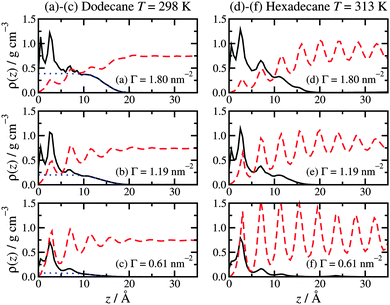 | ||
| Fig. 2 Atomic mass-density profiles of the hexadecylamine molecules (black solid lines) and lubricant molecules (red dashed lines) as a function of distance z from the surface, with different lubricants: (a)–(c) dodecane lubricant at T = 298 K; (d)–(f) hexadecane lubricant at T = 313 K. In (a)–(c), the blue dotted lines are fits to the hexadecylamine profiles for z ≥ 10 Å using eqn (1). | ||
The tails of the hexadecylamine profiles can be fitted using the function
 | (1) |
The situation changes substantially on altering the lubricant from dodecane to hexadecane: see Fig. 2(d)–(f). Here the hexadecane shows strong layering at all surface coverages due to its higher melting temperature. The surfactant profiles are not markedly different from those in dodecane, except that the structure in the range z ≥ 7.0 Å is more pronounced, due to the indirect effect of the stronger layering of the penetrating lubricant. The oscillations in the density profile over this range preclude fitting with eqn (1).
The overall picture is that at high surface coverage, the surfactant film is a densely packed monolayer, with the head groups strongly anchored to the surface, and the molecules pointing predominantly away from the surface. Excluded-volume intermolecular interactions favour ordered arrangements of molecules in extended conformations, since these fill space most efficiently. The lubricant layer penetrates slightly in to the surfactant film: in the case of dodecane lubricant, the broad interface between the two layers leads to a lack of structure in the lubricant; in the case of hexadecane, there is already strong layering. As the surface coverage is decreased, the surfactant molecules tend to adopt less linear conformations. As the excluded-volume interactions decrease with decreasing surface coverage, the molecules gain more conformational freedom, and adopt disordered (and hence entropically favoured) non-linear conformations. Accompanying this transformation, the lubricant penetrates further in to the surfactant film, and due to the resulting proximity to the rigid, crystalline surface, it develops a more layered structure (which applies to both dodecane and hexadecane).
3.2 Binding of head groups to the surface
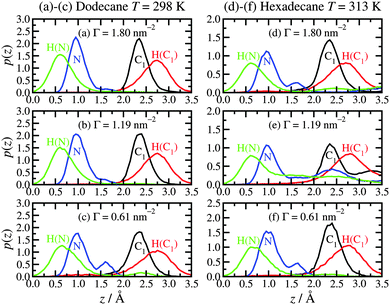
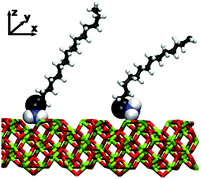
The physisorption of the head groups to the surface can be explored in detail using the probability distribution p(z) of the height z of each atom from the surface, namely the nitrogen (N), the amine hydrogens [H(N)], the adjacent carbon (C1), and its associated hydrogens [H(C1)]. Fig. 3 shows the results for both dodecane lubricant at T = 298 K [(a)–(c)] and hexadecane lubricant at T = 313 K [(d)–(f)]. In the case of dodecane, the N and C1 atoms are strongly localised at heights of z ≃ 1.0 Å and 2.4 Å, respectively. The locations of these ‘heavy’ atoms are entirely consistent with the positions of the first two peaks in the mass-density profiles shown in Fig. 2. The H(N) atoms are located at z ≃ 0.7 Å, while the H(C1) are located at z ≃ 2.8 Å. These results suggest that the two H(N) atoms and the N atom coordinate to the surface trigonally, with the N–C bond (with equilibrium length 1.448 Å38) almost perpendicular to the surface. Looking more closely at the probability distributions for the N atoms, there are small peaks at z ≃ 1.7 Å. These correspond to the situations where one of the amine hydrogens desorbs from the surface, leaving the other N–H bond perpendicular to the surface. Correspondingly, the H(N) distributions show very small features at distances z>1.7 Å. A simulation snapshot showing simultaneous examples of these conformations is shown in Fig. 4; all other surfactant and lubricant molecules are omitted.The situation is qualitatively the same in hexadecane at T = 313 K, except that the head-group adsorption is clearly less strong. In particular, all of the distributions are much broader, and there is evidence for partial and complete desorption of the head group. Simulation movies show that hexadecylamine molecules do not completely desorb from the film and in to the lubricant; rather, a head group detaches, remains trapped within the film, and later readsorbs. Overall, then, the hexadecylamine film is less rigid and more fluxional in hexadecane at T = 313 K than in dodecane at T = 298 K. This is most likely a thermal effect rather than a chemical effect.
3.3 Height of the adsorbed film
The height of the adsorbed film can be characterised by the perpendicular distance, h, of the terminal carbon atoms (C16) from the surface. The probability distribution function p(h) is shown in Fig. 5. The results in dodecane lubricant at T = 298 K [(a)–(c)] and hexadecane lubricant at T = 313 K [(d)–(f)] for a given surface coverage are very similar, showing that the details of the head-group binding discussed above do not strongly influence the maximum heights of the adsorbed molecules. At high surface coverage (Γ = 1.80 nm−2) there is a broad feature in the h = 10–20 Å range, and a broad tail down to h = 0. Most of the molecules, therefore, are pointing ‘upwards’ with respect to the surface. At low surface coverage (Γ = 0.61 nm−2) p(h) shows a slow decay over the h = 0–20 Å range, corresponding to the terminal methyl group lying either directly on the surface or on top of other molecules. At intermediate surface coverage (Γ = 1.19 nm−2) the probability distribution is in between these two extremes.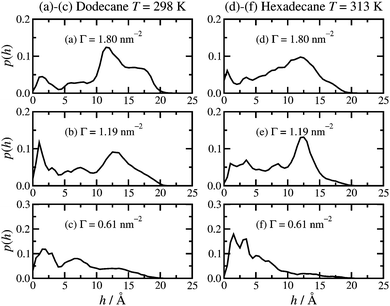 | ||
| Fig. 5 Molecular height probability distribution functions: (a)–(c) dodecane lubricant at T = 298 K; (d)–(f) hexadecane lubricant at T = 313 K. | ||
Both the height distribution p(h) and the density profiles ρ(z) fall rapidly at z, h = 15–20 Å. This range is probably the most natural measure of the film height, and it is in good agreement with experiment. Wood et al. report film thicknesses of (16 ± 3) Å and (20 ± 3) Å at comparable surface concentrations.19 The average value of h is reported in Table 1. This quantity is considerably lower than the apparent film height, because of fluctuations in the molecular conformation; at any instant, some molecules will be in bent conformations.
3.4 Molecular orientation and conformation
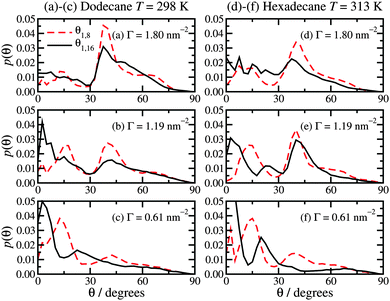
The molecular orientations are characterised by the distribution function of the angle θ between the surface and the molecular backbone, defined as either the vector from C1 to C8 (θ1,8) or from C1 to the terminal C16 (θ1,16). θ = 0° means that the molecule is lying flat on the surface, and θ = 90° means that it is pointing straight upwards. Fig. 6 shows the results, which for a given surface coverage are basically the same in both dodecane at T = 298 K and hexadecane at T = 313 K. At the highest surface concentration (Γ = 1.80 nm−2), the distribution of θ1,8 shows a clear peak at around 40°, a broad shoulder at around 60°, and a small peak at about 15°. The distribution of θ1,16 looks similar, but with less structure. This must be due to there being more orientational order in the half of the molecule nearest to the surface, while the tails show more conformational freedom. This corresponds well with the density profiles in Fig. 2(a) and (c), and molecular height distributions in Fig. 5(a) and (c), which show a strongly ordered inner layer (extending out to around 10 Å) and a disordered outer part (in the range 10–20 Å). At the lowest surface concentration (Γ = 0.61 nm−2), the most probable angles are θ1,8 ≃ 15° and 45°, and θ1,16 ≃ 3° and 23°. At an intermediate surface concentration Γ = 1.19 nm−2, the angular distributions are between the two extremes. These results help to consolidate the overall picture that at high surface concentrations, the molecules are pointing away from the surface, while at low surface concentrations they tend to lie flat. The average angles are given in Table 1. In dodecane at T = 298 K, 〈θ1,8〉 and 〈θ1,16〉 are within about 5° of one another. The overall results at the highest surface concentration are in broad agreement with experiments. For surface coverages of 2.26 × 10⁻⁶ mol m−2 and 4.05 × 10⁻⁶ mol m−2 – which bracket the highest surface coverage here – the tilt angle with respect to the surface is 48°.19 This is only 8° greater than the average values reported for Γ = 2.99 × 10⁻⁶ mol m−2 in Table 1. It has to be acknowledged, though, that the experimental determination of these quantities is difficult and subject to large uncertainties, and also that no simulation model is ever going to be perfect. To sum up, simulation and experiment show that in a densely packed adsorbed film, the molecules are generally pointing at 40–50° from the surface normal. The trends in the average angles in hexadecane at T = 313 K are practically the same as those in dodecane, and like-for-like comparisons show differences of no more than 8°.The molecular end-to-end distance R1,16 is given in Table 1. This is defined as the distance between the head-group carbon atom (C1) and terminal carbon atom (C16). In all cases, this distance is 16–17 Å. In dodecane at T = 298 K, R1,16 increases slightly with surface coverage, except that in dodecane at T = 298 K, it appears that R1,16 increases slightly with increasing surface coverage, presumably due to the stronger packing constraints within a more densely packed film. The results conform to the approximate relationship 〈h〉 ≃ R1,16sin〈θ1,16〉, give or take an ångström or two to account for the height of the C1 atom above the surface.
As an aside, the probability distributions of C–C–C–C dihedral angles on the surfactant molecules, p(ϕ), are almost independent of position along the molecular backbone, surface coverage, and lubricant. The results are standard,41,42 and are not shown here. In general, there are two sharp peaks at ϕ = 60°, 300° (gauche conformation), a much stronger peak at ϕ = 180° (anti conformation), and minima (p ≃ 0) at 0°, 120°, and 240°. In dodecane at T = 298 K, the integrated probability of all dihedrals in the range 120° ≤ ϕ ≤ 240° (corresponding to the anti conformation) is 0.78 at Γ = 0.61 nm−2, 0.80 at Γ = 1.19 nm−2, and 0.82 at Γ = 1.80 nm−2. This is consistent with the slight elongation of the molecules with increasing surface coverage. The terminal dihedral (C13–C14–C15–C16) shows slightly less anti conformation (consistently about 70%), in agreement with experiments43 and simulations41,42 on bulk liquid hydrocarbons.
3.5 In-layer positional ordering
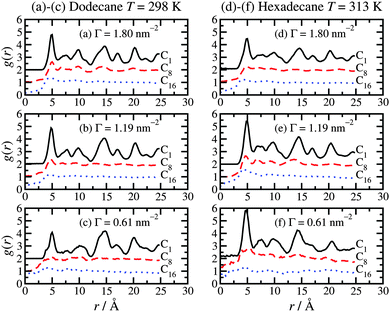
To complete the analysis of the molecular-scale structure of the adsorbed hexadecylamine film, Fig. 7 shows the in-layer radial distribution function (RDF), g(r), for the C1, C8, and C16 atoms. These are calculated by projecting the positions of the atoms in each layer on to the plane of the layer (xy plane) and calculating the two-dimensional RDF in the usual way.44 In Fig. 7, RDFs are shifted upwards by one or two units for clarity. All of the results show the same basic trends. The C1 atoms show long-range ordering due to the coordination of the amine head groups to particular lattice sites in the surface. Hence, the in-layer ordering of these atoms is dictated by the iron-oxide structure. The primary peak is located at r = 5 Å, which coincides with the unit-cell distance b of haematite.31 The C8 atoms show considerably weaker positional correlations, with a small peak at r = 5 Å, and weak features at larger distances. The C16 atoms show even weaker correlations. These functions give an idea of the distances over which the head-group coordination to the crystalline surface dictates the in-layer ordering in the tails. Overall, it seems that this influence is strongly diminished from half-way along the molecule, starting from the head group.3.6 Kinetic friction coefficient
In earlier work on stearic acid and oleic acid adsorbed on iron-oxide surfaces in squalane,28 the kinetic friction coefficient μ was calculated in simulations by sliding the oxide walls at a fixed relative velocity, and measuring the average lateral force (FL) and normal force (or load, FN) exerted on them. In general, these forces are related by the extended Amontons–Coulomb law| FL = F0 + μFN | (2) |
![[small gamma, Greek, dot above]](https://www.rsc.org/images/entities/i_char_e0a2.gif) = v/L on the order of 109 s−1, where v is the relative sliding velocity, and L is the separation between the walls. (The shear-rate dependence of μ has been discussed fully in ref. 28, and is found to be logarithmic.) Calculations were carried out here with a fixed sliding velocity in the x direction of v = 10 m s−1 and average wall separations in the z direction ranging from L = 92.3 Å at the lowest load to L = 83.7 Å at the highest load; the corresponding range of shear rates is therefore
= v/L on the order of 109 s−1, where v is the relative sliding velocity, and L is the separation between the walls. (The shear-rate dependence of μ has been discussed fully in ref. 28, and is found to be logarithmic.) Calculations were carried out here with a fixed sliding velocity in the x direction of v = 10 m s−1 and average wall separations in the z direction ranging from L = 92.3 Å at the lowest load to L = 83.7 Å at the highest load; the corresponding range of shear rates is therefore ![[small gamma, Greek, dot above]](https://www.rsc.org/images/entities/i_char_e0a2.gif) = (1.08–1.19) × 109 s−1. These are nominal shear rates because the surfactant molecules are strongly adsorbed on to the surface, and hence the effective liquid-film thickness is less than L; the actual shear rate is about 10% higher than the nominal value. Unless kept in check with a thermostat, shearing leads to energy dissipation and heating of the system. To maintain a constant temperature, the Nosé–Hoover thermostat was applied only in the y direction, so that it did not affect the velocity profile in the xz plane. The results are shown in Table 3 and plotted in Fig. 8.
= (1.08–1.19) × 109 s−1. These are nominal shear rates because the surfactant molecules are strongly adsorbed on to the surface, and hence the effective liquid-film thickness is less than L; the actual shear rate is about 10% higher than the nominal value. Unless kept in check with a thermostat, shearing leads to energy dissipation and heating of the system. To maintain a constant temperature, the Nosé–Hoover thermostat was applied only in the y direction, so that it did not affect the velocity profile in the xz plane. The results are shown in Table 3 and plotted in Fig. 8.
![[small gamma, Greek, dot above]](https://www.rsc.org/images/entities/i_char_e0a2.gif) = v/L) are also shown in the table
= v/L) are also shown in the table
| (FN/A)/atm | (FL/A)/atm | L/Å |
![[small gamma, Greek, dot above]](https://www.rsc.org/images/entities/i_char_e0a2.gif) /109 s−1 /109 s−1 |
|---|---|---|---|
| 1 | 0.064 ± 0.143 | 92.3 | 1.08 |
| 10 | 1.187 ± 1.517 | 91.7 | 1.09 |
| 50 | 4.412 ± 5.993 | 91.4 | 1.09 |
| 100 | 8.833 ± 9.581 | 91.2 | 1.10 |
| 500 | 26.795 ± 18.300 | 88.2 | 1.13 |
| 1000 | 88.450 ± 20.970 | 83.7 | 1.19 |
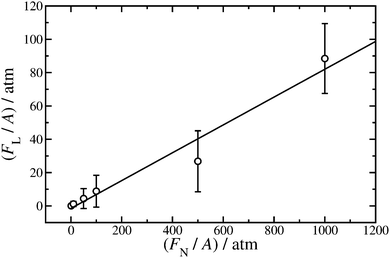 | ||
Fig. 8 Lateral force (FL) as a function of applied load (FN) exerted on the iron-oxide walls of cross-sectional area A. Hexadecylamine is adsorbed on to the walls at surface coverage Γ = 1.80 nm−2, the lubricant is dodecane at T = 298 K, and the shear rate is in the range ![[small gamma, Greek, dot above]](https://www.rsc.org/images/entities/i_char_e0a2.gif) = (1.08–1.19) × 109 s−1. The points are from simulations, and the straight line is a fit using eqn (2). = (1.08–1.19) × 109 s−1. The points are from simulations, and the straight line is a fit using eqn (2). | ||
Fitting eqn (2) to the results gives F0/A = (−1.5 ± 3.9) atm and μ = 0.0835 ± 0.0086. The Derjaguin offset is small enough that if only the highest load is considered (FN/A = 1000 atm), then μ = 0.088 ± 0.021, which is in good agreement with the result from the fit. This justifies the approach used in ref. 28 where FN/A = 1000 atm throughout. The value of μ obtained here for hexadecylamine in dodecane is somewhat lower than that of stearic acid or oleic acid in squalane at the same load and shear rate (μ≃ 0.25) due to the higher viscosity of squalane (a branched molecule).
4 Conclusions
In this work, molecular dynamics computer simulations were used to provide complementary structural information on hexadecylamine (surfactant) adsorbed on iron-oxide surfaces in dodecane and hexadecane (lubricants). The motivation for this work was a recent experimental study on these systems using sum-frequency spectroscopy and polarised neutron reflectometry. Accordingly, simulations were carried out under similar conditions of surface coverage, temperature, and pressure.In general, the simulation results are in good accord with the experimental measurements. Specifically, at the highest surface coverage (1.80 molecules per nm2) the surface film is between 15 Å and 20 Å thick, which agrees well with the experimental values of (16 ± 3) Å and (20 ± 3) Å at similar surface coverages. In addition to reproducing experimental measurements, the simulations give insights on the interpenetration of the surfactant and lubricant layers, and the distribution of molecular conformations with respect to the surface. At high surface coverages the molecules are more upright, while at low surface coverages they lie more flat on the surface. The specific binding mode of the hexadecylamine to the surface was found to involve the amine nitrogen and hydrogen atoms coordinated to positively and negatively charged sites in the surface, respectively. The adjacent methylene carbon atom is not observed to bind directly to the surface. At the highest surface concentration, the average molecular tilt angle with respect to the surface is found to be about 40°. This is consistent with the corresponding experimental estimate of 48° under similar conditions, given that this is extremely difficult to determine accurately. The in-layer ordering in the hexadecylamine film was characterised by appropriate two-dimensional radial distribution functions. These show that the head-group positions are dictated by lattice sites of the surface, but that this positional ordering is strongly diminished for atoms between the middle of the molecule and the tail. Finally, the kinetic friction coefficient at a high shear rate was determined by measuring the lateral friction force as a function of the applied load. The expected linear relationship between the two was confirmed, yielding a kinetic friction coefficient of about 0.09, which is typical for the situation under consideration.
Acknowledgements
This research was supported by BP International Ltd through the generous provision of computer time on the BP High Performance Computing facility in Houston, USA. The authors are grateful to BP staff Mary Jane Angelo, Keith Gray, David Lewis, and Rene Salmon for computing support, and Chris Warrens for discussions.References
- Y. Wu, S. Iglauer, P. Shuler, Y. Tang and W. A. Goddard, Tenside, Surfactants, Deterg., 2011, 48, 346–358 CrossRef CAS.
- D. L. Geatches, A. Jacquet, S. J. Clark and H. C. Greenwell, J. Phys. Chem. C, 2012, 116, 22365–22374 CAS.
- T. Szauer and A. Brandt, Electrochim. Acta, 1981, 26, 1209–1217 CrossRef CAS.
- M. Klokkenburg, J. Hilhorst and B. H. Erné, Vib. Spectrosc., 2007, 43, 243–248 CrossRef CAS PubMed.
- R. Atkin, V. S. J. Craig, E. J. Wanless and S. Biggs, Adv. Colloid Interface Sci., 2003, 103, 219–304 CrossRef CAS.
- S. Paria and K. C. Khilar, Adv. Colloid Interface Sci., 2004, 110, 75–95 CrossRef CAS PubMed.
- C. Gutig, B. P. Grady and A. Striolo, Langmuir, 2008, 24, 4806–4816 CrossRef CAS PubMed.
- M. T. L. Casford and P. B. Davies, ACS Appl. Mater. Interfaces, 2009, 1, 1672–1681 CAS.
- N. R. Tummala, L. Shi and A. Striolo, J. Colloid Interface Sci., 2011, 362, 135–143 CrossRef CAS PubMed.
- M. L. Gee, P. M. McGuiggan, J. N. Israelachvili and A. M. Homola, J. Chem. Phys., 1990, 93, 1895–1906 CrossRef CAS PubMed.
- B. B. Luokkala, S. Garoff and R. M. Suter, Phys. Rev. E: Stat. Phys., Plasmas, Fluids, Relat. Interdiscip. Top., 2000, 62, 2405–2415 CrossRef CAS.
- C. A. Bearchell, T. N. Danks, D. M. Heyes, D. J. Moreton and S. E. Taylor, Phys. Chem. Chem. Phys., 2000, 2, 5197–5207 RSC.
- C. A. Bearchell, D. M. Heyes, D. J. Moreton and S. E. Taylor, Phys. Chem. Chem. Phys., 2001, 3, 4774–4783 RSC.
- M. X. Ramírez, D. E. Hirt and L. L. Wright, Nano Lett., 2002, 2, 9–12 CrossRef.
- Y. Zhu, H. Ohtani, M. L. Greenfield, M. Ruths and S. Granick, Tribol. Lett., 2003, 15, 127–134 CrossRef CAS.
- L. Serreau, M. Beauvais, C. Heitz and E. Barthel, J. Colloid Interface Sci., 2009, 332, 382–388 CrossRef CAS PubMed.
- M. Campana, A. Teichert, S. Clarke, R. Steitz, J. R. P. Webster and A. Zarbakhsh, Langmuir, 2011, 27, 6085–6090 CrossRef CAS PubMed.
- D. Savio, N. Fillot, P. Vergne and M. Zaccheddu, Tribol. Lett., 2012, 46, 11–22 CrossRef CAS.
- M. H. Wood, R. J. L. Welbourn, T. Charlton, A. Zarbakhsh, M. T. Casford and S. M. Clarke, Langmuir, 2013, 29, 13735–13742 CrossRef CAS PubMed.
- D. Langevin, Annu. Rev. Fluid Mech., 2014, 46, 47–65 CrossRef.
- D. Gidalevitz, Z. Huang and S. A. Rice, Biophys. J., 1999, 76, 2797–2802 CrossRef CAS.
- I. M. Sivebaek, V. N. Samoilov and B. N. J. Persson, Langmuir, 2010, 26, 8721–8728 CrossRef CAS PubMed.
- I. M. Sivebaek, V. N. Samoilov and B. N. J. Persson, Phys. Rev. Lett., 2012, 108, 036102 CrossRef CAS.
- H. Berro, N. Fillot and P. Vergne, Tribol. Int., 2010, 43, 1811–1822 CrossRef CAS PubMed.
- O. A. Mazyar, G. K. Jennings and C. McCabe, Langmuir, 2009, 25, 5103–5110 CrossRef CAS PubMed.
- J. B. Lewis, S. G. Vilt, J. L. Rivera, G. K. Jennings and C. McCabe, Langmuir, 2012, 28, 14218–14226 CrossRef CAS PubMed.
- J. L. Rivera, G. K. Jennings and C. McCabe, J. Chem. Phys., 2012, 136, 244701 CrossRef PubMed.
- M. Doig, C. P. Warrens and P. J. Camp, Langmuir, 2014, 30, 186–195 CrossRef CAS PubMed.
- S. Plimpton, J. Comput. Phys., 1995, 117, 1–19 CrossRef CAS.
- LAMMPS Molecular Dynamics Simulator, http://lammps.sandia.gov.
- R. L. Blake, R. E. Hessevick, T. Zoltai and L. W. Finger, Am. Mineral., 1966, 51, 123–129 CAS.
- L. Martínez, R. Andrade, E. G. Birgin and J. M. Martínez, J. Comput. Chem., 2009, 30, 2157–2164 CrossRef PubMed.
- Packmol, http://www.ime.unicamp.br/%E2%88%BCmartinez/packmol/.
- L. K. Shrestha, O. Glatter and K. Aramaki, J. Phys. Chem. B, 2009, 113, 6290–6298 CrossRef CAS PubMed.
- L. K. Shrestha, R. G. Shrestha, M. Abe and K. Ariga, Soft Matter, 2011, 7, 10017–10024 RSC.
- R. G. Shrestha, L. K. Shrestha, K. Ariga and M. Abe, J. Nanosci. Nanotechnol., 2011, 11, 7665–7675 CrossRef CAS PubMed.
- L. K. Shrestha, R. G. Shrestha, K. Aramaki, J. P. Hill and K. Ariga, Colloids Surf., A, 2012, 414, 140–150 CrossRef CAS PubMed.
- W. L. Jorgensen, D. S. Maxwell and J. Tirado-Rives, J. Am. Chem. Soc., 1996, 118, 11225–11236 CrossRef CAS.
- M. L. P. Price, D. Ostrovsky and W. L. Jorgensen, J. Comput. Chem., 2001, 22, 1340–1352 CrossRef CAS.
- W. M. Haynes, CRC Handbook of Chemistry and Physics, CRC Press, Taylor & Francis Group, Boca Raton, FL, 94th edn, 2013 Search PubMed.
- S. W. I. Siu, K. Pluhackova and R. A. Böckmann, J. Chem. Theory Comput., 2012, 8, 1459–1470 CrossRef CAS.
- X. Ye, S. Cui, V. F. de Almeida and B. Khomami, J. Mol. Model., 2013, 19, 1251–1258 CrossRef CAS PubMed.
- H. L. Casal and H. H. Mantsch, J. Mol. Struct., 1989, 192, 41–45 CrossRef CAS.
- M. P. Allen and D. J. Tildesley, Computer simulation of liquids, Clarendon Press, Oxford, 1987 Search PubMed.
| This journal is © the Owner Societies 2015 |

