
 Open Access Article
 This Open Access Article is licensed under a
 Creative Commons Attribution 3.0 Unported Licence
Hole injection dynamics from two structurally related Ru–bipyridine complexes into NiOx is determined by the substitution pattern of the ligands†
Maximilian
Bräutigam
ab,
Joachim
Kübel
ab,
Martin
Schulz
ab,
Johannes G.
Vos
c and
Benjamin
Dietzek
*abde
aLeibniz Institute of Photonic Technology (IPHT) Jena e. V., Albert-Einstein-Str. 9, 07745 Jena, Germany. E-mail: benjamin.dietzek@ipht-jena.de
bInstitute for Physical Chemistry and Abbe Center of Photonics, Friedrich-Schiller University Jena, Helmholtzweg 4, 07743 Jena, Germany
cSRC for Solar Energy Conversion, School of Chemical Sciences, Dublin City University, Dublin 9, Ireland
dJena Center for Soft Matter, Friedrich-Schiller University Jena, Lessingstraße 8, 07743 Jena, Germany
eCenter for Energy and Environmental Chemistry Jena (CEEC), Philosophenweg 7a, 07743 Jena, Germany
First published on 9th February 2015
Abstract
The dyes bis[2,2′-bipyridine][4,4′-dicarboxy-2,2′-bipyridine]ruthenium(II) dihexafluorophosphate, [Ru(bpy)2dcb](PF6)2 (Ru1), and tris[4,4′-bis(ethylcarboxy)-2,2′-bipyridine]ruthenium(II) dihexafluorophosphate, [Ru(dceb)3](PF6)2 (Ru2), attached to NiOx nanoparticle films were investigated using transient absorption and luminescence spectroscopy. In acetonitrile solution the dyes reveal very similar physical and chemical properties, i.e. both dyes exhibit comparable ground state and long-lived, broad excited state absorption. However, when immobilized onto a NiOx surface the photophysical properties of the two dyes differ significantly. For Ru1 luminescence is observed, which decays within 18 ns and ultrafast transient absorption measurements do not show qualitative differences from the photophysics of Ru1 in solution. In contrast to this the luminescence of photoexcited Ru2 on NiOx is efficiently quenched and the ultrafast transient absorption spectra reveal the formation of oxidized nickel centres overlaid by the absorption of the reduced dye Ru2 with a characteristic time-constant of 18 ps. These findings are attributed to the different localization of the initially photoexcited state in Ru1 and Ru2. Due to the inductive effect (−I) of the carboxylic groups, the lowest energy excited state in Ru1 is localized on the dicarboxy-bipyridine ligand, which is bound to the NiOx surface. In Ru2, on the other hand, the initially populated excited state is localized on the ester-substituted ligands, which are not bound to the semiconductor surface. Hence, the excess charge density that is abstracted from the Ru-ion in the metal-to-ligand charge-transfer transition is shifted away from the NiOx surface, which ultimately facilitates hole transfer into the semiconductor.
Introduction
The immobilization of photosensitizers and photocatalysts onto semiconductor nanoparticle films is a promising route towards the combination of molecular components (and with it the potential of molecular design) with the electronic and photophysical properties and the structural stability of solid materials. One option to exploit the benefits of molecularly sensitized semiconductors is the development of photo-catalytically active electrode materials.1,2 In these devices, the semiconductors either play the role of antenna systems in enhancing the effective absorption cross section of the attached photocatalysts or they function as acceptor materials for electrons (n-type semiconductor) or holes (p-type semiconductors). In the latter function, the oxidized or reduced sensitizers can act as oxidation or reduction catalysts, respectively.3–7 However, arguably the most important example is the development of dye-sensitized solar cells (DSCs).8 After the seminal report on this technology by Grätzel and co-workers the concept of DSCs has developed from an interesting scientific concept into a promising technology to produce low-cost, low-weight solar cells for integration into buildings and for use as decentralized electrical power devices. The first DSCs reported were based on TiO2 photoanodes sensitized with RuII-complexes.9 Since then a variety of photoanode materials has been reported and extensive research has been carried out to substitute the rare-earth containing dyes by sensitizers not containing expensive metals.10 Here, the most promising candidates contain tri-phenylamine moieties.11–13 In addition to optimizing the photoanode, tandem DSCs can be designed, which combine photoanodes with photocathodes thereby increasing the accessible open-circuit voltage of the devices.14,15 Research on photocathode materials is currently almost exclusively based on NiOx as a p-type semiconductor material, since it is inexpensive, accessible and exhibits the appropriate electrochemical properties.16A variety of other design-parameters impact the overall performance of a DSC or a photocatalytic electrode, including the overall long-term stability under operating conditions and the choice of the redox mediator. Particular emphasis is put on studies of the kinetics of the photoinduced electron or hole injection as this presents the initial step in the overall charge-separation process. For TiO2-surfaces functionalized with molecular sensitizers the initial charge injection from the photoexcited dye into the conduction band of the semiconductor can occur as rapid as sub-50 fs.8 In addition to this, charge injection from non-thermally relaxed, vibrational hot excited states has been observed on the ps timescale and these are responsible for up to 40% (RuN3|TiO2) of the overall injected charges.17 In the case of RuN3 [cis-diisothiocyanato-bis(2,2′-bipyridyl-4,4′-dicarboxylic acid) ruthenium(II)] it has been established that interligand hopping can critically impact the overall charge transfer efficiency by determining the rate of the electron injection from thermally relaxed 3MLCT (triplet metal-to-ligand charge-transfer) states into the conduction band of TiO2.18 This points to the fact that localization of the initially photoexcited MLCT state within the molecular framework and its orientation with respect to the semiconductor surface plays an important role in optimizing the function of molecular sensitizers for DSCs.
Several studies were performed to transfer the advantageous properties of Ru dyes, when used to sensitize n-type semiconductors, to p-type NiOx photoelectrodes. These advantages are in particular the long-lived photoexcited charge-transfer state (3MLCT), the chemical stability, and the tunability of the molecular and electronic structure. In order to understand hole injection dynamics from Ru-type dyes into NiOx nanoparticle films, different dye systems have been investigated. For example, studies on cyclometalated Ru-complexes with different spacer lengths were performed and these show hole injection into NiOx within 10 and 50 ps depending on the number of phenylene-spacer units and a multi-exponential recombination from the 100 ps to ns regime.19 A RuII–naphthalenediimide dyad has been shown to form the charge-separated state [NiO(h+)–RuII–NDI−] within 1.1 ps.20 A study dealing with a structurally more complex Ru-based donor–acceptor photosensitizer, where an electron-accepting group, 4-nitronaphthalene-1,8-dicarboximide (NMI), is attached to the phenanthroline of [Ru(dcb)2(NMI-phen)]2+, reports a fast injection in ∼1 ps—a value that is based on indirect spectroscopic evidence.21 Aside from spectroscopic studies on Ru dyes on NiOx surfaces the injection of electrons from NiOx nanoparticles into organic dyes has been studied and is found to be generally fast (∼1 ps).15,22–27
The existing studies on Ru-sensitizer functionalized NiOx surfaces generally deal with structurally more complex Ru dyes but – to the best of our knowledge – no measurements on Ru(bpy)32+-type ‘building blocks’ were reported so far. In this contribution, the dyes bis[2,2′-bipyridine][4,4′-dicarboxy-2,2′-bipyridine]ruthenium(II) dihexafluorophosphate, [Ru(bpy)2dcb](PF6)2 (Ru1), and tris[4,4′-bis(ethylcarboxy)-2,2′-bipyridine]ruthenium(II) dihexafluorophosphate, [Ru(dceb)3](PF6)2 (Ru2), were chosen and spectroscopically studied when attached to NiOx nanoparticle films. The purpose of this study is to investigate the influence of the different ligands on the hole injection rate. The redox potentials of both dyes are comparable (ERu1III/II = 1.31 V,28ERu2III/II = 1.30 V29) and match the valance band potential of NiOx with 0.37 V.‡30 Thus, hole injection is energetically possible in both cases.
In this study ultrafast transient absorption spectroscopy is utilized to unravel the hole injection from two RuII–bipyridine-derived dyes into nanoparticulate NiOx films. The focus on this study is on the sub-100 ps dynamics of hole injection, i.e. a kinetic window which has not been as intensively exploited as for example the ns- to μs-range. While the latter is of particular interest for the recombination kinetics, the sub-100 ps processes are relevant to describe the forward reaction, i.e. the initial charge separation across the molecular–semiconductor interface. Mechanistic differences in the photophysics of the dye-sensitized surfaces are discussed and substantiated by attenuated total reflection-Fourier transform infrared spectroscopy (ATR-FTIR) measurements showing information on binding geometries.
Experimental section
Investigated dyes
The two ruthenium dyes bis[2,2′-bipyridine][4,4′-dicarboxy-2,2′-bipyridine]ruthenium(II) dihexafluorophosphate, [Ru(bpy)2dcb](PF6)2 (Ru1), and tris[4,4′-bis(ethylcarboxy)-2,2′-bipyridine]ruthenium(II) dihexafluorophosphate, [Ru(dceb)3](PF6)2 (Ru2), were investigated on NiOx. Both dyes were available from earlier studies.31,32Dye-sensitized NiOx surfaces
The synthesis of the NiOx surfaces was performed with minor alterations of the protocol described in the literature.33,34 The polymer–NiCl2 solution was spin coated onto the glass substrate and burned in a furnace at 450 °C for 30 min.35 The NiOx films used here were produced by a second spin-coating/burning step.34 After cleaning the NiOx surface with deionized water (MilliQ) the films were soaked in acetonitrile–dye solution (10−3 M) for 24 h to sensitize the NiOx nanoparticles.UV-vis
All UV-vis measurements were carried out on a Jasco V-530 spectrometer in aerated samples.ATR-FTIR
Measurements were carried out on a Perkin Elmer Spectrum 100 FT-ATR.Transient absorption
The setup for transient absorption spectroscopy has been described previously.36,37 The pump pulses (pulse duration below 150 fs) to excite the Ru dyes were centered at 480 nm and were delivered by a TOPAS-C. A supercontinuum served as a broad-band probe. The pump-pulse energy was 2 μJ, while typical probe intensities fall into the range of hundred nJ. For a kinetic analysis the differential optical densities recorded as a function of the delay time and the probe wavelength were chirp corrected and subsequently subjected to a global fit routine using a sum of exponential functions for data analysis.38 The wavelength-dependent pre-exponential factors represent the so called decay-associated spectra (DAS) connected with the kinetic components. In order to avoid prominent contributions from coherent artifacts,39,40 the pulse-overlap region was excluded in the data fitting procedure.Luminescence lifetime
For emission lifetime measurements a Hamamatsu HPDTA streak camera is employed. A Ti:sapphire laser (Tsunami, Newport Spectra-Physics GmbH) is used as the light source. The repetition rate of the laser is reduced to 400 kHz using a pulse selector (Model 3980, Newport Spectra-Physics GmbH). Afterwards the fundamental beam of the oscillator is frequency doubled to yield the 375 nm pump beam. The thin film sample is placed in a ca. 45° angle with respect to the excitation beam and emission light is collected from the back side of the sample in 90° geometry. The emission is detected by the streak camera via a CHROMEX spectrograph that images a 140 nm broad spectral window on the entrance slit of the streak scope. The experimental response of the streak camera is determined by the scattering signal of a blank NiOx-nanoparticle film. The deconvolution of the experimental response function and the luminescence decay is done in GNU Octave.41Results and discussion
Nanoporous NiOx double films were prepared from NiCl2 in water–ethanol mixed solution using the commercially available triblock co-polymer F108 as a template.33,34 After sensitization with Ru1 and Ru2 the NiOx surfaces were investigated using attenuated total reflection-Fourier transform infrared spectroscopy (ATR-FTIR) in order to unravel the binding geometries of the complexes on the surface (see Fig. 1). In the carboxy region there are two important features: a broad band at 1700 cm−1 and a doublet at about 1600 cm−1. According to the literature, both are related to the carboxylic function of the bipyridine ligands.42,43 The band at 1700 cm−1 corresponds to the ν(C![[double bond, length as m-dash]](https://www.rsc.org/images/entities/char_e001.gif) O) of the acid/ester and the double band centred at 1600 cm−1 is connected to stretching vibrations ν(COO) of the carboxylic function bound to the NiOx surface. Consequently, the following can be deduced: (1) for both Ru1 and Ru2 the intensity of the IR-bands increases and the bands at 1600 cm−1 appear broadened (relative to the region at 1700 cm−1), which indicates binding of both dyes to the NiOx surface (see Fig. 1e→c, d→b). (2) Furthermore, in the case of Ru1, the ν(CO) band of the acid/ester at 1700 cm−1 completely vanishes. This implies that all anchor groups are bound to the NiOx surface in Ru1 (see Fig. 1d→b). (3) Upon sensitizing NiOx with Ru2, the band at 1700 cm−1 remains unchanged in its position. Thus, free unbound ester groups are present. Unfortunately, in the case of Ru2 the number of anchor groups bound to NiOx cannot be concluded from these spectra, but speculatively it is two or three, which would be in good agreement with the literature.28 This implies that at least one ligand in Ru2 is not bound to the NiOx.
O) of the acid/ester and the double band centred at 1600 cm−1 is connected to stretching vibrations ν(COO) of the carboxylic function bound to the NiOx surface. Consequently, the following can be deduced: (1) for both Ru1 and Ru2 the intensity of the IR-bands increases and the bands at 1600 cm−1 appear broadened (relative to the region at 1700 cm−1), which indicates binding of both dyes to the NiOx surface (see Fig. 1e→c, d→b). (2) Furthermore, in the case of Ru1, the ν(CO) band of the acid/ester at 1700 cm−1 completely vanishes. This implies that all anchor groups are bound to the NiOx surface in Ru1 (see Fig. 1d→b). (3) Upon sensitizing NiOx with Ru2, the band at 1700 cm−1 remains unchanged in its position. Thus, free unbound ester groups are present. Unfortunately, in the case of Ru2 the number of anchor groups bound to NiOx cannot be concluded from these spectra, but speculatively it is two or three, which would be in good agreement with the literature.28 This implies that at least one ligand in Ru2 is not bound to the NiOx.
 | ||
| Fig. 1 ATR-FTIR spectra of blank NiOx (a), Ru1 on NiOx (b), Ru2 on NiOx (c), pure Ru1 (d), and pure Ru2 (e). The spectra in (b) and (c) are calculated by subtraction of the NiOx spectrum in (a) from the raw spectra. | ||
These findings are of importance for the interpretation of the transient absorption spectroscopy unravelling the ultrafast dynamics and hole injection. The results of these measurements are compared to the respective measurements of the dyes in acetonitrile solution and to the ground-state absorption spectra (see Fig. 2). The latter are very similar for both investigated sensitizers and exhibit the prominent MLCT band at ca. 460 nm that is typical for ruthenium bipyridine dyes.
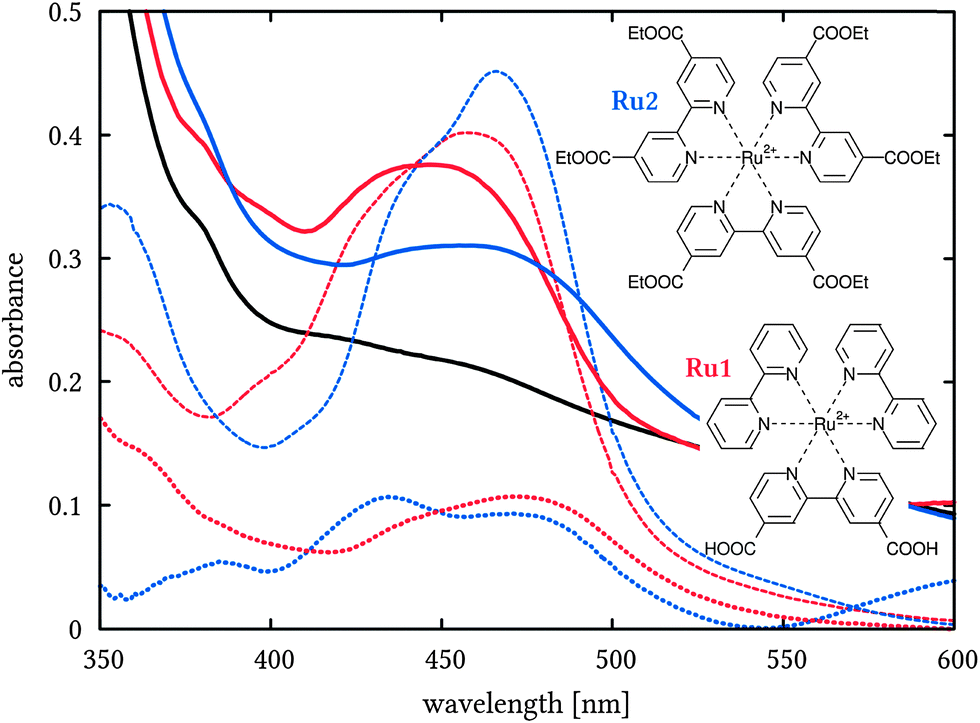 | ||
| Fig. 2 Absorption spectra of Ru1 (red) and Ru2 (blue) in acetonitrile (dashed) and on NiOx (solid, thick) with structural formulae. The spectrum of the blank NiOx is shown in black and difference spectra of the dyes on NiOx and blank NiOx are visualised with dotted lines. | ||
To study the ultrafast excited state dynamics of the complex in acetonitrile solution and on NiOx surfaces the systems were excited at 480 nm and thus in the 3MLCT band. Generally, the recombination of the interfacial charge-separated state [NiOx(h+)–RuII–bpy−*] occurs on long time-scales, which exceed the temporal window of the set-up used here (∼2 ns),20e.g. in Ru(dcb)32+ attached to NiOx nanoparticles recombination occurs within 5 μs.21 Thus, this contribution focuses on the photoinduced ultrafast processes in the photoexcited dye and the hole injection dynamics to the NiOx, the subsequent fate of the injected holes is not considered.
In solution negative signal contributions dominate the spectrum at wavelengths shorter than 530 nm and are accompanied by a broad, rather structureless excited-state absorption band at longer wavelength as commonly observed for ruthenium polypyridine dyes.19,44 Under these conditions and timescales both Ru1 and Ru2 show little or no decay of the excited state back to the ground state. Thus, only one long-lived, prominent component (≫2 ns) describing the decay of the differential absorption signal results from the global fit of the transient absorption data (see ESI† and Fig. 4A and B). This finding reflects the long excited-state lifetimes typical for Ru–bipyridine complexes.45
Light-absorption by Ru1 on NiOx leads to spectral features resembling those for Ru1 in solution (see Fig. 3A) and results in multi-exponential decay kinetics observable over the entire range of probe-wavelengths. The multi-exponential decay can be described by the presence of three distinct kinetic components, i.e. τ1 = 1.9 ps, τ2 = 31 ps and τ3 = 460 ps, and an additional component reflecting the long-lived photoinduced absorption features of the sample (see Fig. 4C). The overall shape of the transient absorption spectrum with its maximum at about 600 nm barely changes during the temporal evolution of the signal within the experimentally accessible range of delay times; below and above 530 nm negative and positive ΔOD signals are observed, respectively (see Fig. 3A), and the relative decay for both negative and positive signals is the same, i.e. between 1 ps and 1.6 ns the signal intensity decreases to about 30% (see kinetic traces in the ESI†).
 | ||
| Fig. 3 Transient absorption data maps of Ru1 (A) and Ru2 (B) on NiOx. The differential optical density is colour coded: positive absorption is blue and green, negative absorption red. White areas indicate ΔOD = 0, which is time dependent in Ru2, i.e. zero shifts from 535 nm at 1 ps to about 510 nm at 1000 ps (B). The insets show the temporal evolution of the signal at 550 nm on a logarithmic scale. | ||
 | ||
| Fig. 4 Decay associated spectra (DAS) of Ru1 in ACN (A), Ru2 in ACN (B), Ru1 on NiOx (C), Ru2 on NiOx (D). | ||
The photoinduced dynamics of immobilized Ru2 (see Fig. 3B) are markedly different from those observed for Ru1 on NiOx surfaces. The transient spectrum of Ru2 in NiOx recorded 1 ps after photoexcitation is characterized by negative absorbance changes below 535 nm and a maximum of the broad photoinduced absorption band at about 610 nm. These features are in agreement with the absorption of 3MLCT-states in related complexes, in which the negative differential absorption is attributed to ground-state bleaching and the positive absorption band at roughly 600 nm to a ligand-to-metal charge-transfer band.46 With increasing delay-times the ΔOD = 0-point shifts to shorter wavelength, i.e. from 540 nm at 0.1 ps to about 510 nm at >1000 ps (see Fig. 3). This dynamic shift of the ΔOD = 0-point is accompanied by the transient formation of a pronounced excited-state absorption maximum at 535 nm. The intensity of this band peaks at 60 ps and afterwards decays to form a rather unstructured long-lived differential absorption spectrum. The long-lived transient absorption spectrum shows a photoinduced absorption in the entire range of probe-wavelengths accessible in this study with a residual maximum at 535 nm. This behaviour is qualitatively different from the photoinduced dynamics of Ru2 in solution (see Fig. 4B and D). While the initial differential-absorption changes of Ru2 on NiOx resemble the features of the early-time transient-absorption spectrum of Ru2 in solution this behaviour changes considerably for longer times (>1 ps) due to the evolution of the maximum at 535 nm. These qualitative differences in the appearance of the photoinduced dynamics when comparing Ru2 in solution with Ru2 anchored onto a NiOx surface reflect the significant impact of the p-type semiconductor on the excited-state kinetics of the dye.
Thus, the central feature in the transient absorption spectra, which reflects this different photophysics, is the appearance of the transiently populated excited-state absorption band at 535 nm (see Fig. 3B). On one hand, the position of this band can be assigned to the absorption of oxidized Ni-centres at the surface of the semiconductor, as previously shown in a related system.21,47 On the other hand, the electrochemically reduced dye Ru2 shows a ground state absorption at 527 nm.29 The two species, i.e. reduced Ru2 and oxidized Ni, may contribute to the transient absorption spectrum, but both are indicative of the hole injection from the photoexcited Ru2 to the valence band of the NiOx.25 Notably the formation of a photoinduced transient with the absorption here, which is indicative of hole injection, is not observed for Ru1 on the NiOx surface.
In order to quantitatively analyze the photoinduced kinetics, a multiexponential model was fit globally to the transient absorption data. By judging the systematic residuals (see ESI†) a bi-exponential function including an offset to reflect any long-lived component was found to be sufficient to fit the data. The resultant time-constants, which describe the photophysics of Ru2 on NiOx, are τ1 = 18 ps and τ2 = 370 ps. The corresponding decay-associated spectra (DAS) are displayed in Fig. 4B. The spectral characteristics of the 18 ps component indicate a decay of the structureless excited-state absorption at wavelength longer than 570 nm, which is accompanied by fading contributions from ground-state bleach centred at around 510 nm. Notably, a shoulder at 535 nm is visible in the negative differential absorption band of the 18 ps component. The latter spectral feature exactly correlates with the positive differential absorption feature in the DAS associated with the 370 ps component. This indicates that the hole injection, associated with the 535 nm photoinduced absorption, occurs with the characteristic time-constant τ1. The decay of the respective absorption band is described by τ2. However, it should be noted that the 370 ps recombination is only partial and some are still observed at long delay-times as can be deduced from the weak transient absorption peak below 550 nm seen in the long-lived component.
The hole injection rate (approx. 0.05 ps−1) reported here is relatively slow compared to the often found ∼100 fs injection dynamics on NiOx. Nevertheless, the injection time-constant reported here matches the slowest injection time-constants described in the literature, which describe time-scales of tens of picoseconds.8,20,26,48 Furthermore, the red tail of the long-lived absorption (see Fig. 4D) correlates with the spectral features of excited Ru2 molecules but has also been observed in spectro-electrochemical UV/vis-absorption spectroscopy experiments on NiOx nanoparticles.47 This finding indicates that after completion of the ultrafast photophysics a fraction of the initially photoexcited Ru2 ensemble remained in the long-lived triplet state (luminescence lifetime τlum = 2.1 μs for Ru2 in degassed ACN solution29) and does not contribute to the fast photoinduced hole injection processes.
Time-resolved luminescence measurements were carried out in order to further detail the luminescence properties and in particular the remaining long-lived transient absorption of the dye-sensitized NiOx surfaces. The luminescence spectra (see Fig. 5D) are indicative of only very weak luminescence for Ru2 on NiOx – centred in the range between 580 and 650 nm. In contrast, stronger luminescence is observed in the case of Ru1 on NiOx. Here, a spectral maximum centred at about 650 nm is visible. Both findings are consistent with the results from the transient absorption spectra discussed above but shed additional light on the molecular origin of the long-lived transient absorption signals observed for long delay times (>2 ns) in the transient-absorption experiments. The time-resolved emission data (see Fig. 5) of Ru1 were fitted best with a three-component model, while that of Ru2 was fitted with a two-component model (see Scheme 1).

Scheme 1 Fitting models/reaction schemes for the time-resolved luminescence data for both dyes.
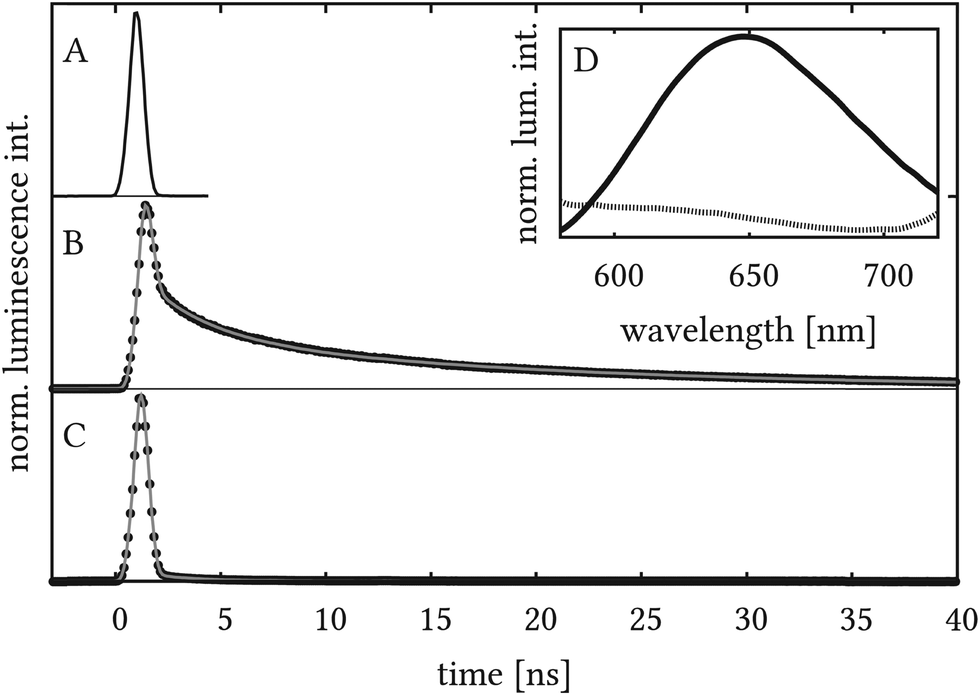 | ||
| Fig. 5 Time-resolved luminescence measurements showing instrumental response (blank NiOx) (A), Ru1 (B) and Ru2 (C) on NiOx. Experimental data in B and C are indicated by black dots while the multi-components fit is shown as a gray solid line. The inset D shows the mean data for all times yielding a spectrum for Ru1 (solid line) that mainly consists of contributions from the emission and a spectrum that represents the instrumental response function for Ru2 (dotted line). | ||
Species [1] is produced within the experimental response. Species [2] and [3] represent the luminescent species. For both systems a fast decay of the luminescence with a characteristic time-constant t1 in the order of a few ns is observed. The main difference between the investigated systems is the long-lived component [3] which is only present in the case of Ru1 and decays with a characteristic time-constant of 18 ns. The luminescence data can be understood in the context of photoinduced hole injection into the semiconductor from Ru2, which efficiently quenches the luminescence of the dye. As Ru1 does not inject holes into NiOx, the luminescence cannot be quenched by this process. Instead, a luminescence-decay with a lifetime of 18 ns, which falls into the range of other ruthenium dyes on semiconductor surfaces, is observed. It should be noted that the luminescence lifetime of Ru1 in degassed acetonitrile is 490 ns.49
The experimental results presented in this study provide clear evidence for the fundamentally different photophysics of Ru1 and Ru2 on NiOx, which is initially rather surprising since the chemical structures of the dyes are overall very similar. According to the ATR-FTIR data presented here, the most probable binding geometry is realized via the carboxylic groups which is in good agreement with the literature.50 The difference between Ru1 and Ru2 on NiOx is that the ligands not bound to the NiOx surface are bipyridine in the case of Ru1 and at least on the ligand of di-carboxy-ethyl bipyridine for Ru2. The impact of the ester groups on the electronic structure of bipyridine ligands in RuII complexes is well known from the literature investigating the light-switch effect in Ru dyes: it could be shown that the introduction of carboxy-methyl groups into the bipyridine ligands lowered the 3MLCT state localized on the bipyridine. As a consequence the excess charge density upon MLCT-excitation was not transferred to the dipyridophenazine ligand anymore, and hence the characteristic light-switch effect of Ru–dppz complexes was prohibited.51 The experimental results presented here indicate a similar effect of the carboxy-ethyl groups in Ru2. This means that the excitation after intersystem crossing and thermal relaxation is located on the ligands that are not bound to the NiOx surface. Thus, an electron transfer from the semiconductor surface is not hindered by the localized excitation. This scenario is schematically presented in Fig. 6, which summarizes the different excitation pathways for the two dyes. After an initial excitation (I), Ru1 relaxes to a 3MLCT state that is located on the ligand, which is bound to NiOx (IIb). From here, radiative decay to the ground state (IVb) takes place as evidenced by time-resolved luminescence measurements. In case of Ru2, the intersystem crossing and thermal relaxation lead to a 3MLCT state that is located on a ligand that is not bound to the NiOx surface (IIa). The effect of the inverted order of the 3MLCT states is due to the −I effect of the carboxy-ethyl groups attached to the ligand. This behaviour in Ru2 supports hole injection to the semiconductor (III). Finally, recombination (IVa) occurs.
 | ||
| Fig. 6 Energy scheme of transitions on the dye-sensitized NiOx surfaces for Ru1 (gray) and Ru2 (black). After initial excitation (I) to a 1MLCT, localization, intersystem crossing and thermal relaxation to 3MLCT states occur (II). In the case of Ru2, hole injection is observed (III). Subsequently, the systems return to the ground state (IV). Solid arrows indicate radiative and dashed arrows non-radiative transitions. Furthermore, a schematic representation of the localization of the excited state is provided. The dashed square represents the NiOx surface on which a ligand is or ligands are attached, the round circle visualizes the Ru centre and the half circle the unattached ligand(s). The moiety where the excitation resides within the model discussed in the text is blackened. | ||
Conclusion
The paper at hand details the ultrafast processes in the structurally related Ru–bipyridine dyes bis[2,2′-bipyridine][4,4′-dicarboxy-2,2′-bipyridine]ruthenium(II) dihexafluorophosphate, [Ru(bpy)2dcb](PF6)2 (Ru1) and tris[4,4′-bis(ethylcarboxy)-2,2′-bipyridine]ruthenium(II) dihexafluorophosphate, [Ru(dceb)3](PF6)2 (Ru2) on NiOx nanoparticle films with the specific focus on a detailed investigation of the hole injection dynamics. The binding of the dyes on the NiOx surface was elucidated using attenuated total reflection-Fourier transform infrared spectroscopy (ATR-FTIR). Ru1 is bound with both carboxy groups to the NiOx, while for Ru2 there is evidence for both bound and free anchor groups, which makes the binding via two or three carboxy groups most likely. This implies that at least one bis-ethylcarboxy-bipyridine ligand of Ru2 is not attached to NiOx.Although both dyes exhibit comparable physical and chemical properties, their behaviour on the semiconductor metal oxide surface NiOx has been evidenced to be very different. Both dyes exhibit similar ground state absorption spectra and the excited state relaxation behaviour in acetonitrile solution shows broad 3MLCT absorption, which does not decay within the temporal window accessible in the experimental setup (2 ns). For Ru1 the spectral features remain unchanged upon binding on NiOx nanoparticles. Furthermore, for Ru1 on NiOx long-lived luminescence, which decays within 18 ns, is observed. Thus no direct interactions, i.e. hole injection from the photoexcited dye Ru1 to the semiconductor nanoparticles is observed. In contrast to this and despite minor structural changes compared to Ru1, photoexcited Ru2 reveals clear evidence of a hole injection reaction into NiOx: emission of Ru2 on NiOx is effectively quenched and the ultrafast transient absorption spectra show the hole injection with a characteristic time-constant of 18 ps.
This deviant behaviour of the dyes is attributed to the different localization of the initially populated excited state: in case of Ru1, the excited state is localized on the dicarboxy-bipyridine, due to the −I effect of the carboxylic groups. Since this is the ligand with which the dye is bound to the NiOx surface, a hole injection is hindered. Contrarily, for Ru2 the initially populated excited state is localized on the ester-substituted ligands, which are not bound to the semiconductor surface. Hence, the excess charge density that is abstracted from the Ru-ion in the metal-to-ligand charge-transfer transition is shifted away from the NiOx surface, which ultimately facilitates hole transfer into the semiconductor.
The results presented in the paper might invoke studies on the role of differently charged linker and anchor units of dyes attached to the NiOx surface. It might be possible that negatively charged moieties in general inhibit charge injection to NiOx but more systematic measurements on many different dyes need to be carried out in order to test this hypothesis.
Acknowledgements
The authors gratefully acknowledge financial support from the Studienstiftung des deutschen Volkes (German National Academic Foundation) and helpful discussions within the COST Action CM1202, Perspect-H2O.References
- L. Li, L. Duan, F. Wen, C. Li, M. Wang, A. Hagfeldt and L. Sun, Chem. Commun., 2012, 48, 988–990 RSC.
- V. Artero, M. Chavarot-Kerlidou and M. Fontecave, Angew. Chem., Int. Ed., 2011, 50, 7238–7266 CrossRef CAS PubMed.
- Y. Ma, X. Wang, Y. Jia, X. Chen, H. Han and C. Li, Chem. Rev., 2014, 114, 9987–10043 CrossRef CAS PubMed.
- J. R. Swierk, N. S. McCool, T. P. Saunders, G. D. Barber and T. E. Mallouk, J. Am. Chem. Soc., 2014, 136, 10974–10982 CrossRef CAS PubMed.
- K. J. Young, L. A. Martini, R. L. Milot, R. C. Snoeberger III, V. S. Batista, C. A. Schmuttenmaer, R. H. Crabtree and G. W. Brudvig, Coord. Chem. Rev., 2012, 256, 2503–2520 CrossRef CAS PubMed.
- A. G. Marrani, V. Novelli, S. Sheehan, D. P. Dowling and D. Dini, ACS Appl. Mater. Interfaces, 2014, 6, 143–152 CAS.
- H. Wang, W. Wei and Y. H. Hu, Top. Catal., 2014, 57, 607–611 CrossRef CAS.
- A. Hagfeldt, G. Boschloo, L. Sun, L. Kloo and H. Pettersson, Chem. Rev., 2010, 110, 6595–6663 CrossRef CAS PubMed.
- B. O'Regan and M. Grätzel, Nature, 1991, 353, 737–740 CrossRef.
- P. Qin, H. Zhu, T. Edvinsson, G. Boschloo, A. Hagfeldt and L. Sun, J. Am. Chem. Soc., 2008, 130, 8570–8571 CrossRef CAS PubMed.
- T. Marinado, D. P. Hagberg, M. Hedlund, T. Edvinsson, E. M. J. Johansson, G. Boschloo, H. Rensmo, T. Brinck, L. Sun and A. Hagfeldt, Phys. Chem. Chem. Phys., 2008, 11, 133–141 RSC.
- D. P. Hagberg, T. Marinado, K. M. Karlsson, K. Nonomura, P. Qin, G. Boschloo, T. Brinck, A. Hagfeldt and L. Sun, J. Org. Chem., 2007, 72, 9550–9556 CrossRef CAS PubMed.
- C. Anselmi, E. Mosconi, M. Pastore, E. Ronca and F. D. Angelis, Phys. Chem. Chem. Phys., 2012, 14, 15963–15974 RSC.
- J. He, H. Lindström, A. Hagfeldt and S.-E. Lindquist, Sol. Energy Mater. Sol. Cells, 2000, 62, 265–273 CrossRef CAS.
- E. A. Gibson, A. L. Smeigh, L. Le Pleux, J. Fortage, G. Boschloo, E. Blart, Y. Pellegrin, F. Odobel, A. Hagfeldt and L. Hammarström, Angew. Chem., Int. Ed., 2009, 48, 4402–4405 CrossRef CAS PubMed.
- F. Odobel, L. Le Pleux, Y. Pellegrin and E. Blart, Acc. Chem. Res., 2010, 43, 1063–1071 CrossRef CAS PubMed.
- G. Benkö, J. Kallioinen, J. E. I. Korppi-Tommola, A. P. Yartsev and V. Sundström, J. Am. Chem. Soc., 2002, 124, 489–493 CrossRef.
- G. Benkö, J. Kallioinen, P. Myllyperkiö, F. Trif, J. E. I. Korppi-Tommola, A. P. Yartsev and V. Sundström, J. Phys. Chem. B, 2004, 108, 2862–2867 CrossRef.
- Z. Ji, G. Natu, Z. Huang, O. Kokhan, X. Zhang and Y. Wu, J. Phys. Chem. C, 2012, 116, 16854–16863 CAS.
- Z. Ji and Y. Wu, J. Phys. Chem. C, 2013, 117, 18315–18324 CAS.
- J. C. Freys, J. M. Gardner, L. D'Amario, A. M. Brown and L. Hammarström, Dalton Trans., 2012, 41, 13105–13111 RSC.
- A. Morandeira, G. Boschloo, A. Hagfeldt and L. Hammarström, J. Phys. Chem. C, 2008, 112, 9530–9537 CAS.
- P. Qin, J. Wiberg, E. A. Gibson, M. Linder, L. Li, T. Brinck, A. Hagfeldt, B. Albinsson and L. Sun, J. Phys. Chem. C, 2010, 114, 4738–4748 CAS.
- L. L. Pleux, A. L. Smeigh, E. Gibson, Y. Pellegrin, E. Blart, G. Boschloo, A. Hagfeldt, L. Hammarström and F. Odobel, Energy Environ. Sci., 2011, 4, 2075–2084 Search PubMed.
- A. Morandeira, J. Fortage, T. Edvinsson, L. Le Pleux, E. Blart, G. Boschloo, A. Hagfeldt, L. Hammarstrom and F. Odobel, J. Phys. Chem. C, 2008, 112, 1721–1728 CAS.
- M. Borgström, E. Blart, G. Boschloo, E. Mukhtar, A. Hagfeldt, L. Hammarström and F. Odobel, J. Phys. Chem. B, 2005, 109, 22928–22934 CrossRef PubMed.
- A. L. Smeigh, L. L. Pleux, J. Fortage, Y. Pellegrin, E. Blart, F. Odobel and L. Hammarström, Chem. Commun., 2011, 47, 678–680 Search PubMed.
- H. Park, E. Bae, J.-J. Lee, J. Park and W. Choi, J. Phys. Chem. B, 2006, 110, 8740–8749 CrossRef CAS PubMed.
- B. H. Farnum, W. M. Ward and G. J. Meyer, Inorg. Chem., 2013, 52, 840–847 CrossRef CAS PubMed.
- Z. Ji, G. Natu and Y. Wu, ACS Appl. Mater. Interfaces, 2013, 5, 8641–8648 CAS.
- A. R. Oki and R. J. Morgan, Synth. Commun., 1995, 25, 4093–4097 CrossRef CAS.
- T. Shimidzu, T. Iyoda and K. Izaki, J. Phys. Chem., 1985, 89, 642–645 CrossRef CAS.
- S. Sumikura, S. Mori, S. Shimizu, H. Usami and E. Suzuki, J. Photochem. Photobiol., A, 2008, 199, 1–7 CrossRef CAS.
- L. Li, E. A. Gibson, P. Qin, G. Boschloo, M. Gorlov, A. Hagfeldt and L. Sun, Adv. Mater., 2010, 22, 1759–1762 CrossRef CAS PubMed.
- M. Bräutigam, M. Schulz, J. Inglis, J. Popp, J. G. Vos and B. Dietzek, Phys. Chem. Chem. Phys., 2012, 14, 15185–15190 RSC.
- M. Karnahl, C. Kuhnt, F. Ma, A. Yartsev, M. Schmitt, B. Dietzek, S. Rau and J. Popp, ChemPhysChem, 2011, 12, 2101–2109 CrossRef CAS PubMed.
- M. Bräutigam, M. Wächtler, S. Rau, J. Popp and B. Dietzek, J. Phys. Chem. C, 2012, 116, 1274–1281 Search PubMed.
- B. Dietzek, S. Tschierlei, G. Hermann, A. Yartsev, T. Pascher, V. Sundström, M. Schmitt and J. Popp, ChemPhysChem, 2009, 10, 144–150 CrossRef CAS PubMed.
- S. A. Kovalenko, A. L. Dobryakov, J. Ruthmann and N. P. Ernsting, Phys. Rev. A: At., Mol., Opt. Phys., 1999, 59, 2369 CrossRef CAS.
- B. Dietzek, T. Pascher, V. Sundström and A. Yartsev, Laser Phys. Lett., 2007, 4, 38–43 CrossRef.
- J. W. Eaton, D. Bateman and S. Hauberg, GNU Octave version 3.0.1 manual: a high-level interactive language for numerical computations, SoHo Books, New York, N.Y., 2007 Search PubMed.
- R. Urlaub, U. Posset and R. Thull, J. Non-Cryst. Solids, 2000, 265, 276–284 CrossRef CAS.
- A. Y. Koposov, T. Cardolaccia, V. Albert, E. Badaeva, S. Kilina, T. J. Meyer, S. Tretiak and M. Sykora, Langmuir, 2011, 27, 8377–8383 CrossRef CAS PubMed.
- J. K. McCusker, Acc. Chem. Res., 2003, 36, 876–887 CrossRef CAS PubMed.
- G. A. Crosby and J. N. Demas, J. Am. Chem. Soc., 1971, 93, 2841–2847 CrossRef CAS.
- K. Kalyanasundaram, S. M. Zakeeruddin and M. K. Nazeeruddin, Coord. Chem. Rev., 1994, 132, 259–264 CrossRef CAS.
- G. Boschloo and A. Hagfeldt, J. Phys. Chem. B, 2001, 105, 3039–3044 CrossRef CAS.
- J. B. Asbury, N. A. Anderson, E. Hao, X. Ai and T. Lian, J. Phys. Chem. B, 2003, 107, 7376–7386 CrossRef CAS.
- T. D. M. Bell, C. Pagba, M. Myahkostupov, J. Hofkens and P. Piotrowiak, J. Phys. Chem. B, 2006, 110, 25314–25321 CrossRef CAS PubMed.
- Y. Pellegrin, L. Le Pleux, E. Blart, A. Renaud, B. Chavillon, N. Szuwarski, M. Boujtita, L. Cario, S. Jobic, D. Jacquemin and F. Odobel, J. Photochem. Photobiol., A, 2011, 219, 235–242 CrossRef CAS.
- M. Schwalbe, M. Karnahl, S. Tschierlei, U. Uhlemann, M. Schmitt, B. Dietzek, J. Popp, R. Groake, J. G. Vos and S. Rau, Dalton Trans., 2010, 39, 2768 RSC.
Footnotes |
| † Electronic supplementary information (ESI) available. See DOI: 10.1039/c4cp05663a |
| ‡ All potentials vs. NHE. |
| This journal is © the Owner Societies 2015 |