
 Open Access Article
 This Open Access Article is licensed under a
 Creative Commons Attribution 3.0 Unported Licence
On the crossroads of current polyelectrolyte theory and counterion-specific effects†
Natalie
Malikova
*ab,
Anne-Laure
Rollet
ab,
Sašo
Čebašek
c,
Matija
Tomšič
c and
Vojko
Vlachy
c
aSorbonne Universités, UPMC Univ Paris 06, UMR 8234, PHENIX, F-75005, Paris, France. E-mail: natalie.malikova@upmc.fr; Fax: +33 144 273228; Tel: +33 144 274031
bCNRS, UMR 8234, PHENIX, F-75005, Paris, France
cFaculty of Chemistry and Chemical Technology, University of Ljubljana, Večna pot 113, SI-1000 Ljubljana, Slovenia
First published on 15th January 2015
Abstract
Aqueous solutions of polyelectrolytes are studied here by means of neutron scattering, with emphasis on backbone hydrophobicity and counter ion specific effects. Ionene polyelectrolytes with varying chain charge density and different counter ions are considered. Their neutron scattering data feature a number of aspects and trends that clearly deviate from the predictions of the existing theory. Ionenes challenge the current hydrophilic–hydrophobic classification of water-soluble polyelectrolytes. The hydrophobic character of their hydrocarbon backbone emerges only for very low chain charge densities (at 15% of charged monomers), which is significantly lower than for other polyelectrolytes with a more complex structure. Universality in the counter ion specific effect seen in ionene solutions with Br− or F− counterions is established. The polyelectrolyte peak in the scattering spectra of Br-ionenes disappears beyond a specific charge concentration, which is identical across all ionene chain charge densities. In addition, scattering spectra of Br-ionenes and F-ionenes feature contrasting temperature trends, which are accentuated with decreasing chain charge density. Our interpretation of the F–Br effect, based on the different hydration properties of the counter ions, is supported by additional NMR measurements on ionenes with mixed counter ion clouds. Overall, the study of ionene polyelectrolytes points clearly to the need for combining the scaling concepts with those of ion specificity, to obtain a theoretical framework encompassing the wealth of phenomena occurring in polyelectrolyte solutions.
1 Introduction
Recent advances have extended the already rich field of polyelectrolyte applications to the very edge of our current technology. Notable examples are polyelectrolytes as part of stimuli-responsive hydrogels,1–3 which lead now all the way to the development of artificial biological tissues,4,5 or conjugated polyelectrolytes as biosensors.6 Understanding the conformation and interactions of polyelectrolyte chains has far reaching consequences in biological sciences, with DNA being one of the most widely studied polyelectrolytes.7In contrast to neutral polymers, the presence of charges in polyelectrolytes gives rise to a wealth of new phenomena, stemming from the interaction of charges along the polyelectrolyte chain and the total or partial counterion condensation onto the chain. Current polyelectrolyte (PE) theory originated in the scaling approach of de Gennes et al. and Pfeuty.8,9 The case of polyelectrolyte solutions was later broadened by Dobrynin and Rubinstein, for all the cases of different solvent quality and concentration regimes.10 The success of this theory is considerable, particularly when confronted with neutron/X-ray scattering experiments on PE solutions. It predicts correctly the scaling of the PE chain correlations probed via the universally observed maximum in scattering data, the so-called polyelectrolyte peak. Its position depends not only on the PE concentration and solvent quality, but also on the effective (as opposed to nominal/chemical) backbone charge, i.e. charge after possible counterion condensation. The description of counter ion condensation itself begins with the seminal work of Manning.11,12 Further extensions are based on the Poisson–Boltzmann approach,13 others attempt to account for the chain flexibility and local dielectric heterogeneities.14 The latter come the closest to describing counterion specific effects, observed by a range of techniques for electrolyte and colloidal solutions, polyelectrolyte gels etc.15–23 As we shall show here, a striking example of these effects is to be found when probing polyelectrolyte solutions through scattering techniques and the current accompanying theory is short of encompassing them.
Scaling theory has been tested on a number of PE solutions, and particularly on those with anionic chains built from the styrene monomer, e.g.13,24–27 Here, we study ionenes, a group of water soluble cationic polyelectrolytes with pH independent charge, based on quaternary ammonium charged centres linked by simple hydrocarbon chains. They have already been studied in connection to several applications, including ion exchange resins,28 water treatment in oil industry,29 organic templates in the synthesis of mesoporous silica,30 or anti-microbial agents.31
The general chemical formula of ionenes is [–(CH3)2N+–(CH2)x–(CH3)2N+–(CH2)y–]n for an x,y-ionene. Values x and y represent the number of –CH2– (methylene) units between adjacent charged centres and can be varied accurately by synthesis.32–34 For our purposes, ionenes are considered model polyelectrolytes as they present several important advantages over other systems: (i) charged centres are part of the PE backbone instead of a side group, (ii) the distance between the charges is regular and tuneable by synthesis and (iii) the uncharged backbone is free of any bulky side groups, which are often prone to specific interactions. Of special importance is also the presence of cationic PE chains with anions as the free counter ions. This charge distribution is likely to accentuate ion specific effects. Ionenes are thus ideally suited for investigating such effects in PE solutions and testing the existing scaling theory in this respect. Fig. 1 gives the schematic view of an ionene chain and a summary of structural parameters of ionenes studied so far.
 | ||
| Fig. 1 Left: schematic view of an ionene chain showing the definition of a charged and uncharged monomer. Right: ionene structural parameters: a is the charge separation on the chain, fchem the fraction of charged monomers, ξ the Manning charge density parameter defined as ξ = LB/a, where LB is the Bjerrum length (7.14 Å in water at room temperature). While 4,5-ionenes are at the ξ = 1 limit (onset of Manning-type condensation), only 3,3-ionenes have sufficient charge density to induce significant condensation (ξ > 1) and decrease the chemical charge (fchem) to an effective charge (feff). Ionenes with Br− and F− counterions are referred to as Br-ionenes and F-ionenes, respectively. | ||
Within the classification of PEs into hydrophilic and hydrophobic, ionenes should fall a priori into the class of hydrophobic PEs, due to the very low solubility of hydrocarbon chains (uncharged ionene backbone) in water. However, recent neutron scattering data as well as osmotic coefficients show that across a wide chain charge density, ionenes show surprisingly a hydrophilic character.35 In addition, a striking counter ion specific effect was reported for 6,9-F and 6,9-Br ionenes.35 While the former has the signature of a typical hydrophilic PE in the semi-dilute regime (a clear PE peak over almost three decades in PE monomer concentration, cp, the peak position scaling as cp1/2), the latter features the disappearance of the PE peak beyond a given PE monomer concentration (1 mol dm−3).‡
Following the above observations, it is important to establish: (1) to what extent the counterion-specific effect is universal for different chain charge densities and how we interpret it and (2) at which chain charge density would we see emerge the hydrophobic character of the backbone. In order to address these questions, we have undertaken neutron scattering measurements for aqueous solutions of F-ionenes and Br-ionenes with several charge densities (from 3,3- to 12,12-), with temperature ranging between 20 °C and 50 °C. The effect of addition of an electrolyte (NaF and NaBr) was studied for selected systems. The scattering data is further complemented by NMR measurements.
2 Experimental section
Br-ionenes were synthesized from the corresponding equimolar amounts of N,N,N′,N′-tetramethyl-1,x-alkane and 1,y-dibromoalkane (Aldrich) by a polyaddition reaction in dimethylformamide (methanol in the case of 6,12- and 12,12-ionenes) at room temperature and under an argon atmosphere for a duration of 7 days.32,34 The crude product was washed with a large amount of acetone and dried under vacuum for 48 hours at 40 °C. The polydispersity index of ionenes thus synthesized is 1.8–2.0, as determined by size exclusion chromatography. Br-ionenes were further dialyzed against water (2 weeks) to ensure the purity of the sample. Dialysis tubes from Sigma (MWCO = 12![[thin space (1/6-em)]](https://www.rsc.org/images/entities/char_2009.gif) 000 g mol−1) were used. This procedure results in molecular masses of the obtained ionenes between 12000 g mol−1 and 100000 g mol−1.36 Such ionene chains contain approximately 100 charged monomers per chain and their length is thus of the order of 100 to 1000 Å.
000 g mol−1) were used. This procedure results in molecular masses of the obtained ionenes between 12000 g mol−1 and 100000 g mol−1.36 Such ionene chains contain approximately 100 charged monomers per chain and their length is thus of the order of 100 to 1000 Å.
Ionenes with fluoride counterions were prepared from bromide salts by ion exchange during dialysis. Dialysis tubes were filled with 0.02 M solutions of the Br-ionene and first dialyzed against 0.05 M solution of NaF (3 weeks) to exchange anion and then dialyzed against water (2 weeks) to remove sodium ions. Ion conversion was checked potentiometrically using a bromide selective electrode and a saturated mercury sulfate electrode as the reference and the standardized solutions of AgNO3 as the titrant reagent. The concentration of bromide ions was under the detection limit. Sodium removal was verified using a flame test.
All ionene solutions for neutron scattering and NMR measurements were prepared gravimetrically. Deuterated water (Euriso-top, 99.9%D) was used for neutron scattering samples, light water for NMR samples. The exact counterion concentrations were determined potentiometrically using bromide or fluoride selective electrodes and a saturated mercury sulfate electrode as the reference. Samples were titrated with standardized solutions of AgNO3 or LaCl3. The pH of the solutions was close to neutral and thus we estimate the effects of any dissolved carbonic acid as very small.
Small angle neutron scattering (SANS) measurements were carried out using the PAXE and PAXY spectrometers at LLB-Orphée, Saclay, France. Using up to three different combinations of incident neutron wavelength (λ) and sample to detector distance, a wave-vector (Q) range of 0.01 to 0.45 Å−1 was covered (Q = 4πsin(θ/2)/λ). The detector efficiency was taken into account by normalisation of data with a flat (incoherent) signal from bulk light water. Ionene solutions were loaded into quartz cells with a path length of 1 or 2 mm. Due to the isotropic nature of our samples, data were grouped in concentric rings, each corresponding to a given Q value. The measured scattered intensities were corrected for transmission, sample thickness, incoherent and solvent background to yield the coherent scattered intensity, Icoh. We checked the reproducibility of neutron scattering spectra, by measuring samples from different synthesis batches.
The single pulse 19F NMR spectra were recorded using a Bruker Avance III 300 MHz NB spectrometer, operating at 7.05 T. The lock was obtained with a sealed 2.5 mm capillary filled with D2O inserted in the NMR tube. The chemical shift was referenced to CFCl3. Pulsed field gradient NMR experiments were performed using a BBFO probe equipped with 55 G cm−1 gradient coil. We used a NMR pulse sequence combining bipolar gradient pulses and stimulated echo.37 This sequence is repeated with 16 gradients of increasing strength (0 < g < 50 Gauss per cm, a gradient application time of 1.5 ms) and a diffusion time of 100 ms. The self-diffusion coefficients are obtained by nonlinear least-square fitting of the echo attenuation.
3 Results and discussion
3.1 Polyelectrolyte peak position and scaling laws
The neutron scattering spectra of aqueous solutions of 12,12-Br and 12,12-F ionenes (least charged systems considered here) are shown in Fig. 2. We see a gradual disappearance of the polyelectrolyte peak beyond a certain ionene monomer concentration in the case of 12,12-Br ionenes, while the peak remains for 12,12-F ionenes across the entire concentration range studied. This is reminiscent of the behaviour of 6,9-Br and 6,9-F ionenes reported previously.35 A similar trend is also observed for the opposite extreme in ionene charge density (3,3-Br and 3,3-F ionenes, data shown in Fig. S1 of the ESI†).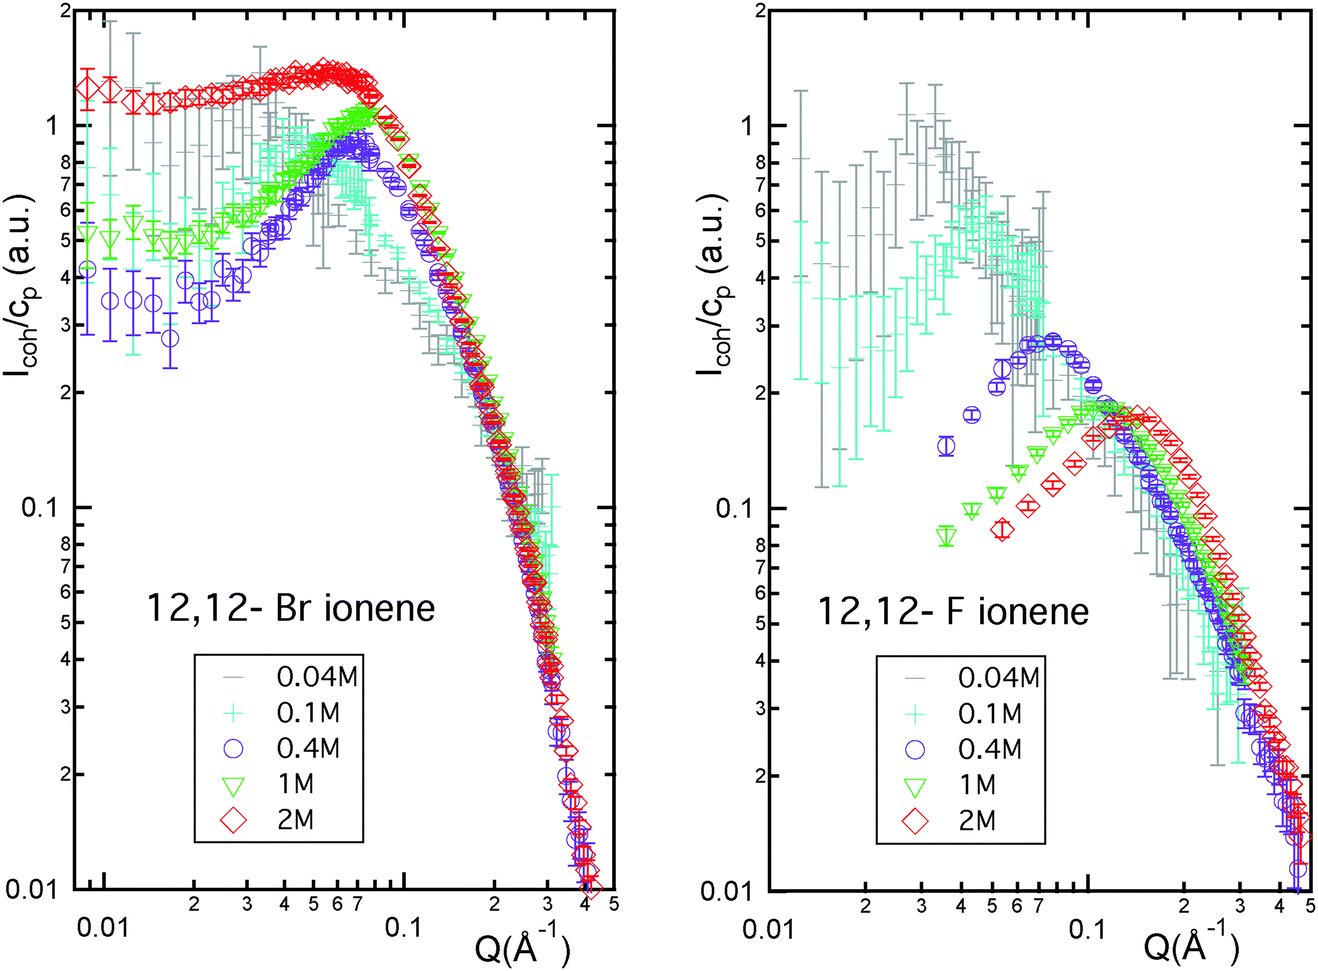 | ||
| Fig. 2 Coherent neutron scattering intensity normalised by ionene monomer concentration (Icoh/cp) versus scattering wave-vector (Q) for room temperature aqueous solutions of 12,12-Br and 12,12-F ionenes (in D2O). Monomer concentrations as indicated in the legends. | ||
Fig. 3 features the position of the observed PE peak (q*) as a function of ionene monomer concentration (cp) for three different ionene charge densities (3,3-, 6,9- and 12,12-), in each case with F− and Br− counter ions. Up to concentrations of 0.2–0.3 M, q* for Br- and F-ionenes of a given charge density are the same. Beyond this point, the behaviour is very different and is the consequence of the disappearance of the PE peak for Br-ionenes. Interestingly, for 12,12-Br ionenes the total disappearance of the PE peak seems to be shifted towards higher monomer concentrations (at the highest concentration studied, 2 M, a clear peak is still present in the spectra of 12,12-Br, while none is seen for ionenes with higher charge densities).
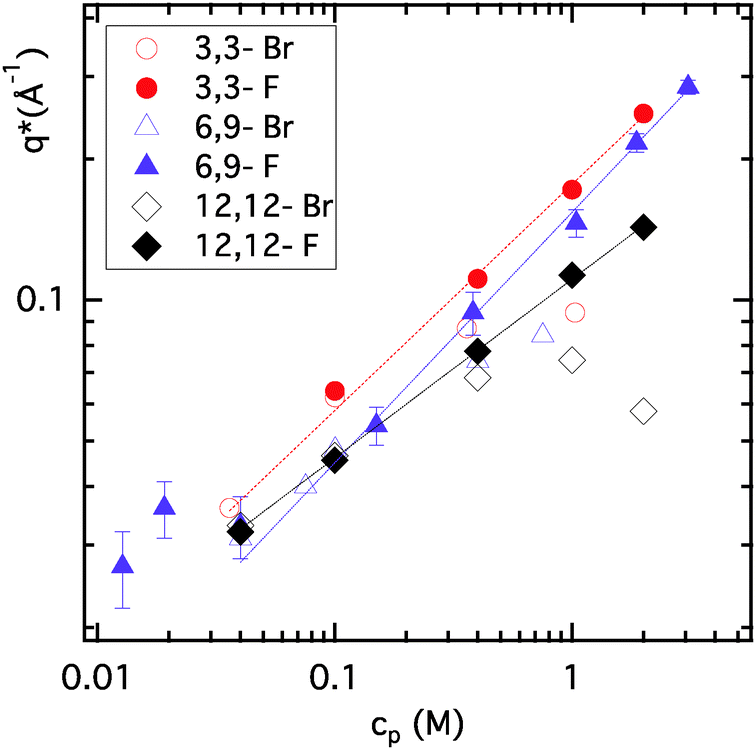 | ||
| Fig. 3 Position of the polyelectrolyte peak in SANS spectra (q*) versus ionene monomer concentration (cp) for three ionene charge densities (3,3-, 6,9- and 12,12-) with either Br− or F− counter ions in each case. Error bars are represented on the 6,9-F ionene data. Lines indicate a power law fit to the three data sets for F-ionenes in the range 0.04 M to 3 M: q* ∝ cαp. The resulting α exponents are: 0.48 ± 0.03 for 3,3-F; 0.53 ± 0.02 for 6,9-F and 0.38 ± 0.01 for 12,12-F. | ||
Within the concentration range studied (0.04–3 M), q* for 3,3-F and 6,9-F ionenes follows a single scaling law, with an exponent close to ½: 0.48 ± 0.03 for 3,3-F and 0.53 ± 0.02 for 6,9-F ionenes. Clearly, the same power law is not obeyed for 12,12-F ionenes, for which the exponent descends to 0.38 ± 0.01. A scaling exponent of ½ is predicted for hydrophilic PEs in the semi-dilute regime, but also for hydrophobic PEs in the string controlled semi-diluted regime.8,10,38 Previously, in view of additional information from osmotic coefficients and the scaling of q* with fchem (fraction of charged monomers), we concluded that ionene chains at these charge densities fall rather surprisingly into the hydrophilic PE category.35 In contrast to this, the significantly lower scaling exponent observed for 12,12-F ionenes is an indication of an emerging hydrophobic character of the ionene backbone. The exponent approaches the value of ⅓, the prediction for the bead-controlled semi-dilute regime for hydrophobic PEs.38 12,12-ionenes correspond to fchem = 0.15, which is a surprisingly low charge density as an onset of a hydrophobic character. Indeed for partially sulfonated polystyrene sulfonate (psPSS, a reference for hydrophobic PEs), the same scaling exponent was observed already for fchem = 0.40.25 This can be interpreted as a “weak” hydrophobicity of the simple methylene backbone. This is to some extent already indicated by the solubility limits of the different PEs. While psPSS is soluble in water down to fchem = 0.30,25 the solubility of ionenes is extended at least down to fchem = 0.15, if not further. Several structural aspects stand at the origin of such behaviour. Firstly, the presence of the benzene side group in psPSS is likely to lead to specific π–π interactions between the monomers39 and thus accentuates the hydrophobicity of the backbone. Secondly, the regularity of charge distribution on ionenes, as opposed to a random distribution of charged groups in many PE systems including psPSS, might be the key to this extended solubility range. The hydration of the charged centres of ionenes (tetralkylammonium groups) is indeed well developed up to high concentrations40 and may mask significantly the hydrophobicity of the neutral linker between them. It remains to be seen if highly asymmetric ionenes (x ≫ y) would show different solubility limits and an earlier emergence of backbone hydrophobicity.
3.2 F–Br counter ion specific effect and temperature dependence
The universality of the F–Br counter ion specific effect at room temperature across different ionene chain charge densities was established in the previous section. We shall consider now the temperature dependence of this effect. Fig. 4 features the temperature variation of the neutron scattering spectra for the two extremes of ionene chain charge density (3,3- and 12,12-), for Br− and F− counter ions in each case. A wealth of contrasting trends is observed. | ||
| Fig. 4 Coherent neutron scattering intensity normalised by ionene monomer concentration (Icoh/cp) versus scattering wave-vector (Q) for 2 M solutions of 3,3-ionenes (left), 2 M solutions of 12,12-ionenes (center) and 0.4 M solutions of 3,3-ionenes (right) at three temperatures, as indicated. LHS y-scale applies to Br-ionene, RHS y-scale to F-ionene in each case. | ||
As seen in Fig. 4 (left), the 3,3-Br system at 2 M monomer concentration is already in the regime without a PE peak. While the high-Q data superimposes very well within the experimental uncertainty at all temperatures, the intensity of the low-Q plateau is strongly temperature dependent. Note that the observed plateau extends down to the lowest Q probed (0.0125 Å−1) and thus the usual low-Q upturn in PE scattering data27,41 is not observed for 3,3-Br ionenes (the same is true for 3,3-F). The 3,3-F spectra feature a broad peak with a very weak temperature dependence, within the experimental uncertainty.
Considering the 12,12-ionenes (lowest chain charge density), Fig. 4 (center), a very different behaviour is observed, not only between the two counter ions but also with respect to 3,3-ionenes. At 2 M concentration, the 12,12-Br system still features a PE peak, which is strongly temperature dependent: it shifts to higher Q values and decreases in intensity as temperature is raised. The 12,12-F spectra also are now clearly temperature dependent, contrary to the 3,3-F counterpart. The peak intensity increases with temperature, while no shift in the peak position is observed.
A useful comparison to the 12,12-ionene data in Fig. 4 (centre) is that for 3,3-Br and 3,3-F at 0.4 M ionene monomer concentration, Fig. 4 (right). These two types of solutions have a very similar charge as opposed to monomer concentration, c(N+) = cpfchem, 0.3 M and 0.2 M respectively. The spectra of 3,3-Br and 3,3-F at 0.4 M concentration both feature a PE peak. With increasing temperature the 3,3-Br peak shifts slowly to higher Q values while losing intensity, the peak for 3,3-F remains temperature insensitive. Therefore, for the same charge concentration, the presence of the uncharged (hydrophobic) ionene backbone (1) accentuates the shifts in the PE peak position and intensity for Br-ionenes and (2) brings about an unusual temperature dependence for F-ionenes.
Let us interpret the above data within the existing theory. The scaling theory predictions for the temperature dependence of the position of the PE peak, q*, and of its intensity, S(q*), are summarized in Table 1. Overall, it is important to distinguish 6 different categories in the semi-dilute concentration regime itself, depending on the type of solvent, chain charge density and PE concentration regime for the case of poor solvent. While 3,3-ionenes fall into the category of good solvent, charge density above the Manning limit (denoted category A further on), 12,12-ionenes at cp = 2 M occupy the category of poor solvent, bead-controlled regime, charge density below the Manning limit (denoted category G further on). This theory predicts rather weak temperature dependencies for q* and S(q*) for category A (q* ∝ T−0.067, S(q*) ∝ T+0.20) and thus the data for 3,3-F ionenes come as no surprise. As in the case of another PE from category A, sodium-2-acryl-amide-2-methyl propane sulfonate (AMAMPS), the temperature dependence is experimentally not resolved.26 The temperature dependent spectra for 3,3-Br at 0.4 M is then unexpected. Moreover, it features trends which are in qualitative disagreement with the theory. According to the latter the peak should be shifting to lower Q values and increasing in intensity, as temperature increases.
| T ≫ Θ | T ≪ Θ | ||
|---|---|---|---|
| String regime | Bead regime | ||
| q* ∝ cp1/2 | q* ∝ cp1/2 | q* ∝ cp1/3 | |
| ξ >1 | q* ∝lB−1/7 | q* ∝ (τlB)−1/4 | q* ∝ (τlB)−1/3 |
| S(q*) ∝ lB3/7 | S(q*) ∝ (τlB)3/4 | S(q*) ∝ τlB | |
| ξ < 1 | q* ∝ lB1/7 | q* ∝ (τlB−1)−1/4 | q* ∝ (τlB−1)−1/3 |
| S(q*) ∝ lB−3/7 | S(q*) ∝ (τlB−1)3/4 | S(q*) ∝ τlB−1 | |
The situation is more complex for 12,12-ionenes in category G, for which we cannot predict any qualitative scaling laws, as Θ, their theta temperature and thus τ, defined as (Θ − T)/Θ, are unknown. Considering that τ decreases, while lB increases with temperature, we may nevertheless predict that the peak position increases, while its intensity decreases, as temperature is raised. However, 12,12-F ionenes feature a PE peak with a temperature-independent position and the intensity increasing with temperature. While the peak position variation may simply not be resolved experimentally, the observed trend in peak intensity is in direct disagreement with the theoretical predictions. Referring back to Table 1, an increase in peak intensity with increasing temperature cannot be assigned to any solvent or concentration regime for PE chains with charge density below the Manning limit (ξ < 1). Interestingly, 12,12-Br ionenes at 2 M actually follow the theory predicted trends for category G.
3.3 Polyelectrolyte peak disappearance: significance of charge concentration, master curve
In view of the unusual q* versus cp behaviour for Br-ionenes in Fig. 3, it seems at first difficult to establish the PE concentration regime for these systems. Beyond the semi-dilute regime, more concentrated PE solutions have been shown to obey a weaker scaling law (q* ∝ cp1/4),24,41 as predicted yet again by theory.42 However, there is no physical reason to look for such a law in the case of Br-ionenes: as F-ionenes remain in the semi-dilute regime up to cp = 2 M, a simple change in the counterion cannot lead to the change in PE concentration regime. The unusual behaviour of q* versus cp for Br-ionenes is thus a consequence of the PE peak disappearance and not of a change in PE concentration regimes. The peak disappearance in salt-free Br-ionene solutions is in itself an unusual phenomenon. It has not been reported for any other polyelectrolyte systems, with the possible exception of PSS with divalent counter ions.43 In contrast, as shown for many other PE systems, addition of simple electrolyte (salt) leads also to the peak disappearance, though with notable differences, see Fig. S2 in the ESI.†The disappearance of the PE peak for Br-ionenes begins at cp = 0.2–0.3 M (indicated by an increasingly lower q* with respect to the F analogues), though the concentration at which the peak disappears completely is higher for more weakly charged chains. Electrostatics is a likely origin of the peak disappearance and thus the concentration of charges, c(N+), is a more relevant parameter than cp. The position of the polyelectrolyte peak observed for both F-ionenes and Br-ionenes is replotted in Fig. 5, with c(N+) as the abscissa, instead of cp. We note that the F-ionene data now superimpose for all ionenes with different charge densities to form a master-curve (12,12-F ionene data cross the master curve hinting at a different character). The 3,3-F and 3,3-Br data are represented both by ignoring and considering Manning condensation to renormalise its charge density. Including Manning condensation brings the data closer to the master-curve. All Br-ionene data sets are now seen to deflect from the master curve at a single point, around c(N+) = 0.05 M. Thereafter 3,3-Br and 6,9-Br data continue towards a saturation limit, while 12,12-Br data has its own dependence, hinting again at its somewhat different character (i.e. emerging hydrophobicity of the backbone). In any case, the total disappearance of the peak in 12,12-Br data is no longer shifted to higher concentrations in this representation. We are aware that the scaling theory does not provide a law for the type of representation in Fig. 5, the appearance of a master-curve hints nevertheless at its significance.
 | ||
| Fig. 5 Position of the polyelectrolyte peak in SANS spectra (q*) versus charge concentration (cN+) for various ionene charge densities with either Br− or F− counter ions in each case. Error bars are represented on the 6,9-F ionene data. Lines are guides to the eye and highlight three different trends. We indicate the transition between the dilute and semi-dilute PE concentration regimes by a vertical dashed line. | ||
3.4 F–Br counter ion specific effect: the proposed picture
Our explanation for the F–Br counter ion specific effect in ionenes begins by considering the very different hydration properties of the two counter ions. The presence of a more weakly hydrating counter ion (with respect to F−, the free energy of hydration is considerably lower in magnitude for Br−)44 results in a more compact counter ion atmosphere around each ionene backbone. It can be pictured as an effective increased affinity of Br− for the ionene backbone. Such a scenario has been seen previously by molecular dynamics (MD) simulations on ionenes45,46 and is also consistent with several thermodynamic data on these systems, such as osmotic coefficients47 and in particular enthalpies of dilution and mixing.48,49 In addition, we observe some correlation between the extent of the ionene counter ion atmosphere (for different halide ions) and the PE peak position, as seen by the small angle X-ray scattering (SAXS) technique (see Fig. S3 in the ESI†). Being guided by the electronic density, SAXS is more sensitive to the correlations arising from counter ion clouds, as opposed to the PE backbone in the case of SANS.Characterising the radial extent of the counter ion atmosphere in the classical way using the Debye length, rD = (4πlBcpfeff)1/2 = (4πlBcN+)1/2, this atmosphere contracts as we increase the PE concentration.10 The Debye length is approximately 43 Å at c(N+) = 0.01 M and is equal to the Bjerrum length (7.14 Å in water at room temperature) already at c(N+) = 0.37 M. At c(N+) = 0.05 M, the onset of the PE peak disappearance, rD = 19 Å, while the typical inter-chain distance, ξ = 2π/q* = 100 Å. We see that these values satisfy the condition rD < ξ/2, i.e. the counter ion atmospheres of the adjacent chains do not overlap, which should lead to the disappearance of the PE peak. However, the same condition is actually satisfied throughout the entire charge range mentioned above, so this simple reasoning cannot hold. Moreover, if it did, even the spectra of F-ionenes should not feature a peak. Now, as has been already pointed out by Dobrynin et al.,10,50 the electrostatic screening length in PE solutions is, in a certain concentration regime, not represented by the Debye length, rather it is of the order of the chain separation ξ, thus is in many instances larger than the Debye screening length. The reasoning is based on a prohibitively large entropy loss of the counter ion cloud. If the cloud is restricted only to the Debye length distance from a PE chain, it leaves a large region between adjacent chains counter-ion free.10,50 Viewing the wealth of PE systems studied up to now, they all seem to fall in line with this reasoning and it is indeed the Br-ionenes that are an exception to the rule. Thus, we propose that the localisation of Br− counter ions close to the ionene backbone due to their above-reported specific affinity (of other than direct electrostatic origin), changes the balance between the enthalpic gain and the entropic loss, in favour of the former. This is supported by the enthalpy of mixing49 and molecular dynamics results,45,46 showing that only the I− ion binds stronger to ionene than Br−. As a result, the constriction of the counter ion atmosphere to below the chain separation indeed occurs for Br-ionenes and no PE peak is observed in this case. This occurs only above a given charge concentration and it is not a sharp transition. The narrower the counter ion atmosphere the more flexible the ionene chain until the scattering data indeed resemble that of a neutral polymer chain, as is the case for 3,3-Br ionenes at cp = 2 M. For an increasingly flexible neutral chain, a less extended and a more globular or Gaussian coil overall conformation is expected, depending on the solvent quality. At the same time, Br− counter ions in the increasingly constricted atmosphere are not necessarily condensed in the Manning sense, they could still be osmotically active. The current osmotic coefficient data (up to c(N+) = 0.1 M) do not show an anomalous counter ion condensation for ionenes, in contrast to that reported for psPSS.35,47,51 However, it is important to extend the existing osmotic coefficients to even high concentrations. We note that some PE systems have been reported to show a type of “incomplete condensation”, retaining partially their osmotic activity in the formerly “condensed” state.52
Within the proposed explanation for the disappearance of the PE peak in Br-ionenes, let us return to the observed temperature trends. It is reasonable to assume that with increasing temperature, the radial extent of the Br− counter ion atmosphere increases and with it the rigidity of the backbone. Thus a more extended configuration of the chain arises and consequently, for a constant contour length, the average inter-chain distance decreases. As a result, the PE peak shifts to higher Q values, towards the q* value of F-ionenes. The latter are likely to be in a significantly more extended conformation, due to their wide counter ion atmosphere. This is what we observe for 12,12-ionenes, in other words the 12,12-Br chain unfolds with increasing temperature. For 3,3-Br ionenes at 2 M, we observe again a decrease in the low-Q plateau (no peak observed), but we do not recover a PE peak with increasing temperature, as we could expect.
Interpreting the minimum in the low Q limit of the scattering curves in terms of the osmotic compressibility and thus in terms of the effective backbone charge, S(Q → 0) ∼ cp/fchem,10,26 we note that the effective charge on F-ionenes is consistently higher than for Br-ionenes. In direct agreement with this, the available values of osmotic coefficients also indicate higher values for F-ionenes in comparison to Br-ionenes.53,54 Moreover, only Br-ionenes show a strong temperature dependence of the neutron spectra, with an increasing feff as temperature increases. This is indeed consistent with the picture we developed above.
In order to test the hypothesis of an increased affinity of the ionene backbone for Br− counter ions, we have undertaken NMR spectroscopy measurements on mixed counter ion ionenes. It is indeed possible to probe the difference in condensation behaviour between F− and Br− using NMR. The 19F chemical shift (19Fδ) is sensitive to the local environment of F−, particularly to its average position with respect to the PE backbone. In Fig. 6 we present the 19F NMR spectra for a series of 3,3-ionenes with a mixed population of F−–Br− counterions at cp = 2 M. The molar fraction of Br− counterions (xBr) ranges from 0 to 0.8, as indicated. The 19F peak shifts towards negative values as xBr increases. The chemical shift in 1 M NaF aqueous solution has also been measured as a reference and is equal to −119.798 ppm. Hence, the variation in the chemical shift indicates that F− ions move towards a more bulk like environment with increasing xBr, i.e. they are removed from the vicinity of the PE backbone and are replaced by the Br− ions. To confirm this result, we have also measured the self-diffusion coefficient of F− ions, D(19F), using pulsed field gradient NMR. As shown in Fig. 6D(19F) increases with xBr and comes closer to its value in NaF bulk aqueous solution: D(19F) = 1.265 × 10⁻⁹ m2 s−1 in 1 M NaF(aq.) and D(19F) = 1.474 × 10⁻⁹ m2 s−1 at infinite dilution.44 This evolution confirms that F− closest to the PE backbone are preferentially replaced by Br−, when the proportion of the latter increases.
 | ||
| Fig. 6 Left: 19F NMR spectra of a series of 3,3-ionenes with a mixed population of F−–Br− counter ions in aqueous solution (cp = 2 M). Molar fraction of Br− counter ions (xBr) ranges from 0 to 0.8. Right: the corresponding self-diffusion coefficient, D(19F), and its ratio with D0, the self-diffusion coefficient of F− in aqueous solution at infinitely low concentration (D0 = 1.474 × 10⁻⁹ m2 s−1). | ||
4 Conclusion
Experimental scattering data for ionene polyelectrolytes, systems with a well defined set of structural features, present a number of aspects and trends that deviate both from previous observations on other polyelectrolyte solutions as well as from the predictions of the existing theory based on scaling concepts. Ionenes do not fall clearly into the current hydrophilic–hydrophobic classification of water soluble polyelectrolytes. In order to observe the emergence of the ionene backbone hydrophobicity, the chain charge density has to decrease to 0.15 (a fraction of charged monomers), which is significantly lower than for other hydrophobic polyelectrolytes. This hints at the “weak” hydrophobicity of the hydrocarbon chain (the uncharged ionene backbone), with respect to polyelectrolyte chains with more complex structures and side groups, such as the benzene group.The counter ion specific effect between ionenes with Br− and F− counter ions is found to be universal: it is seen for all chain charge densities studied. Interestingly, the polyelectrolyte peak in the scattering spectra of Br-ionenes disappears beyond a specific charge concentration (0.5 M), which is independent of the chain charge density. Our interpretation of the F–Br counter ion specific effect, which is based on the different hydration energies of the two anions, is further supported at this stage by NMR measurements on mixed F–Br counter ion ionenes: F− closest to the polyelectrolyte backbone are preferentially replaced by Br− when the proportion of the latter increases, thus confirming the greater affinity of Br− ions to the ionene backbone. Due to the greater differences in hydration energies between anions, as opposed to cations, we believe the choice of ionene polyelectrolytes (cationic backbone) allowed us to highlight the counter ion specific effect. Beyond the already mentioned differences, the scattering data of ionenes with Br− and F− counter ions feature some contrasting temperature trends. This is most evident for the weakly charged ionenes, for which the hydrophobicity of the neutral linker begins to show its effects. 12,12 F-ionenes show a surprising increase of scattered intensity with increasing temperature, which cannot be accounted for by the predictions of the current scaling theory. On the contrary, 12,12 Br-ionenes feature scattered intensity decreasing with temperature, according to theory.
Overall, ionene polyelectrolytes serve as a clear example highlighting the need for combining the scaling concepts of polyelectrolyte solutions with those of ion specificity, to encompass the wealth of phenomena occurring in these systems.
Acknowledgements
The authors thank Mojca Seručnik at the University of Ljubljana for help with sample preparation, José Teixeira for discussions and guidance during neutron scattering experiments at the Laboratoire Léon Brillouin and Francois Ribot at the College de France for discussions and access to NMR spectrometers. M.T. is grateful to Andrej Jamnik for helpful discussions and to Otto Glatter for his most generous contribution to the instrumentation of the SAXS laboratory in Ljubljana. This research was financially supported by the CEA-MHEST (French-Slovenian) bilateral agreement.References
- M. A. C. Stuart, W. T. S. Huck, J. Genzer, M. Müller, C. Ober, M. Stamm, G. B. Sukhorukov, I. Szleifer, V. V. Tsukruk, M. Urban, F. Winnik, S. Zauscher, I. Luzinov and S. Minko, Nat. Mater., 2010, 9, 101–113 CrossRef PubMed
.
- E. A. Appel, J. u. del Barrio, X. J. Loh and O. A. Scherman, Chem. Soc. Rev., 2012, 41, 6195–6214 RSC
- J. Gensel, I. Dewald, J. Erath, E. Betthausen, A. Muller and A. Fery, Chem. Sci., 2013, 4, 325–334 RSC
- M. Leong, J. Toh, C. Du, K. Narayanan, H. Lu, T. Lim, A. Wan and J. Ying, Nat. Commun., 2013, 4, 2353 Search PubMed
- R. Takahashi, Z. Wu, M. Arifuzzaman, T. Nonoyama, T. Nakajima and T. Kurokawa andJ. Gong, Nat. Commun., 2014, 5, 4490 RSC
- J. H. Ortony, T. Chatterjee, L. E. Garner, A. Chworoz, A. Mikhailowsky, E. J. Kramer and G. C. Bazan, J. Am. Chem. Soc., 2011, 133, 8380–8387 CrossRef CAS PubMed
- C. K. Materese, A. Savelyev and G. A. Papoian, J. Am. Chem. Soc., 2009, 131, 15005–15013 CrossRef CAS PubMed
- P. G. de Gennes, P. Pincus, R. M. Velasco and F. Brochard, J. Phys., 1976, 37, 1461–1473 CAS
- P. Pfeuty, J. Phys., Colloq., 1978, 39, C2-149–C2-160 CrossRef
- A. V. Dobrynin, R. H. Colby and M. Rubinstein, Macromolecules, 1995, 28, 1859–1871 CrossRef CAS
- G. S. Manning, J. Chem. Phys., 1969, 51, 924–933 CrossRef CAS PubMed
- G. S. Manning, J. Chem. Phys., 1969, 51, 934–938 CrossRef PubMed
- J. Combet, F. Isel, M. Rawiso and F. Boué, Macromolecules, 2005, 38, 7456–7469 CrossRef CAS
- M. Muthukumar, J. Chem. Phys., 2004, 120, 9343–9350 CrossRef CAS PubMed
- A. Salis and B. W. Ninham, Chem. Soc. Rev., 2014, 43, 7358 RSC
-
W. Kunz and R. Neueder, Specific Ion Effects, World Scientific, New Jersey, 2009, pp. 3–54 Search PubMed
- Y. Marcus, Chem. Rev., 2009, 109, 1346–1370 CrossRef CAS PubMed
- P. Jungwirth and D. J. Tobias, Chem. Rev., 2006, 106, 1259–1281 CrossRef CAS PubMed
- K. D. Collins, Biophys. J., 1997, 72, 65–76 CrossRef CAS
- W. J. Xie and Y. Q. Gao, J. Phys. Chem. Lett., 2013, 4, 4247–4252 CrossRef CAS
- B. Liu, E. Y. Kelly and J. Liu, Langmuir, 2014, 30, 13228–13234 CrossRef CAS PubMed
- O. E. Philippova, A. M. Rumyantsev, E. Y. Kramarenko and A. R. Khokhlov, Macromolecules, 2013, 46, 9359–9367 CrossRef CAS
- N. Yasumoto, N. Kasahara, A. Sakaki and M. Satoh, Colloid Polym. Sci., 2006, 284, 900–908 CAS
- T. A. Waigh, R. Ober, C. E. Williams and J.-C. Galin, Macromolecules, 2001, 34, 1973–1980 CrossRef CAS
- M. N. Spiteri, C. E. Williams and F. Boué, Macromolecules, 2007, 40, 6679–6691 CrossRef CAS
- W. Essafi, N. Haboubi, C. Williams and F. Boué, J. Phys. Chem. B, 2011, 115, 8951–8960 CrossRef CAS PubMed
- J. Combet, P. Lorchat and M. Rawiso, Eur. Phys. J.: Spec. Top., 2012, 213, 243–265 CrossRef CAS
- M. P. Raskop, A. Grimm and A. Seubert, Microchim. Acta, 2007, 158, 85–94 CrossRef CAS
- E. F. Lucas, C. R. E. Mansur, L. Spinelli and Y. G. C. Queiros, Pure Appl. Chem., 2009, 81, 473–494 CrossRef CAS
- S. I. Berezovska, V. V. Yanishpolskii, V. A. Tertykh, M. V. Burmistr and K. M. Sukhyy, J. Therm. Anal. Calorim., 2006, 86, 93–96 CrossRef
- E. Kiss, E. T. Heine, K. Hill, Y. C. He, N. Keusgen, C. B. Pénzes, D. Schnöller, G. Gyulai, A. Mendrek, H. Keul and M. Moeller, Macromol. Biosci., 2012, 12, 1181–1189 CrossRef CAS PubMed
- A. Rembaum and H. Noguchi, Macromolecules, 1972, 5, 261–269 CrossRef CAS
- A. Rembaum and H. Noguchi, Macromolecules, 1972, 5, 253–260 CrossRef
- S. R. Williams and T. E. Long, Prog. Polym. Sci., 2009, 34, 762–782 CrossRef CAS PubMed
- N. Malikova, S. Cebasek, V. Glenisson, D. Bhowmik, G. Carrot and V. Vlachy, Phys. Chem. Chem. Phys., 2012, 14, 12898–12904 RSC
- M. Luksic, R. Buchner, B. Hribar-Lee and V. Vlachy, Macromolecules, 2009, 42, 4337–4342 CrossRef CAS
- D. Wu, A. Chen and C. S. Johnson, Jr., J. Magn. Reson., 1995, 115, 260–264 CrossRef CAS
- A. V. Dobrynin and M. Rubinstein, Macromolecules, 1999, 32, 915–922 CrossRef CAS
- G. B. McGaughey, M. Gagne and A. K. Rappe, J. Biol. Chem., 1998, 273, 15458–15463 CrossRef CAS PubMed
- D. Bhowmik, N. Malikova, G. Mériguet, O. Bernard, J. Teixeira and P. Turq, Phys. Chem. Chem. Phys., 2014, 16, 13447–13457 RSC
- K. Nishida, K. Kaji and T. Kanaya, J. Chem. Phys., 2001, 114, 8671–8677 CrossRef CAS PubMed
- J.-L. Barrat and J.-F. Joanny, Adv. Chem. Phys., 1996, XCIV, 1–66 CrossRef
- J. Combet, M. Rawiso, C. Rochas, S. Hoffmann and F. Boué, Macromolecules, 2011, 44, 3039–3052 CrossRef CAS
-
R. A. Robinson and R. H. Stokes, Electrolyte solutions, Dover publications, New York, 2002 Search PubMed
- M. Druchok, B. Hribar Lee, H. Krienke and V. Vlachy, Chem. Phys. Lett., 2008, 450, 281–285 CrossRef CAS PubMed
- M. Druchok, V. Vlachy and K. A. Dill, J. Phys. Chem. B, 2009, 113, 14270–14276 CrossRef CAS PubMed
- K. Arh, C. Pohar and V. Vlachy, J. Phys. Chem. B, 2002, 106, 9967–9973 CrossRef CAS
- S. Cebasek, M. Luksic, C. Pohar and V. Vlachy, J. Chem. Eng. Data, 2011, 56, 1282–1292 CrossRef CAS
- M. Serucnik, M. Boncina, M. Luksic and V. Vlachy, Phys. Chem. Chem. Phys., 2012, 14, 6805–6811 RSC
- M. Rubinstein, H. R. Colby, A. V. Dobrynin and J.-F. Joanny, Macromolecules, 1996, 29, 398–406 CrossRef CAS
- W. Essafi, F. Lafuma, D. Baigl and C. E. Williams, Europhys. Lett., 2005, 71, 938–944 CrossRef CAS
- D. Qu, J. S. Pedersen, S. Garnier, A. Laschewsky, H. Möhwald and R. von Klitzing, Macromolecules, 2006, 39, 7364–7371 CrossRef CAS
- M. Luksic, R. Buchner, B. Hribar-Lee and V. Vlachy, Phys. Chem. Chem. Phys., 2009, 11, 10053–10058 RSC
- P. Rodic, M. Bratusa, M. Luksic, V. Vlachy and B. Hribar-Lee, Colloids Surf., A, 2013, 424, 18–25 CrossRef CAS PubMed
Footnotes |
| † Electronic supplementary information (ESI) available: Experimental details, additional neutron and X-ray scattering data. See DOI: 10.1039/c4cp05469e |
| ‡ Units of mol dm−3 are abbreviated as M from now on. |
| This journal is © the Owner Societies 2015 |