 Open Access Article
Creative Commons Attribution 3.0 Unported Licence
Variabilities and uncertainties in characterising water transport kinetics in glassy and ultraviscous aerosol†
Andrew M. J.
Rickards
a,
Young-Chul
Song
a,
Rachael E. H.
Miles
a,
Thomas C.
Preston
ab and
Jonathan P.
Reid
*a
aSchool of Chemistry, University of Bristol, Bristol, BS8 1TS, UK. E-mail: j.p.reid@bristol.ac.uk
bDepartment of Atmospheric and Oceanic Sciences and Department of Chemistry, McGill University, 801 Sherbrooke West, Montreal, QC, Canada H3A 0B9
First published on 10th March 2015
Abstract
We present a comprehensive evaluation of the variabilities and uncertainties present in determining the kinetics of water transport in ultraviscous aerosol droplets, alongside new measurements of the water transport timescale in sucrose aerosol. Measurements are performed on individual droplets captured using aerosol optical tweezers and the change in particle size during water evaporation or condensation is inferred from shifts in the wavelength of the whispering gallery mode peaks at which spontaneous Raman scattering is enhanced. The characteristic relaxation timescale (τ) for condensation or evaporation of water from viscous droplets following a change in gas phase relative humidity can be described by the Kohlrausch–Williams–Watts function. To adequately characterise the water transport kinetics and determine τ, sufficient time must be allowed for the particle to progress towards the final state. However, instabilities in the environmental conditions can prevent an accurate characterisation of the kinetics over such long time frames. Comparison with established thermodynamic and diffusional water transport models suggests the determination of τ is insensitive to the choice of thermodynamic treatment. We report excellent agreement between experimental and simulated evaporation timescales, and investigate the scaling of τ with droplet radius. A clear increase in τ is observed for condensation with increase in drying (wait) time. This trend is qualitatively supported by model simulations.
I. Introduction
Quantifying the flux of volatile and semi-volatile components, including water, between the gas and the bulk condensed phases in aerosol is central to understanding time-evolving distributions in aerosol size and composition. Mass transport rates determine the condensational growth kinetics of aerosol activating to form cloud droplets,1,2 the evaporation rate of droplets in spray drying and aerosolised fuels for combustion,3,4 the timescale for particle-gas partitioning of semi-volatile organic compounds in the atmosphere,5–7 and the heterogeneous ageing kinetics of ambient aerosol.8 Diffusional transport in the gas phase, interfacial transfer at the particle surface or bulk diffusion within a particle can each be limiting and determine the kinetics of the coupling between the gas and condensed phase compositions.9,10 Mass transfer is limited simply by gas diffusion rates in the limit of large particle size at atmospheric pressure, provided diffusion in the bulk of the particle is facile and the bulk composition can be assumed to be homogeneous/uniform. Under this regime, often referred to as the continuum regime, the timescale for restoring equilibrium between particle and gas composition is dependent on the gradient in gas phase composition existing between the particle surface and the gas phase remote from the particle. For particles smaller than the mean free path of gas phase molecules, continuum transport governed by diffusion gradients is an unsuitable treatment; instead, the mass transfer is in the free-molecule regime and the nature of the molecule–surface interactions can be key in determining interfacial transport and the net mass flux. Finally, if transport within the particle is hindered and the timescale for the relaxation of a concentration gradient within the particle bulk is slow compared to the relaxation of the gradient within the gas phase, the particle may lag behind the changes in gas composition; changes in particle size and composition are then governed by diffusion rates within the particle. This last regime is the focus of this paper.The conditions that lead to the formation of inhomogeneities in aerosol particle composition are well-established. Rapid removal of evaporating molecules from the near-surface of a droplet into the remote gas phase must proceed faster than a particle is able to readjust in bulk composition, leading to the formation of near-surface enrichments in involatile or less-volatile components as the surface boundary recedes.1,2,11,12 In extreme cases, the concentrations of these species can exceed bulk solubility limits and crystallisation can occur, leading to the formation of particles encapsulating residual liquid within a solid crust.13,14 Indeed, even the slow drying and removal of water from organic aerosol can lead to particles of high viscosity within which water transport is impaired, leading to inhomogeneous particles that may even be glassy.1,11,12,15,16 Conversely, when a volatile component such as water condenses on a highly viscous/solid-like particle, a liquid shell can form that then progressively leads to the dissolution of the solid core, adopting a transient inhomogeneous composition of core–shell morphology.12,17
The prevalence of ultraviscous and glassy secondary organic aerosol (SOA) in the atmosphere has been inferred from recent measurements of the ambient phase of aerosol18,19 with consequences for understanding the cloud condensation and ice nucleation efficiency of aerosol,9,20,21 the timescale for gas-particle partitioning of semi-volatile organic species22 and heterogeneous reaction rates.23 Shiraiwa and Seinfeld have shown that the timescale required for SOA composition to equilibrate is strongly dependent on the particle size and the diffusion coefficient of species within the aerosol condensed phase, as well as ambient organic mass loading.24 Equilibration timescales can even exceed days due to the slow bulk diffusional mixing in ultraviscous particles. Shiraiwa and Seinfeld suggested that neglecting kinetic factors could lead to significant overestimates of the ambient particle mass concentration and underestimates of gas-phase organic concentrations.24
The binary molecular diffusion coefficient, D, for species within the bulk of a particle can be related to the dynamic viscosity, η, by the Stokes–Einstein equation:
 | (1) |
The mass transport of water in single viscous aerosol droplets has been studied using the electrodynamic balance technique,1,17 optical tweezers12,15,25 and a Bessel beam trap.26 From the time-dependent response of particle size to change in relative humidity (RH), the compositional dependence of diffusion coefficients can be estimated and the mechanisms of condensation and evaporation explored and compared. Zobrist et al. have shown that diffusion coefficients as small as 10−24 m2 s−1 can be inferred from measurements of the evolving size of aqueous sucrose droplets at low temperatures (∼200 K).1 Correlations of timescales for size equilibration during evaporation/condensation with estimates of the bulk viscosity have been observed over a limited range in viscosity.12 Particles of ∼1 μm radius have been studied in a Bessel beam trap to endeavour to explore the size dependence in the water transport kinetics.26 Confocal Raman spectroscopy has been used to monitor the diffusion of deuterated-water into samples containing normal-water, monitoring the displacement through the loss of characteristic OH stretching vibrations and the appearance of OD stretching vibrations at lower frequency.2 Spatially resolved measurements have allowed diffusion coefficients as small as 10−16 m2 s−1 to be inferred in sucrose samples at RHs down to ∼20%. In this publication, we will examine some of the inherent factors that lead to variability in the measured kinetics of water transport in glassy and ultraviscous aerosol. Approaches for quantifying rates of evaporation from and condensation on to ultraviscous aerosol will be assessed and developed. Further, the uncertainties in measurements and model treatments that can necessarily compromise any attempt to derive a phenomenological model for quantifying general rates of size and composition change will be explored.
II. Uncertainties and variabilities in measurements of water transport in viscous aerosol
Single particle measurements of the kinetics of water evaporation or condensation can be used to investigate slow diffusional transport within ultraviscous and glassy phases. Commonly, the response to a change in the surrounding gas phase water activity (relative humidity) is studied through measurements of the response in particle size, even achieving sub-nanometre precision in measuring size changes,27 over timescales of many hours. We first provide a brief summary of the aerosol tweezers methodology for measuring the kinetics of water transport before considering some of the inherent measurement uncertainties; the objective is to determine a rigorous and robust framework to represent and characterise measurements of the kinetics of evaporation/condensation in ultraviscous and glassy aerosol.II.a Experimental description: aerosol optical tweezers
We have described the use of optical tweezers to isolate and probe water transport kinetics in single aerosol particles in previous publications.12,15 A plume of aqueous aerosol droplets is introduced into a trapping cell from an ultrasonic medical nebuliser (NE-UO7, OMRON). A single particle is captured by a gradient force optical trap (optical tweezers) formed from a tightly focused beam from a 532 nm laser. The trapped particle is imaged using conventional brightfield microscopy. The gaseous environment surrounding the particle is controlled by the flow of a gas stream regulated by mass flow controllers, mixing dry and humidified nitrogen in a chosen proportion to regulate the RH. The RH and temperature of the gas flow are measured prior to entering the trapping cell (HUMICAP HMT 330, Vaisala, ±2% RH). Cavity enhanced Raman spectra (CERS) are recorded by collecting the inelastically backscattered light from a trapped particle and acquiring the wavelength resolved spectrum using a spectrograph and CCD. The CERS fingerprint consists of spontaneous and stimulated Raman scattering components, providing information on the composition, structure, refractive index (RI), and size of trapped particles. The spontaneous Raman scatter, broad bands Stokes shifted from the incident radiation at 532 nm, is used to probe composition by assignment to the distinct vibrational modes of species within the particle. The stimulated Raman scatter arises from the capacity of the trapped droplet to act as an optical cavity and leads to the formation of sharp peaks in the Raman spectra at wavelengths commensurate with whispering gallery modes (WGMs). When the particle is homogeneous and spherical, the observed wavelengths of the WGMs can be used to determine the size, RI, and dispersion in RI of the particle by comparison with wavelengths predicted using Mie theory.28 The RI is assumed to have a linear dispersion with the frequency of light.II.b Experimental observable: measurements of relative size change
In single particle studies, the common approach is to initiate a step change in the RH surrounding a trapped particle and to measure the response in particle size. The principle observable is a shift in the wavelength of a resonance in the elastic light scattering using a broad band LED diode for illumination1 or within the Stokes' shifted Raman bands.15 Both arise from the ripple structure in the optical cross-section. If the particle is assumed to be homogeneous and to have a defined dependence of RI on water activity or solute molarity (a droplet volume scaling in solute concentration), the evolving size can then be estimated as the RH changes, either from a scaling of the size from the shift in wavelength of the WGMs or by a comparison with full Mie scattering calculations of resonant mode wavelengths. However, a consequence of the slow water transport in viscous and glassy aerosol is that the particle does not remain homogeneous. Instead, gradients in composition, and consequently RI, are established over length scales approaching the dimensions of the particle. WGMs can be assigned a polarisation, mode number, and mode order. For WGMs of the same number and polarisation, the mode energy is peaked further inside the particle surface for higher mode orders. Thus, when a gradient in composition is established within a particle as condensation/evaporation proceeds, modes of different mode order move asynchronously.12 An extreme example of this is seen on condensation when a shell at a water activity equivalent to the gas phase RH is formed rapidly when the RH is increased. The shell grows by dissolution of the viscous core and an abrupt diffusion front is established that leads to the formation of an approximate core–shell morphology. Modes of increasing order shift sequentially as the diffusion front penetrates further into the particle passing through the regions sampled at progressively deeper depths. Thus, the shortcomings of assuming a particle of homogeneous RI when inferring particle size from shifting WGM wavelengths are clear. When the assumption of a specific size dependent RI is relaxed and the RI becomes a fit parameter along with the radius, the accuracy of any size determination will have larger associated errors when compared with fitting a homogeneous particle.28In Fig. 1, we compare the different treatments for inferring the change in size of an aqueous sucrose droplet accompanying a change in RH. The wavelength change is directly measured from the shift of one WGM with time on decreasing the RH from 30 to 5%. At 30% RH, the droplet can be assumed to be homogeneous and the size can be accurately retrieved, in this case 3238 ± 2 nm. If a strict size dependence in RI is assumed based on the compositional dependence of RI estimated from thermodynamic and RI mixing state models, the method adopted in our earliest work,15 the droplet size can be estimated from comparison with Mie scattering calculations for a homogeneous sphere (the red line).
 | ||
| Fig. 1 (a) Comparison of methods for inferring the droplet size change of a sucrose droplet from WGM wavelengths for a 30% to 5% RH change. A comparison is made between the full Mie scattering calculations for a homogeneous sphere (black), a fit to the radius assuming a relationship between water activity and RI (red), a simple scaling relationship between r and λ (eqn (2), green) and the scaling relationship including correction for RI change1 with correction factors of K(m,x) = 0.94 (blue) and K(m,x) = 0.96 (orange, beneath blue line). (b) Comparison of the response functions for the four methods of probing the kinetics of the size change. | ||
If the RI is unconstrained and also retrieved from the fit, significant inconsistencies in size retrieval are observed when compared to the fit with an assumed dependence of RI on composition, again a consequence of the departure of the particle from a homogeneous RI. This is apparent in Fig. 1, with the black points increasingly scattered and less consistent after the RH is decreased, indicative of the inhomogeneous structure of the droplet. The error in the fit reported for such droplets, based on the offset between experimental and theoretically calculated WGMs, increases by over an order of magnitude compared to homogeneous particles, to above the threshold value usually considered an accurate fit. The error landscape is also fairly flat in this region, leading to increased variation from frame to frame in the radius and RI pairings which have the lowest fit error.
The two approaches of inferring the size change from the shifting wavelengths directly1 are also shown. An approximate guide as to the magnitude of the radius change, Δr, inferred from the shift in WGM wavelength, Δλ, can be gained from the relationship:
 | (2) |
In principle, the distinct fingerprints of wavelengths (or size parameters) of WGM structure can be used to infer gradients in RI and, thus, concentration gradients within particles, and also the particle size. However, such an approach is currently intractable when attempting to fit the large data sets required to investigate the slow water transport in viscous aerosol over long times. Both in this publication and in a recent publication by Lienhard,17 we report relative shifts in resonant wavelengths with time from which approximate fractional changes in size can be inferred, rather than attempting to report accurate time-dependent changes in size and RI. Indeed, in much of what follows the kinetics of water transport are under investigation and timescales are the quantity that must be determined rather than the absolute changes in size. Fig. 1(b) includes a comparison of the response functions (discussed later) derived from these four methods of inferring the size change. It can be concluded from the good agreement of the time evolution in fractional size change within error (the response function) that characterising the kinetics of glassy aerosol response from wavelengths shifts is an adequate (and less computationally demanding) approach for representing the kinetics of water transport. It is also consistent with more detailed Mie calculations. At long time, when the droplet is known to be fully relaxed and homogeneous in composition, full Mie calculations can be used to accurately determine droplet size and RI with high accuracy, i.e. note the long time tendency of the Mie calculations with an assumed size dependence of RI to approach the full Mie fit.
II.c A characteristic time to represent the kinetics of mass transport
The relaxation dynamics of glassy systems are widely recognised to follow a time-dependence that cannot be described by a single exponential. Instead, the relaxation timescale for a system property must be characterised by a function of the form given by the Kohlrausch–Williams–Watts (KWW) equation, a stretched exponential.29 The temporal dependence of the response function, F(t), when responding to an applied perturbation over time, t, is given by:10| F(t) ≈ exp[−(t/τ)β] | (3) |
 | (4) |
In our previous work, we have provided a simple measure of the kinetics of the size change following a step change in the gas phase RH as the time required for the particle to progress halfway towards its final limiting state at long time.12 While not providing a rigorous interpretation of the kinetic data, such an approach does provide a method for representing the timescale for most of the size change. In many applications, such as the transport of volatile and semi-volatile components in atmospheric aerosol, the small changes that occur over long times are not as important to characterise as the large changes that occur over shorter times. However, the shortcomings of this approach are obvious. The definition of the “final limiting state at long time” can be ambiguous. The definition of the state towards which the measurement converges at long time changes as the system is studied for longer times: the size of a glassy aerosol particle continues to evolve even after a time under dry conditions of as long as 1 day as water continues to evaporate from the particle. As such, ambiguity persists as to how far removed from equilibrium this state remains even after such a long time.
The KWW function can be expressed in a form that represents the relaxation of viscous aerosol towards an equilibrium state following a change in the gas phase conditions, here the RH. Specifically, eqn (4) can be written as:
 | (5) |
Eqn (3) and (5) can be combined and rearranged to give:
| λ(t) ≈ λ(∞) + (λ(0) − λ(∞))exp[−(t/τ)β], | (6) |
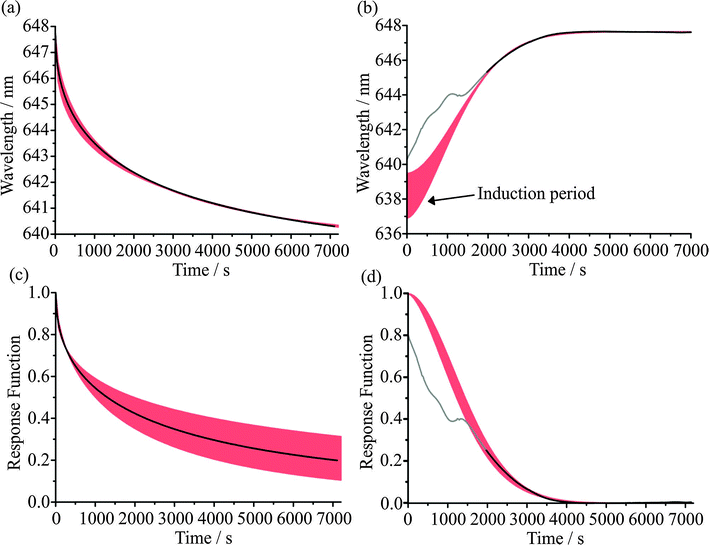
Examples of the fitting of evaporation and condensation events to eqn (6) are shown in Fig. 2(a) and (b). The measurements shown are for the response of sucrose particles, inferred from the shift in a WGM wavelength, following a step in the RH from 30 to 5% and then an increase from 5% to 30% after spending 2 hours at 5%. The sensitivity of the fit for the evaporation step to the value of β is indicated by the envelope of the fit; rather than floating β, we constrain it to those values which cover the typical range for the relaxation of glassy states. Both evaporation and condensation time-dependent profiles are well-described by eqn (6). Some early time data are shown in grey for the condensation event: the asynchronous translation of modes of different orders described earlier is evident and the WGM wavelength shift is dominated at early time by changes in RI gradients within the particle rather than the overall size of the droplet.12,17 Thus, data are omitted from the fit over the time window defined by asynchronous translation of WGMs of different mode order; data are only included in the fit once all modes are moving synchronously.
The characteristic homogeneous mixing time, τmix, for a spherical droplet of radius r to adopt a uniform composition can be estimated from the expression:31
 | (7) |
![[thin space (1/6-em)]](https://www.rsc.org/images/entities/char_2009.gif) 000 s and ∼400–1000 s, respectively. The characteristic relaxation times for the two events shown in Fig. 2, estimated from fits to eqn (6), are 2700 s and 1672 s, respectively. The inconsistency with the characteristic homogeneous mixing times illustrates the kinetics of water transport in the system of interest are non-uniform and poorly reflected by relating the diffusion coefficient to the viscosity.
000 s and ∼400–1000 s, respectively. The characteristic relaxation times for the two events shown in Fig. 2, estimated from fits to eqn (6), are 2700 s and 1672 s, respectively. The inconsistency with the characteristic homogeneous mixing times illustrates the kinetics of water transport in the system of interest are non-uniform and poorly reflected by relating the diffusion coefficient to the viscosity.
We have shown fits of the KWW response function to single events here; reproducibility across many events will be discussed later. Although the particle fully equilibrates within the timescale of the measurement shown in Fig. 2(b) and the fitted value of λ(∞) (647.64 nm) reflects this, the particle remains far from the final state on the drying/evaporation step. These contrasting behaviours are clearly visible when the kinetic profiles are viewed in the form of the response function, Fig. 2(c) and (d), with the values of F(t) reaching values of 0.199 and 0.004 on evaporation and condensation, respectively at the final time at which measurements were performed. It is also instructive to consider the values of β for both processes. The red envelopes for the evaporation steps in Fig. 2 show the sensitivity of the KWW fit to values of β between 0.4 and 0.6. The finite length of the experimental measurement leads to uncertainty in the final state, with widely varying values depending on the value of β chosen. This is the reason why we have chosen not to float β in the fit but instead show the range of response functions that could be consistent with the measurement.
The resultant λ(∞) values from the evaporation step must then be used to derive the response function for the condensation event leading to a large range of possible λ(0) values and the large red error envelope for the condensation steps. Given that the final state is equilibrated here, we float the β value and obtain a value of 1.72 ± 0.11. The value of β on drying must be set to a value ≪1 to represent the data (albeit with a large uncertainty), as expected for a fragile glass former, reflecting the heterogeneity of water activity within the aerosol particle and the local variations in diffusion coefficients and mass transfer rates that can be expected. For the condensation step, the accelerating transport of water that occurs as the particle absorbs progressively more water from t = 0 s can only be described by a compressed exponential with β ≫ 1. Notably, this leads to a short induction period in the kinetic profile, as indicated in Fig. 2(b), with progressively accelerating growth following an initial slow deposition of a thin shell of water on the surface of the particle as the RH is increased. This behaviour can be related directly to the observations when the evolving particle size and morphology is retrieved from comparison of the WGM fingerprint with that expected for a core–shell particle.12
II.d The measurement time: how long is long enough?
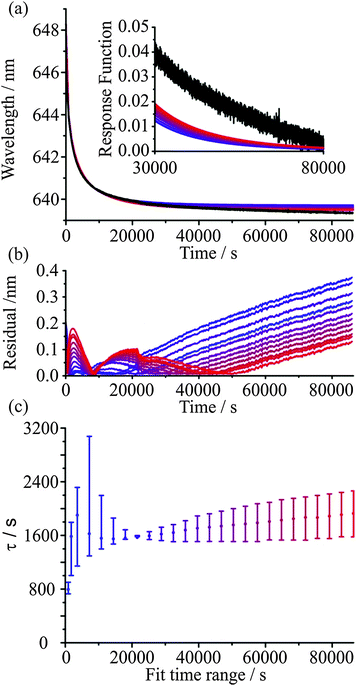
The KWW function provides both a robust and meaningful method to represent the mass transport kinetics of water in ultraviscous and glassy aerosol. Each measured time profile of a surrogate measure of size, the wavelength of a WGM, can be characterised by three parameters, τ, β, and λ(∞), and best viewed in the form of the response function, F(t). All three parameters have physical significance. The time constant provides a single number that characterises the timescale over which the mass transport occurs, β provides a measure of the heterogeneity in molecular environments and structure of the particle, and λ(∞) can be used to infer how far the particle is from an equilibrium state at any point during the relaxation process. A key question must now be answered when considering any experiment with glassy/viscous aerosol: over what time frame must the measurement be performed to allow an accurate characterisation of the aerosol dynamics and determination of the response function? One possible way of placing a lower limit on the time frame is to estimate the size-dependent timescale for molecular diffusion to erase any memory of the system, i.e. the timescale for diffusional mixing. As inferred from Fig. 2 and the subsequent discussion, this approach requires an estimate of the diffusion coefficient of species within the particle. Then, for the viscous aerosol to approach closely a relaxed state, the aerosol must be allowed to evolve for a timescale equivalent to a “few” diffusional mixing time periods.An alternative approach to determining if sufficient time has been allowed for the viscous aerosol to evolve and for the measurement to be concluded is simply empirical: the KWW function should be fitted to the data over varying time periods during which the system is allowed to evolve and convergence of all fit parameters to steady values should be examined. If convergence within certain pre-determined tolerances is achieved, then the kinetics of the system can be considered to be fully characterised within the inherent experimental uncertainty. Fig. 3 provides an illustration of this approach. Measurements of the relaxation of a glassy sucrose particle are shown over a period of up to 24 hours. Initially at equilibrium with a surrounding gas phase at 30% RH, the sucrose particle shows continual water loss when held at 5% RH for a time in excess of 24 hours. Data over increasing time periods were then fit to eqn (6), as shown in Fig. 3(a). The residuals for the fits are shown in Fig. 3(b) as lines smoothed (Savitzky–Golay method) over 500 s intervals with a standard deviation in the noise of ±0.01 nm. The resulting equilibration times for the fits are presented in Fig. 3(c) with error bars representing a change in β of ±0.1 around a fixed β value of 0.5. From these data, it can be seen that an experiment that lasts only 2 hours would be inappropriate for characterising the mass transport kinetics. However, even by a measurement time of 4 hours, the kinetics are much more adequately represented.
Experiments over increasingly long periods do lead to an improved characterisation of the final state towards which the particle is heading and would allow a more accurate determination of β, if it is to be determined. However, it is noticeable that there is a persistence in the error associated with the final state, even when the full 24 hours of data are considered in the fit (see the inset Fig. 3(a)). Indeed, convergence of the fit parameter τ with fit duration is shown in Fig. 3(c) and the residual error in the fit is <0.2 nm at all experimental times when the fit is over a time window longer than 16 hours. This error at a wavelength of ∼650 nm is <0.05%, equivalent in magnitude to the typical percentage error in the radius during the course of the measurement. It should be recognised that the spectral dispersion across the CCD detector corresponds to ∼0.037 nm per pixel and a residual <0.2 nm in radius is less than the linewidth of a typical instrument-limited WGM. Notably, the most accurate characterisation of the kinetics over 24 hours is the poorest at representing the evolution over the first few hours of the drying–evaporation process. This systematic deviation most likely represents the initial formation of steep concentration gradients near the surface of the particle that become less significant with time; in short, the wavelength is a poor proxy measure for the evolving size of the particle at these early times and its inclusion in the KWW fit degrades the fit. The problems with fitting over long time are representative of typical issues with making measurements over long time ranges, a point we will discuss further in the next section. As is clear from Fig. 3(a), even after 24 hours of drying the droplet size is still declining, so a fully accurate representation of the relaxation kinetics cannot be expected.
II.e Accounting for experimental uncertainties: the temperature and RH
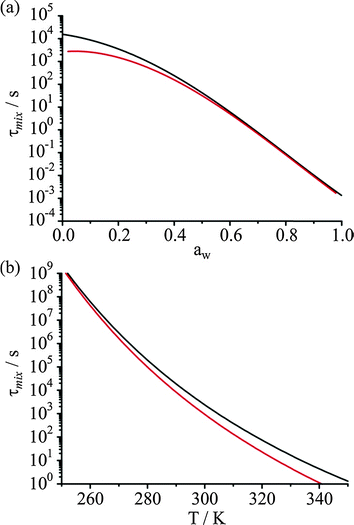
As in any laboratory measurement, it is desirable that reproducible measurements be performed to explore water transport in ultraviscous and glassy aerosol. However, given that the viscosity of particles and diffusion coefficients of water can vary by many orders of magnitude over relatively small changes in RH and temperature, it is important to assess the sensitivity of any kinetic measurements to seemingly small variations/fluctuations in environmental conditions. In Fig. 4, we consider the sensitivity of the timescale for diffusional mixing to the RH and temperature, using the water activity and temperature dependent diffusional constant parameterisation of Zobrist et al.1 At a temperature of 298 K, the sensitivity of the mass transport to ±2% RH, as reflected by the change in the estimated diffusional mixing time, is ±1500 s for a mixing time of 3500 s at a water activity of 0.20, a water activity just below the glass transition. Such long measurements must be performed over periods of >10![[thin space (1/6-em)]](https://www.rsc.org/images/entities/char_2009.gif) 000 s or more, placing a stringent constraint on the need to maintain a stable RH over a long period of time if there is to be consistency in evaporative mass flux even within a single measurement and not to be systematic deviations over time from the expected KWW form in the time dependence. Further, the variability in the RH profile from measurement to measurement must be kept to a minimum if the reproducibility and accuracy of kinetic measurements are to be assessed by attempting to exactly reproduce a RH time profile.
000 s or more, placing a stringent constraint on the need to maintain a stable RH over a long period of time if there is to be consistency in evaporative mass flux even within a single measurement and not to be systematic deviations over time from the expected KWW form in the time dependence. Further, the variability in the RH profile from measurement to measurement must be kept to a minimum if the reproducibility and accuracy of kinetic measurements are to be assessed by attempting to exactly reproduce a RH time profile.
A similarly challenging level of reproducibility in temperature must be achieved from measurement to measurement. At a water activity of 0.2 and 298 K, a fluctuation of only ±1 K leads to a change in the mixing time of ±1400 s for a mixing time of 3500 s. These requirements, for extreme stability in RH and temperature if accurate measurements of the KWW parameters are to be achieved, are even more stringent at lower RHs and temperatures. Typically measurements have been undertaken for days or longer and maintaining RHs and temperatures within ±2% and ±1 K over such long time frames is extremely challenging. Indeed, measurement to measurement fluctuations in, for example, time constants could even approach a value similar in magnitude to the value being measured when undertaking multiple RH cycles on the same particle or different particles.
At high RH, the timescale for diffusional mixing becomes short, as shown in Fig. 4(a) and is less than the timescale for changing the RH in the trapping cell. Gas continuum kinetics gives rise to a timescale for equilibration in size for droplets of the size range studied by AOTs of order ∼10 s, shorter than the time required to effect an RH step in the instrument and certainly shorter than the time required to make an RH measurement.27,32 As an example of the instrument limited timescale for measuring water transport kinetics, as inferred from the time constant recorded for the change in droplet size, in the limit of continuum gas transport limited kinetics the timescale has a mean value of 64 ± 44 s with the instrument used here. Thus, as suggested, the fastest process that can be studied must take longer than 100 s.
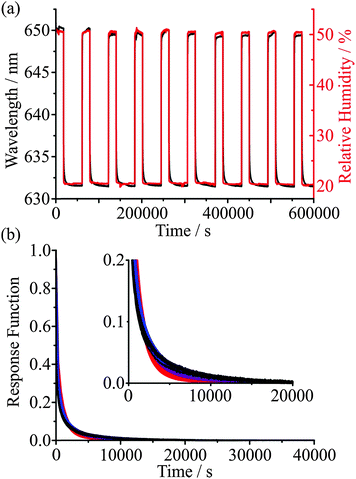
As an example of the reproducibility of measurements that can be achieved, Fig. 5 shows the time series in the wavelength of a particular WGM during cycles of condensation and evaporation over 7 days, with periods of drying that extend for up to 12 hours. The KWW fit parameters are given in Table 1. Reproducibility in the time constant is within ±10%, suggesting that the active control of RH (provided by a continuous flow of dry or humidified gas) and temperature (provided by laboratory air conditioning) is sufficient to characterise the mass transport kinetics with a high degree of confidence. Fig. 5(b) shows the corresponding experimental response functions on top of the KWW fits to the experimental data for three β values of 0.4, 0.5 and 0.6. For glassy states, typical limiting values of β are expected to be 3/7 and 3/5 although which value should best represent the relaxation of glasses is debated. Given that the reproducibility of our measurement is insufficient to resolve the value of β, we instead choose to use a value of 0.5 for drying of aerosol in all glassy and ultraviscous states, thus allowing the inference of time constants that can be compared from one measurement to another. We will occasionally also use limiting values of 0.4 and 0.6 to indicate the range of behaviour in the response function that might be expected.
| Cycle | τ / s | β | λ(0) / nm | λ(∞) / nm | Fit error / nm |
|---|---|---|---|---|---|
| 1 | 115 | 0.5 | 650.24 | 631.60 | 0.177 |
| 2 | 129 | 0.5 | 650.18 | 631.61 | 0.217 |
| 3 | 142 | 0.5 | 649.58 | 632.53 | 0.318 |
| 4 | 143 | 0.5 | 649.30 | 631.62 | 0.176 |
| 5 | 143 | 0.5 | 650.00 | 631.61 | 0.221 |
| 6 | 154 | 0.5 | 649.66 | 631.67 | 0.227 |
| 7 | 150 | 0.5 | 649.30 | 631.61 | 0.228 |
| 8 | 159 | 0.5 | 649.49 | 631.60 | 0.238 |
| 9 | 151 | 0.5 | 649.69 | 631.53 | 0.231 |
| 10 | 153 | 0.5 | 649.48 | 631.54 | 0.219 |
III. Uncertainties in modelling water transport in viscous aerosol
Zobrist et al. have described a model that directly accounts for the non-linearity in the diffusion processes arising from strong concentration gradients (and, thus, large variations in diffusion coefficients) that occur within the bulk of a particle.1 We use the same approach here and we refer the reader to earlier accounts of the model for greater detail. The model requires the numerical solution of the spherical diffusion equation, dividing the droplet into concentric shells and accounting explicitly for the molecular flux of water between shells using a temperature and compositional dependent parameterisation of the diffusion coefficient of water in the form suggested by the Vogel–Fulcher–Tammann approach:10,33 | (8) |
Recently, Price et al. reported a revised parameterisation for the water activity dependence of the diffusion coefficient of water in sucrose solutions, based on confocal Raman measurements as D2O penetrates H2O solution droplets at constant water activity.2 Their parameterisation, valid at 296.5 K, is:
| log10[DH2O(aw,T = 296.5 K)] = − 20.89 + 25.92aw − 26.97aw2 + 13.25aw3 | (9) |
The RH profile that a particle is exposed to must be converted into an equilibrium solute concentration within the particle; water transport then drives the particle towards this composition. Zobrist et al. have provided a parameterisation that relates the water activity in the condensed phase to the mass fraction of sucrose within the solution.1 This parameterisation is considered to be accurate over the full compositional range from a weight fraction of 0 to 1 and over the temperature range of 145 to 360 K. However, the treatment of the equilibrium solution properties is also susceptible to large error in the limit of low water activity, high solute mass fraction. Not only can bulk measurements not be made but aerosol measurements are challenging because of the significant kinetic impairment in composition, the very process we are trying to study here. Because of the large molecular mass of sucrose, small errors in the mass fraction of solute can lead to substantial errors in the number of moles of water present in the solution. Given water acts as a plasticiser, even small changes in the molar ratio can lead to significant changes in both the viscosity of the mixture and the diffusion coefficient of water, thereby having a significant influence on the kinetics of evaporation or condensation fluxes. The parameterisations of the water activity/mass fraction of solute relationships from nine treatments are included in Fig. S2(b) (ESI†); the treatments are referred to either by the authors of each of the original studies, specifically Norrish34 (with both the most accepted parameter K value,35 and the Baeza et al.36 value), Starzak & Peacock,37 Zobrist et al.,1 and Dutcher et al.,38 or by the model's acronym, specifically AIOMFAC (Aerosol Inorganic–Organic Mixtures Functional groups Activity Coefficients),39,40 ADDEM (Aerosol Diameter Dependent Equilibrium Model),41 and E-AIM (Extended-Aerosol Inorganic Model)42,43 (with values estimated by the group contribution method using UNIFAC (UNIversal quasichemical Functional-group Activity Coefficients)44 and parameters according to Peng et al.45). The level of disagreement between the models at the limit of dry conditions is highlighted in the inset Fig. S2(a) (ESI†).
In our previous study of water transport kinetics in sucrose aerosol, we concluded that the Zobrist et al. treatment was marginally better than the Norrish treatment at reproducing the time dependent trends in particle size over all RHs. However, this was based on the use of the Zobrist et al. treatment for the diffusion coefficient. More recently we have measured the viscosity of sucrose solution droplets using the aerosol optical tweezers approach.25 Pairs of droplets were manipulated, brought together to coalescence and the timescale for relaxation to a spherical shape measured. Measurements were made over a wide RH range from 93 to 28% RH with relaxation timescales spanning from <10−6 s to >105 s, respectively, commensurate with a similarly wide dynamic range of viscosities spanning 10−3 to 109 Pa s. Based on a treatment provided by Chenlo et al.,46 we used the predicted variation in solution composition from the Norrish, and Starzak & Peacock models to estimate the water activity dependence of the solution viscosity. The Norrish treatment yielded an exceptionally accurate prediction of the viscosity when compared with the direct measurements.
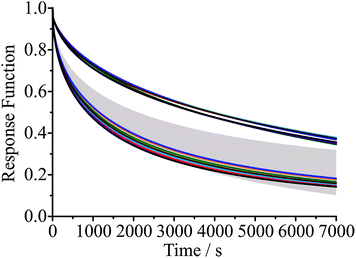
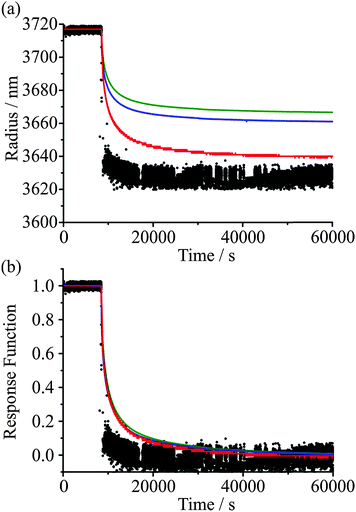
In Fig. 6 we compare the response functions predicted for a change in RH from 30 to 5% RH for a droplet initially 3385 nm in radius at the upper RH using the various thermodynamic treatments described, with either the Zobrist or Price treatment for diffusion. The response function for the simulations (which yield predictions of the time dependence in size) is given by a similar expression to that used when defined in terms of the wavelength of a WGM, specifically:
 | (10) |
IV. Key features of water transport kinetics in ultraviscous and glassy aerosol
We have now considered the factors that lead to variability in measurements of the water transport kinetics and the uncertainties, both experimental and predictive, that must be considered when interpreting measurements of evaporation and condensation processes in ultraviscous and glassy aerosol. We will now summarise some of the key observations that will be invaluable in providing a phenomenological framework for interpreting and predicting the kinetic limitations imposed by slow bulk diffusion on aerosol properties. The conformity of the response function for glassy aerosol to a form described by the KWW function reinforces the conclusion that the behaviour of aerosol is not unique and has many similarities with the relaxation of glassy systems in a broader array of scenarios.IV.a The final state is poorly defined
The removal of water from an ultraviscous or glassy aerosol particle is extremely slow. Even though some of the drying measurements were performed over 24 hours, the response function remains significantly offset from 0 (the homogeneous final state) and a significant fraction of water remains within the bulk of the particle. For the experiment reported in Fig. 6, we show a simulation of the evolving compositional inhomogeneity within the particle in Fig. 7. The slow kinetic limitations imposed on such systems preclude accurate thermodynamic measurements with the diffusional kinetics leading to a progressive slowing during the drying process. As recognised in our earlier work, this limitation imposed on characterising viscous aerosol does not preclude the assignment of a timescale over which most of the water loss occurs, but it should always be remembered that water persists and compositional gradients are “locked in” to the particle structure for long periods of time. Rather interestingly, heterogeneity in viscosity and diffusion coefficients will be a characteristic of a particle in such a state.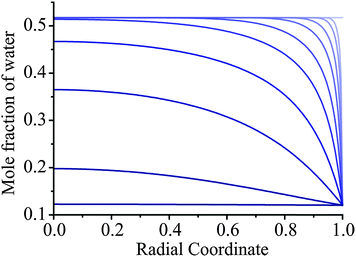 | ||
Fig. 7 Simulations of heterogeneity in aerosol during drying for the AOT measurement from 30% to 5% RH shown in Fig. 6. The initial droplet radius is 3385 nm and the Zobrist et al. thermodynamic treatment and Zobrist et al. diffusion coefficient parameterisation is used. Lines represent times after the RH change of 0, 1, 3, 10, 30, 100, 300, 1000, 3000, and 10![[thin space (1/6-em)]](https://www.rsc.org/images/entities/char_2009.gif) 000 s (top to bottom). 000 s (top to bottom). | ||
IV.b The mass transport kinetics depend on both the initial and final states
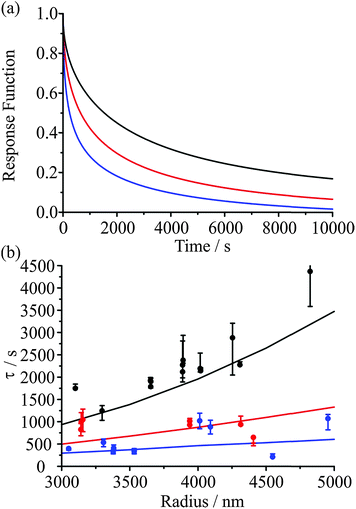
When the RH of the surrounding gas phase is altered, the surface composition of the particle reacts rapidly for both evaporation and condensation. On drying to low RH, the immediate loss of water from the surface of the particle leads to a sudden and substantial increase in viscosity and decrease in diffusion, forming a thin crust through which water transport is slow. With increase in RH and condensation of water, a shell of aqueous solution in equilibrium with the vapour phase is almost instantaneously formed with dissolution of the viscous core depending then on diffusivity in the shell. From this picture it is very clear that the evaporating or condensing fluxes of water depend on the degree of kinetic impairment at the particle surface. However, these fluxes from/to the particle surface establish strong compositional gradients within the particle, as apparent in Fig. 7. Transport rates within the particle are governed by the magnitude of these gradients with the consequence that the evaporation or condensation kinetics are determined by both the final and initial states that the particle is transitioning between. In our previous work we have illustrated this by highlighting that the timescale for evaporation–condensation correlates, albeit imperfectly, with the viscosity of the particle estimated from the composition at the midpoint between the initial and final states. Fig. 8(a) shows model predictions of the slowing of water transport through a viscous shell upon evaporation. The droplet response is most kinetically hindered when the concentration gradient between the highly viscous shell and the core is shallowest, in this case for an initial RH of 30%.IV.c The time constant depends on the droplet size
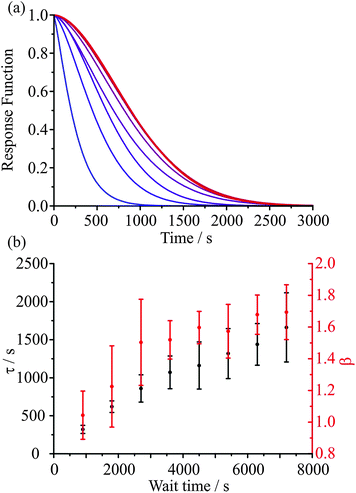
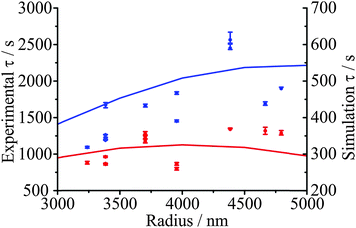
When comparing the evaporation kinetics of water from particles of different size, a larger number of moles of water must be removed from larger particles with a surface area that does not increase commensurately, i.e. the surface-to-volume ratio changes as 1/r. This suggests that the time constant from fits to the KWW function should have some dependence on the droplet radius. Measurements over a droplet radius range spanning 3000 to 5000 nm are summarised in Fig. 8(b) for a drying process from 50, 40, or 30% RH into an RH of 10%. Within the noise of the measurement, the correlation of the time constant with radius is clear for the lowest starting RH, and these trends are very well explained by the model (shown as lines). These data also illustrate the conclusion of Section IV.b that the kinetics depend on the conditions in both the initial and final states. This observation also applies to the kinetics of condensation, as will become apparent in the following section.IV.d Glassy aerosol show ageing behaviour characteristic of glasses: condensation should not be considered as independent of evaporation
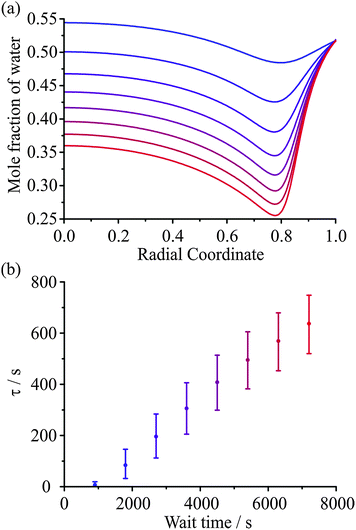
In a recent paper we have provided preliminary evidence for the dependence of the kinetics of evaporation/condensation on the exact history of states that the particle has passed through.26 This is consistent with the expected behaviour of heterogeneous glassy states.47 A typical example of such behaviour for amorphous states is provided by the analogy with the stretching of an elastic (rubber) band.30 Although it might be expected that the response function would show a characteristic exponential dependence in response to a perturbation (e.g. a stretch), an elastic band shows behaviour that is more appropriately characterised by a stretched exponential of the form described by the KWW function. What is more, the time constant for the response is dependent on the time period for previous perturbations. For example, the time constant for the recovery in the equilibrium length of the elastic band when released is dependent on how long the elastic band has been stretched for, often referred to as the “wait time”. In the case of aerosol, the obvious analogous example is the following: the “stretch” can be considered to be equivalent to a variable period of time exposed to low RH during which the particle loses water. Then, the recovery to an equilibrium state, the release of the elastic band from its stretched state, can be considered to be equivalent to a sudden increase in the surrounding RH, condensation of water onto the particle, and the transition to an equilibrium composition.An illustration of the influence of the “wait time” (i.e. the period of the “stretch”) on the subsequent condensation process is shown in Fig. 9. In Fig. 9(a) the internal composition of the droplet is shown at 200 s after the start of condensation at 30% RH for particles dried at 5% RH for varying amounts of time, as specified. The water retained within the particle during the drying step is dependent on the drying time. Once the RH is raised, the mass fraction of water near the surface increases rapidly leading to significant heterogeneity in composition that depends on the wait time. The timescale for condensation and equilibration at 30% RH, calculated from fitting the KWW equation to the model simulations, varies with the wait time during the drying step, as seen in Fig. 9(b). This result is qualitatively consistent with previously reported measurements.26
IV.e Dissolution is fast at high RH and governed by water transport in the gas phase
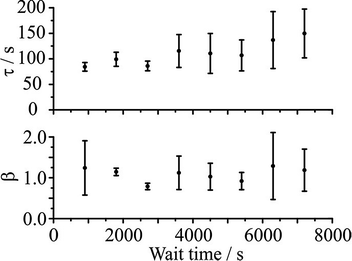
As the RH of the condensation step increases, the response function becomes more single exponential in form with a β value that tends to 1 (i.e. the induction time becomes very short) and a decreasing time constant. Indeed for sucrose aerosol, Fig. 10 confirms that for a condensation RH of 45% and above, the kinetics of particle growth and condensation are governed by the diffusion of water in the gas phase with the time constant at the lower limit that can be measured by the approach described here (∼100 s).IV.f Simulations do not adequately represent induction behaviour upon condensation
An example of the measured effect of the ageing process is shown in Fig. 11, which shows a comparison with model predictions. The upper RH was chosen to be 30% and the lower RH to be 5%. The response functions for the condensation kinetics for the different drying times are compared in Fig. 12(a), showing only the fitted response functions for clarity. As expected, the condensation kinetics are slower when the particle is allowed to dry for longer, with the time constant increasing to a limiting value with increasing drying time. The values of β for these fits tend towards a value of 2 at long drying time, Fig. 12(b), arising from the existence of a finite induction period at early time during the early stages of formation of an equilibrated shell once the RH is increased and before the dissolution starts in earnest. This is in contrast to the β value derived from the model, which takes a value of around 0.5 (indicative of the condensation event having a viscous final state at 30% RH), and suggests the simulations in their current form do not sufficiently represent the experimentally observed induction behaviour. The difference in the time dependencies between the model and measurement suggest that some additional kinetic limitation is imposed on the initial stages of condensation and dissolution not included in the model. This may reflect the assumption that the outer surface layer of the particle remains continuously in equilibrium with the near-surface gas phase layer, neglecting the possibility that the formation of a complete equilibrated layer during condensation may require some induction period. The condensation process, as for the evaporation process, shows a dependence on droplet size, as shown in Fig. 13. The data again show that the condensation requires more time if the particle is dried (i.e. aged) for longer. Although the measurements and model predictions show similar qualitative trends, quantitative discrepancies remain.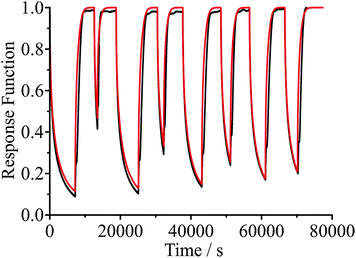 | ||
| Fig. 11 Comparison of measured droplet response (black) and model simulations (red) for a 3238 nm radius sucrose droplet. The RH is varied between 30% and 5% for different wait times. | ||
V. Conclusions
Upon a change in RH environment, the shift in wavelength of a single WGM resonance in a Stoke's shifted Raman band can be well represented by the KWW equation and used to determine a characteristic timescale for the corresponding water transport kinetics. This offers a new approach to describing water transport kinetics, differing from our previous method which treated the equilibration timescale as the time for a droplet to complete half of its total size change.12 Upon drying, the evolving radial heterogeneity and corresponding variability of water transport within the glassy droplets is represented by β ≪ 1. To fully understand the kinetics of water transport in glassy aerosol it is pertinent to consider the experimental and predictive factors that can introduce variability, including measurement timescale, environmental temperature and RH, and choice of diffusion coefficient and thermodynamic parameterisation when performing simulations. The longer the timescale over which an experiment is conducted, the more accurately the kinetics of the system will be represented. Several hours is sufficient for determining a consistent value for τ. However water transport in sucrose droplets, from an initial RH of 30% into a final RH of 5% RH, was shown still to be occurring after 24 hours and to remain far from equilibrium. The effect of fluctuations in local temperature and RH must be taken into account when determining water transport timescales, as particle viscosity and the diffusion coefficient of water are very sensitive to such changes. This is particularly important over long timescale experiments, where strict control of environmental conditions may not be facile. Reproducibility experiments on the same droplet have demonstrated response function variability as a result of RH and temperature fluctuations is of a similar magnitude to that caused by varying β by ±0.1 around 0.5. As a consequence, we have chosen to fix the value of β at 0.5 rather than attempt to fit β independently.Various parameterisations exist to simulate the thermodynamic properties of aqueous sucrose solutions, and the diffusion coefficient of water within them. These tend to differ significantly from each other at the low water activity end, which is of most importance to the study of ultraviscous aerosol. From comparison to experimentally obtained response functions the diffusion parameterisation of Zobrist et al.1 was found to better represent water transport in low water activity sucrose solutions than that of Price et al.2 No thermodynamic parameterisation was found to significantly outperform the others for determination of a characteristic water transport timescale.
Many of the key features of water transport kinetics in glassy aerosol droplets have been addressed. The droplet final state is poorly defined as compositional gradients confine water to the core degrading its ability to escape from the droplet. The transport kinetics are dictated by both the initial and final droplet states and the concentration and diffusion gradients established between the two. The characteristic timescale of water transport has also been shown to have a dependence on droplet size, with larger droplets (with less favourable surface area-to-volume ratios) taking longer to reach their final states, as well as the wait time (in this case the time spent drying at 5% RH before condensation). This ageing behaviour characteristic of glasses emphasises the way in which RH history, in the form of heterogeneities, can become encoded within a glassy aerosol droplet. This ageing also introduces an induction time, as droplets that have been perturbed further from their final state (a longer wait time) are slower to begin approaching that final state again (i.e. in evaporation–condensation cycles). This induction time is not adequately represented by current model simulations. Finally, it should also be noted that as the RH of the condensation step is increased, water transport becomes much more rapid and the response function takes on a more single exponential form with β approaching unity. Having established a framework for representing the water transport kinetics in viscous aerosol, robust comparison of time constants for equilibration between systems composed of differing chemical functionality and viscosity can be made.
Acknowledgements
JPR and AMJR acknowledge financial support from the EPSRC through the support of a Leadership Fellowship (EP/G007713/1) awarded to JPR. JPR and REHM also acknowledge the NERC for funding through the ACID-PRUF consortium grant (NE/I020075/1). TCP acknowledges the National Science and Engineering Research Council of Canada for funding as a postdoctoral research fellow.References
- B. Zobrist, V. Soonsin, B. P. Luo, U. K. Krieger, C. Marcolli, T. Peter and T. Koop, Phys. Chem. Chem. Phys., 2011, 13, 3514–3526 RSC.
- H. C. Price, B. J. Murray, J. Mattsson, D. O'Sullivan, T. W. Wilson, K. J. Baustian and L. G. Benning, Atmos. Chem. Phys., 2014, 14, 3817–3830 CrossRef.
- T. A. G. Langrish and S. Wang, Drying Technol., 2009, 27, 606–614 CrossRef CAS.
- D. J. Burnett, F. Thielmann and J. Booth, Int. J. Pharm., 2004, 287, 123–133 CrossRef CAS PubMed.
- T. D. Vaden, D. Imre, J. Beránek, M. Shrivastava and A. Zelenyuk, Proc. Natl. Acad. Sci. U. S. A., 2011, 108, 2190–2195 CrossRef CAS PubMed.
- C. D. Cappa and K. R. Wilson, Atmos. Chem. Phys., 2011, 11, 1895–1911 CrossRef CAS.
- V. Perraud, E. A. Bruns, M. J. Ezell, S. N. Johnson, Y. Yu, M. L. Alexander, A. Zelenyuk, D. Imre, W. L. Chang, D. Dabdub, J. F. Pankow and B. J. Finlayson-Pitts, Proc. Natl. Acad. Sci. U. S. A., 2012, 109, 2836–2841 CrossRef CAS PubMed.
- M. Shiraiwa, M. Ammann, T. Koop and U. Pöschl, Proc. Natl. Acad. Sci. U. S. A., 2011, 108, 11003–11008 CrossRef CAS PubMed.
- B. Zobrist, C. Marcolli, D. A. Pedernera and T. Koop, Atmos. Chem. Phys., 2008, 8, 5221–5244 CrossRef CAS.
- P. G. Debenedetti and F. H. Stillinger, Nature, 2001, 410, 259–267 CrossRef CAS PubMed.
- T. Koop, J. Bookhold, M. Shiraiwa and U. Pöschl, Phys. Chem. Chem. Phys., 2011, 13, 19238–19255 RSC.
- D. L. Bones, J. P. Reid, D. M. Lienhard and U. K. Krieger, Proc. Natl. Acad. Sci. U. S. A., 2012, 109, 11613–11618 CrossRef CAS PubMed.
- R. Vehring, W. R. Foss and D. Lechuga-Ballesteros, J. Aerosol Sci., 2007, 38, 728–746 CrossRef CAS PubMed.
- M. A. Boraey and R. Vehring, J. Aerosol Sci., 2014, 67, 131–143 CrossRef CAS PubMed.
- H.-J. Tong, J. P. Reid, D. L. Bones, B. P. Luo and U. K. Krieger, Atmos. Chem. Phys., 2011, 11, 4739–4754 CrossRef CAS.
- E. Mikhailov, S. Vlasenko, S. T. Martin and T. Koop, Atmos. Chem. Phys., 2009, 9, 9491–9522 CrossRef CAS.
- D. M. Lienhard, A. J. Huisman, D. L. Bones, Y.-F. Te, B. P. Luo, U. K. Krieger and J. P. Reid, Phys. Chem. Chem. Phys., 2014, 16, 16677–16683 RSC.
- A. Virtanen, J. Joutsensaari, T. Koop, J. Kannosto, P. Yli-Pirilä, J. Leskinen, J. M. Mäkelä, J. K. Holopainen, U. Pöschl, M. Kulmala, D. R. Worsnop and A. Laaksonen, Nature, 2010, 467, 824–827 CrossRef CAS PubMed.
- R. E. O'Brien, A. Neu, S. A. Epstein, A. C. Macmillan, B. Wang, S. T. Kelly, S. A. Nizkorodov, A. Laskin, R. C. Moffet and M. K. Gilles, Geophys. Res. Lett., 2014, 41, 4347–4353 CrossRef.
- B. J. Murray, T. W. Wilson, S. Dobbie, Z. Cui, S. M. R. K. Al-Jumur, O. Möhler, M. Schnaiter, R. Wagner, S. Benz, M. Niemand, H. Saathoff, V. Ebert, S. Wagner and B. Kärcher, Nat. Geosci., 2010, 3, 233–237 CrossRef CAS.
- S. M. King, T. Rosenoern, J. E. Shilling, Q. Chen, Z. Wang, G. Biskos, K. A. McKinney, U. Pöschl and S. T. Martin, Atmos. Chem. Phys., 2010, 10, 3953–3964 CAS.
- C. D. Cappa and K. R. Wilson, Atmos. Chem. Phys., 2012, 12, 9505–9528 CAS.
- M. Shiraiwa, Y. Sosedova, A. Rouvière, H. Yang, Y. Zhang, J. P. D. Abbatt, M. Ammann and U. Pöschl, Nat. Chem., 2011, 3, 291–295 CrossRef CAS PubMed.
- M. Shiraiwa and J. H. Seinfeld, Geophys. Res. Lett., 2012, 39, 1–6 CrossRef.
- R. M. Power, S. H. Simpson, J. P. Reid and A. J. Hudson, Chem. Sci., 2013, 4, 2597 RSC.
- J. W. Lu, A. M. J. Rickards, J. S. Walker, K. J. Knox, R. E. H. Miles, J. P. Reid and R. Signorell, Phys. Chem. Chem. Phys., 2014, 16, 9819–9830 RSC.
- R. E. H. Miles, K. J. Knox, J. P. Reid, A. M. C. Laurain and L. Mitchem, Phys. Rev. Lett., 2010, 105, 116101 CrossRef.
- T. C. Preston and J. P. Reid, J. Opt. Soc. Am. B, 2013, 30, 2113–2122 CrossRef CAS.
- M. D. Ediger, Annu. Rev. Phys. Chem., 2000, 51, 99–128 CrossRef CAS PubMed.
- A. Amir, Y. Oreg and Y. Imry, Proc. Natl. Acad. Sci. U. S. A., 2012, 109, 1850–1855 CrossRef CAS PubMed.
- R. M. Power and J. P. Reid, Rep. Prog. Phys., 2014, 77, 1–27 CrossRef PubMed.
- G. Hargreaves, N.-O. A. Kwamena, Y. H. Zhang, J. R. Butler, S. Rushworth, S. L. Clegg and J. P. Reid, J. Phys. Chem. A, 2010, 114, 1806–1815 CrossRef CAS PubMed.
- C. A. Angell, Science, 1995, 267, 1924–1935 CAS.
- R. S. Norrish, J. Food Technol., 1966, 1, 25–39 CrossRef CAS PubMed.
- J. Chirife, C. Ferro Fontán and E. A. Benmergui, J. Food Technol., 1980, 15, 59–70 CrossRef CAS PubMed.
- R. Baeza, A. Pérez, V. Sánchez, M. C. Zamora and J. Chirife, Food Bioprocess Technol., 2010, 3, 87–92 CrossRef CAS PubMed.
- M. Starzak and S. D. Peacock, Zuckerindustrie, 1997, 122, 380–387 CAS.
- C. S. Dutcher, X. Ge, A. S. Wexler and S. L. Clegg, J. Phys. Chem. A, 2013, 117, 3198–3213 CrossRef CAS PubMed.
- A. Zuend, C. Marcolli, B. P. Luo and T. Peter, Atmos. Chem. Phys., 2008, 8, 4559–4593 CrossRef CAS.
- A. Zuend, C. Marcolli, A. M. Booth, D. M. Lienhard, V. Soonsin, U. K. Krieger, D. O. Topping, G. McFiggans, T. Peter and J. H. Seinfeld, Atmos. Chem. Phys., 2011, 11, 9155–9206 CAS.
- D. O. Topping, G. B. McFiggans and H. Coe, Atmos. Chem. Phys., 2005, 5, 1205–1222 CrossRef CAS.
- S. L. Clegg, P. Brimblecombe and A. S. Wexler, J. Phys. Chem. A, 1998, 102, 2155–2171 CrossRef CAS.
- A. S. Wexler and S. L. Clegg, J. Geophys. Res., 2002, 107, 4207 CrossRef.
- A. Fredenslund, R. L. Jones and J. M. Prausnitz, AIChE J., 1975, 21, 1086–1099 CrossRef CAS.
- C. Peng, M. N. Chan and C. K. Chan, Environ. Sci. Technol., 2001, 35, 4495–4501 CrossRef CAS.
- F. Chenlo, R. Moreira, G. Pereira, A. Ampudia and D. Rosa, J. Food Eng., 2002, 54, 347–352 CrossRef.
- S. L. Simon and P. Bernazzani, J. Non-Cryst. Solids, 2006, 352, 4763–4768 CrossRef CAS PubMed.
Footnote |
| † Electronic supplementary information (ESI) available. See DOI: 10.1039/c4cp05383d |
| This journal is © the Owner Societies 2015 |

