 Open Access Article
Creative Commons Attribution 3.0 Unported Licence
A spectroscopic study of the cis/trans-isomers of penta-2,4-dienoic acid attached to gold nanoclusters
Federico
Latorre
ab,
Julien
Guthmuller
c and
Philipp
Marquetand
 *b
*b
aInstitute of Physical Chemistry, University of Jena, 07743 Jena, Germany
bInstitute of Theoretical Chemistry, University of Vienna, 1090 Vienna, Austria. E-mail: philipp.marquetand@univie.ac.at
cFaculty of Applied Physics and Mathematics, Gdansk University of Technology, 80233 Gdansk, Poland
First published on 9th January 2015
Abstract
In this theoretical work, we present a spectroscopic analysis of the cis/trans-isomers of a molecular switch, penta-2,4-dienoic acid, attached to gold clusters of different size (1, 2 and 20 gold atoms). We have simulated 4 different spectroscopic techniques: Infrared spectroscopy, normal Raman scattering, absorption spectra and resonance Raman scattering. We discuss how the position and the conformation of the molecule determine the electronic structure and hence, the spectra. The calculations have been performed using density functional theory for the properties of the ground state and time-dependent density functional theory for the excited-state properties. Special emphasis is put on the resonance Raman spectra for the study of the isomers. In the present case, resonance Raman scattering is best suited to discriminate between the isomers on the gold clusters.
I. Introduction
The remarkable functionalities of molecular switches in nature make it highly desirable to develop artificial systems in a similar fashion.1 Molecular switches are molecules that can switch reversibly between different microscopic states. Various studies on this class of molecules exist, see e.g.ref. 2–12. One of the most prominent examples is the retinal isomerization in rhodopsin which is responsible for signal conversion in human vision.13Anchoring such switches on surfaces may lead to new functional properties, which are relevant for different fields like molecular electronics, biocompatible devices or sensing.14 A detailed study of their microscopic properties is vital for the correct understanding of their functionality. For the investigation of these properties, different spectroscopic techniques can be used, among others infrared spectroscopy (IR), Raman scattering (RS), resonance Raman scattering (RRS), and absorption spectra in the visible and/or ultraviolet regime (UV).15 In presence of metal surfaces, the spectroscopic signals are often dramatically increased and the corresponding techniques have received much attention recently, which is documented in several reviews for surface-enhanced infrared absorption (SEIRA),16–18 sum-frequency generation (SFG),19,20 surface-enhanced Raman scattering (SERS) and its resonance Raman analog (SERRS).18,21–24 Another variant of RS employs sharp tips to exploit the surface effect. This tip-enhanced Raman scattering (TERS) yields remarkable spatial resolution in addition to the enhanced signals.25–28 Furthermore, the vibrations of a molecule situated between two electrodes can be monitored via inelastic electron tunneling spectroscopy (IETS).29–33 All these techniques are especially suited for surface analysis in organic electronics, microfluidics or smart materials, where molecular switches are applied.14,34
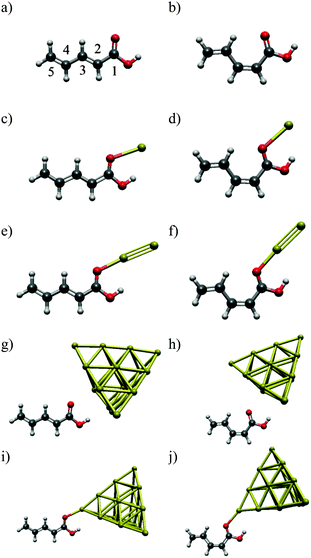
In the present work, we use penta-2,4-dienoic acid (PDA) as a model system because it can switch between its trans (Fig. 1a) and its cis form (Fig. 1b), absorbs in an experimentally accessible region of the electromagnetic spectrum, is commercially available, and – according to our calculations – should bind to metal surfaces. In order to mimic these metal surfaces, we attach the PDA to gold nanoclusters of different sizes (1, 2 and 20 gold atoms), see Fig. 1. Hence, we will be able to study the influence of the metal on the electronic structure of the anchored molecular switch in detail. For the Au20 cluster, we use a tetrahedral structure, because the latter is predicted to be the most stable conformation.35–37 Consequently, the PDA molecule can be anchored at different sites of this cluster, where we choose the center of the face, the surface conformation (Fig. 1g and h), and the opposite position, the vertex (Fig. 1i and j).
II. Computational methods
All the quantum chemical calculations presented in this work have been carried out using the GAUSSIAN 09 program.38 The geometries and frequencies in the ground state were calculated at the density functional theory (DFT) level39 using the B3LYP exchange correlation (XC) functional.40–42 With no experimental data at hand to compare to, we deem the B3LYP functional reliable for the simulation of the different spectra, see e.g.ref. 43. As basis sets, we use 6-311(d)44 for the description of the PDA molecule and the quasi-relativistic effective core potential MWB6045 for the description of the gold nanoclusters. Note that this latter choice is arbitrary to some extent since different effective core potentials yield results of similar quality, see e.g.ref. 46. The excited-state properties were obtained at the time-dependent DFT (TD-DFT) level47 using the same XC functional, basis set and core potential. All systems are assumed neutral, i.e., the systems with one Au atom are open-shell systems.For the evaluation of the RRS intensities, we used the excited-state gradient method48 employing our own code. For the isolated molecule and PDA–Au cluster, the RRS intensities were obtained within the short-time approximation (STA).43,49,50 For a given normal mode r, its fundamental transition g0 → g1r, from the vibrational ground state of the electronic ground state to the first vibrational excited state at the electronic ground state, the STA intensity expression is:
The PDA–Au2 and especially the PDA–Au20 cluster exhibit several close-lying electronic states which are conjointly excited in a RRS process. Therefore, the RRS intensities cannot be obtained within the STA, but the sum-over-states expression has to be employed:52,53
where the summation over e takes all contributing electronic excited states into account, (μge)α is a component of the transition dipole, Δe,r is the dimensionless displacement of the potential minimum of the excited state e with respect to the potential minimum of the electronic ground state in the rth normal coordinate and Φe describes the RRS intensity with respect to the frequencies ω, see ref. 52. Following the procedure of previous works52,54 the Frank–Condon factors were neglected in the function Φe.
III. Results and discussions
(a) Gold position
In order to locate the preferred binding site of the PDA to the gold clusters, we performed geometry optimizations with randomly varied starting positions. For PDA–Au, all simulations ended in one of two local minima, corresponding to conformations which we term A and B. Their structures are depicted in Fig. 2. The same binding sites were discovered for PDA–Au2 (not shown) and from this fact as well as from the following results, we see no distinct impact of the closed-shell or open-shell character of the systems. In all calculations, the position A is more stable than the position B (see Table 1). Since calculations for PDA–Au20 are expensive, only position A was considered for both surface and vertex conformers. As in the other cases, a potential minimum was found. Consequently, position A was taken as the global minimum and used in all further calculations.| Au/eV | Au2/eV | |
|---|---|---|
| cis | ||
| Position A | 0.00 | 0.00 |
| Position B | 0.16 | 0.27 |
| trans | ||
| Position A | 0.00 | 0.00 |
| Position B | 0.17 | 0.30 |
(b) Property changes with gold-cluster size
When adding the different gold clusters, the electronic structure of the PDA molecule is changed. This modification is reflected in the geometry. Table 2 shows changes in bond lengths with respect to the single PDA molecule for different gold-cluster sizes. The molecule is attached via its carboxylic oxygen to the gold. As a consequence, the bond of the carboxyl group is stretched. The effect is promoted further along the conjugated chain of the PDA and the following bonds are contracted and stretched in alternating order. A second effect is that the O–H bond of the acid group is stretched, which implies that the bond is weakened and the molecule becomes more acidic.| Bond | trans | cis |
|---|---|---|
| Distance/Å | Distance/Å | |
| PDA | ||
C2![[double bond, length as m-dash]](https://www.rsc.org/images/entities/char_e001.gif) C3 C3 |
1.343 | 1.348 |
C4![[double bond, length as m-dash]](https://www.rsc.org/images/entities/char_e001.gif) C5 C5 |
1.339 | 1.339 |
| C1–C2 | 1.473 | 1.473 |
| C3–C4 | 1.449 | 1.452 |
C![[double bond, length as m-dash]](https://www.rsc.org/images/entities/char_e001.gif) O O |
1.210 | 1.211 |
| C–OH | 1.358 | 1.359 |
| O–H | 0.969 | 0.969 |
| Au | ||
C2![[double bond, length as m-dash]](https://www.rsc.org/images/entities/char_e001.gif) C3 C3 |
1.345 | 1.349 |
C4![[double bond, length as m-dash]](https://www.rsc.org/images/entities/char_e001.gif) C5 C5 |
1.339 | 1.340 |
| C1–C2 | 1.468 | 1.468 |
| C3–C4 | 1.448 | 1.450 |
C![[double bond, length as m-dash]](https://www.rsc.org/images/entities/char_e001.gif) O O |
1.225 | 1.227 |
| C–OH | 1.339 | 1.340 |
| O–H | 0.980 | 0.980 |
| O–Au | 2.559 | 2.568 |
| Au2 | ||
C2![[double bond, length as m-dash]](https://www.rsc.org/images/entities/char_e001.gif) C3 C3 |
1.346 | 1.351 |
C4![[double bond, length as m-dash]](https://www.rsc.org/images/entities/char_e001.gif) C5 C5 |
1.339 | 1.340 |
| C1–C2 | 1.460 | 1.460 |
| C3–C4 | 1.446 | 1.449 |
C![[double bond, length as m-dash]](https://www.rsc.org/images/entities/char_e001.gif) O O |
1.236 | 1.237 |
| C–OH | 1.330 | 1.332 |
| O–H | 0.980 | 0.980 |
| O–Au | 2.266 | 2.267 |
| Au20 vertex | ||
C2![[double bond, length as m-dash]](https://www.rsc.org/images/entities/char_e001.gif) C3 C3 |
1.346 | 1.351 |
C4![[double bond, length as m-dash]](https://www.rsc.org/images/entities/char_e001.gif) C5 C5 |
1.339 | 1.340 |
| C1–C2 | 1.463 | 1.463 |
| C3–C4 | 1.447 | 1.449 |
C![[double bond, length as m-dash]](https://www.rsc.org/images/entities/char_e001.gif) O O |
1.230 | 1.231 |
| C–OH | 1.338 | 1.340 |
| O–H | 0.976 | 0.976 |
| O–Au | 2.426 | 2.432 |
| Au20 surface | ||
C2![[double bond, length as m-dash]](https://www.rsc.org/images/entities/char_e001.gif) C3 C3 |
1.334 | 1.349 |
C4![[double bond, length as m-dash]](https://www.rsc.org/images/entities/char_e001.gif) C5 C5 |
1.339 | 1.340 |
| C1–C2 | 1.472 | 1.472 |
| C3–C4 | 1.449 | 1.451 |
C![[double bond, length as m-dash]](https://www.rsc.org/images/entities/char_e001.gif) O O |
1.217 | 1.218 |
| C–OH | 1.349 | 1.351 |
| O–H | 0.975 | 0.975 |
| O–Au | 2.882 | 2.905 |
The bond-length changes can be understood when looking at the electric charges with respect to the gold-cluster size. In all calculations, the gold cluster obtains a negative summed partial charge of approximately −0.1 e for the PDA–Au system and −0.2 e in the other systems, according to a Hirshfeld55–57 population analysis (−0.2 e for all systems according to a Mulliken analysis). Hence, electron density is transferred from the PDA to the gold. This process can be seen as a partial enolisation. Thus, the gold acts as a Lewis acid.58,59 It is interesting to note that the charge distribution in Au20 is not uniform but a Hirshfeld charge of approximately −0.02 e (−1.0 e in the Mulliken analysis) is found at each of the four tips, while the center atom on each face is charged as approximately +0.02 e (+1.3 e in Mulliken analysis). This symmetrical distribution of the charges in the Au20 leads to an overall dipole moment of zero.35 Despite having a zero dipole moment, the Au20 has a great ability to deform its electron density.
The dipole moment (defined as pointing from the negative to the positive charges) of the total system is pointing away from the gold cluster, approximately along the carbon chain of the PDA. The absolute values for the studied systems are compiled in Table 3. We find an increase of the dipole moment strength with cluster size with exception of the PDA–Au20 surface cluster. In the latter case, the bond between molecule and Au cluster is longer due to steric reasons compared to the other systems. As a consequence, the electrostatic interaction is less pronounced and the dipole moment is smaller. When comparing the trans and cis isomers, we see that already for the pure molecule the trans isomer exhibits a stronger dipole moment than the cis form. The difference of ∼0.5 D is retained also for the different Au-cluster systems (see Table 3).
| System |
![[small mu, Greek, macron]](https://www.rsc.org/images/entities/i_char_e0cd.gif) (D) (D) |
|
|---|---|---|
| trans | cis | |
| Isolated molecule | 1.7750 | 1.3012 |
| Au cluster | 4.1958 | 3.6838 |
| Au2 cluster | 6.4474 | 5.8688 |
| Au20 vertex cluster | 7.6507 | 7.0400 |
| Au20 surface cluster | 3.1824 | 2.6136 |
The presence of the gold clusters leaves the energetic differences between both isomers unaffected, where the trans form is always more stable than the cis isomer with an energy difference of 0.082 eV. Since the thermal energy provided at room temperature (298.15 K) is only 0.025 eV, the trans isomer is thermo-dynamically favored (trans/cis = 16:5 according to the Boltzmann distribution).
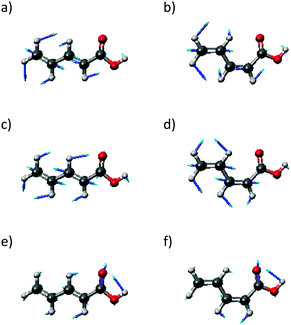
Next, we turn to the normal modes. We have identified three important ones for the study of the isomerization process, which we term the asymmetric C![[double bond, length as m-dash]](https://www.rsc.org/images/entities/char_e001.gif) C stretch (νaC
C stretch (νaC![[double bond, length as m-dash]](https://www.rsc.org/images/entities/char_e001.gif) C), the symmetric C
C), the symmetric C![[double bond, length as m-dash]](https://www.rsc.org/images/entities/char_e001.gif) C stretch (νsC
C stretch (νsC![[double bond, length as m-dash]](https://www.rsc.org/images/entities/char_e001.gif) C), and the carbonyl stretch (νC
C), and the carbonyl stretch (νC![[double bond, length as m-dash]](https://www.rsc.org/images/entities/char_e001.gif) O). They are indicated in Fig. 3 for the cis and the trans isomer, respectively. The main feature of νaC
O). They are indicated in Fig. 3 for the cis and the trans isomer, respectively. The main feature of νaC![[double bond, length as m-dash]](https://www.rsc.org/images/entities/char_e001.gif) C is that one of the C
C is that one of the C![[double bond, length as m-dash]](https://www.rsc.org/images/entities/char_e001.gif) C double bonds is enlarged while the other C
C double bonds is enlarged while the other C![[double bond, length as m-dash]](https://www.rsc.org/images/entities/char_e001.gif) C double bond is shortened. For νsC
C double bond is shortened. For νsC![[double bond, length as m-dash]](https://www.rsc.org/images/entities/char_e001.gif) C, both C
C, both C![[double bond, length as m-dash]](https://www.rsc.org/images/entities/char_e001.gif) C double bonds are stretched concertedly. The predominant vibration of νC
C double bonds are stretched concertedly. The predominant vibration of νC![[double bond, length as m-dash]](https://www.rsc.org/images/entities/char_e001.gif) O is along the C
O is along the C![[double bond, length as m-dash]](https://www.rsc.org/images/entities/char_e001.gif) O double bond although the other atoms of the PDA are also involved. The corresponding frequencies for the different systems are listed in Table 4.
O double bond although the other atoms of the PDA are also involved. The corresponding frequencies for the different systems are listed in Table 4.
| trans | cis | |||||||
|---|---|---|---|---|---|---|---|---|
| Mode |
![[small nu, Greek, tilde]](https://www.rsc.org/images/entities/i_char_e0e1.gif) /cm−1 /cm−1 |
I (IR)/km mol−1 | I (RS)/Å4 amu−1 | I rel (RRS) |
![[small nu, Greek, tilde]](https://www.rsc.org/images/entities/i_char_e0e1.gif) /cm−1 /cm−1 |
I (IR)/km mol−1 | I (RS)/Å4 amu−1 | I rel (RR) |
| PDA | ||||||||
ν
aC![[double bond, length as m-dash]](https://www.rsc.org/images/entities/char_e001.gif) C C
|
1613.9 | 81.01 | 2.9 | <0.01 | 1599.3 | 100.27 | 26.3 | 0.06 |
ν
sC![[double bond, length as m-dash]](https://www.rsc.org/images/entities/char_e001.gif) C C
|
1650.7 | 108.57 | 797.9 | 1.00 | 1644.9 | 72.99 | 482.7 | 1.00 |
νC![[double bond, length as m-dash]](https://www.rsc.org/images/entities/char_e001.gif) O O |
1746.1 | 254.96 | 21.3 | <0.01 | 1737.3 | 215.54 | 17.7 | 0.01 |
| PDA–Au | ||||||||
ν
aC![[double bond, length as m-dash]](https://www.rsc.org/images/entities/char_e001.gif) C C
|
1610.8 | 178.25 | 77.3 | 0.08 | 1594.1 | 204.67 | 117.0 | 0.20 |
ν
sC![[double bond, length as m-dash]](https://www.rsc.org/images/entities/char_e001.gif) C C
|
1632.5 | 476.90 | 1578.5 | 1.00 | 1632.0 | 264.17 | 799.8 | 1.00 |
νC![[double bond, length as m-dash]](https://www.rsc.org/images/entities/char_e001.gif) O O |
1673.6 | 211.75 | 64.9 | 0.04 | 1664.6 | 252.43 | 83.2 | <0.01 |
| PDA–Au2 | ||||||||
ν
aC![[double bond, length as m-dash]](https://www.rsc.org/images/entities/char_e001.gif) C C
|
1617.6 | 432.38 | 1082.3 | 0.73 | 1587.8 | 452.50 | 369.1 | 0.40 |
ν
sC![[double bond, length as m-dash]](https://www.rsc.org/images/entities/char_e001.gif) C C
|
1606.8 | 686.88 | 417.0 | 1.00 | 1618.0 | 419.04 | 651.9 | 1.00 |
νC![[double bond, length as m-dash]](https://www.rsc.org/images/entities/char_e001.gif) O O |
1661.5 | 124.03 | 40.2 | 0.06 | 1651.9 | 184.62 | 221.0 | 0.13 |
| PDA–Au20 vertex | ||||||||
ν
aC![[double bond, length as m-dash]](https://www.rsc.org/images/entities/char_e001.gif) C C
|
1608.0 | 742.65 | 1066.8 | <0.01 | 1590.5 | 658.71 | 715.6 | 0.45 |
ν
sC![[double bond, length as m-dash]](https://www.rsc.org/images/entities/char_e001.gif) C C
|
1622.4 | 978.96 | 3945.2 | 0.11 | 1623.3 | 780.96 | 2006.0 | 1.00 |
ν
C![[double bond, length as m-dash]](https://www.rsc.org/images/entities/char_e001.gif) O O
|
1666.1 | 195.94 | 362.43 | 1.00 | 1657.1 | 268.97 | 186.8 | 0.04 |
| PDA–Au20 surface | ||||||||
ν
aC![[double bond, length as m-dash]](https://www.rsc.org/images/entities/char_e001.gif) C C
|
1611.6 | 152.11 | 59.8 | <0.01 | 1595.3 | 187.57 | 119.0 | 0.12 |
ν
sC![[double bond, length as m-dash]](https://www.rsc.org/images/entities/char_e001.gif) C C
|
1642.8 | 377.45 | 2677.7 | 0.18 | 1639.1 | 194.05 | 872.7 | 1.00 |
ν
C![[double bond, length as m-dash]](https://www.rsc.org/images/entities/char_e001.gif) O O
|
1696.2 | 379.37 | 230.4 | 1.00 | 1690.4 | 394.20 | 332.9 | 0.15 |
(c) Infrared spectra (IR)
All IR spectra presented in this section have been limited to a frequency range from 1000 to 1800 cm−1 in order to focus on the normal modes of interest. All frequencies have been scaled by a factor of 0.97 (to account for a systematic error in the DFT predictions)60 and intensities convoluted by Lorentzians of 20 cm−1 full width at half maximum (FWHM)61 to account for line broadening in possible future experimental spectra.The intensity patterns in the IR spectra (Fig. 4) show a strong dependency on the size of the cluster. For the isolated molecule, the IR spectrum shows higher peaks in the range of the carbon–carbon single bond modes (νC–C, 1000–1300 cm−1) than in the νC![[double bond, length as m-dash]](https://www.rsc.org/images/entities/char_e001.gif) C range (1500–1800 cm−1). When the molecule interacts with one gold atom, the intensity ratio between these ranges is diminished for the cis isomer and even inverted for the trans isomer. Continuing with the PDA–Au2 and PDA–Au20 vertex cluster, this intensity inversion phenomenon is even more distinctive. In these cases, the νC–C modes are of minor importance with respect to the νC
C range (1500–1800 cm−1). When the molecule interacts with one gold atom, the intensity ratio between these ranges is diminished for the cis isomer and even inverted for the trans isomer. Continuing with the PDA–Au2 and PDA–Au20 vertex cluster, this intensity inversion phenomenon is even more distinctive. In these cases, the νC–C modes are of minor importance with respect to the νC![[double bond, length as m-dash]](https://www.rsc.org/images/entities/char_e001.gif) C modes. For the PDA–Au20 surface system, the trend does not continue, instead, the relative intensity patterns are very similar to the PDA–Au system. Note that the absolute intensities of the νC
C modes. For the PDA–Au20 surface system, the trend does not continue, instead, the relative intensity patterns are very similar to the PDA–Au system. Note that the absolute intensities of the νC![[double bond, length as m-dash]](https://www.rsc.org/images/entities/char_e001.gif) C modes increase when the gold cluster size increases (Table 4), while the νC
C modes increase when the gold cluster size increases (Table 4), while the νC![[double bond, length as m-dash]](https://www.rsc.org/images/entities/char_e001.gif) O intensities decrease. Again, the PDA–Au20 surface system is an exception to this rule, where the absolute intensities of the νC
O intensities decrease. Again, the PDA–Au20 surface system is an exception to this rule, where the absolute intensities of the νC![[double bond, length as m-dash]](https://www.rsc.org/images/entities/char_e001.gif) C modes are similar to the ones of the isolated molecule.
C modes are similar to the ones of the isolated molecule.
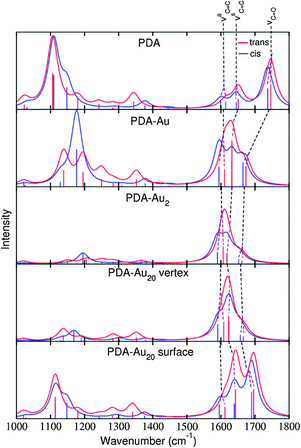 | ||
| Fig. 4 IR spectra of trans (red) and cis (blue) isomers of the different systems as indicated. The line spectra were convoluted by Lorentzians of 20 cm−1 FWHM. | ||
Not only the intensities change for different cluster sizes, also the frequencies are shifted. As stated above, the gold acts as a Lewis acid leading to a partial enolisation of PDA. Accordingly, the C![[double bond, length as m-dash]](https://www.rsc.org/images/entities/char_e001.gif) C double bonds are elongated, accompanied by a shift of νC
C double bonds are elongated, accompanied by a shift of νC![[double bond, length as m-dash]](https://www.rsc.org/images/entities/char_e001.gif) C to lower frequencies. In turn, the C–C single bonds are shortened leading to a partial double bond character and hence, the νC–C modes shift to higher frequencies. Also due to the enolisation effect, the bond length of the carboxyl group is increased and therefore, lower frequency values of the νC
C to lower frequencies. In turn, the C–C single bonds are shortened leading to a partial double bond character and hence, the νC–C modes shift to higher frequencies. Also due to the enolisation effect, the bond length of the carboxyl group is increased and therefore, lower frequency values of the νC![[double bond, length as m-dash]](https://www.rsc.org/images/entities/char_e001.gif) O mode can be observed. The absolute frequency shifts increase in the following order: PDA < PDA–Au20 surface < PDA–Au < PDA–Au20 vertex < PDA–Au2. This order is directly reflected in the changes of the respective bond lengths, which are collected in Table 2. Not only the bond lengths related to the aforementioned partial enolisation fit to the observed order; also the distance between the binding oxygen of the PDA and the nearest gold atom fits this series. This distance is the shortest in PDA–Au2 and the longest in PDA–Au20 surface. The reason for the long bond in the latter system is the steric hindrance between the OH group and the Au surface.
O mode can be observed. The absolute frequency shifts increase in the following order: PDA < PDA–Au20 surface < PDA–Au < PDA–Au20 vertex < PDA–Au2. This order is directly reflected in the changes of the respective bond lengths, which are collected in Table 2. Not only the bond lengths related to the aforementioned partial enolisation fit to the observed order; also the distance between the binding oxygen of the PDA and the nearest gold atom fits this series. This distance is the shortest in PDA–Au2 and the longest in PDA–Au20 surface. The reason for the long bond in the latter system is the steric hindrance between the OH group and the Au surface.
It becomes clear that the geometry of the metal nanocluster where the molecule binds is of vital importance (see also ref. 62), leading to different results. Especially, the planar binding site in PDA–Au20 surface compared to the tetrahedral one in PDA–Au20 vertex (which resembles a metallic tip) shows intrinsic differences which can be interesting, e.g., in the understanding of SERS and TERS or, in this case, SEIRA. Note that our simulations can reproduce only a part of the SEIRA enhancement mechanism, plasmonic contributions18 or phenomena like hot electrons63,64 are not described in the present approach.
We show additionally that the above-discussed changes are more pronounced in the trans than in the cis isomer (see Fig. 4). This difference is similar to the one for the dipole moment discussed above. The reason is that the trans isomer is bound closer to the Au cluster than the cis isomer.
If we want to distinguish between the isomers, IR spectra are expected to be unsuited, since the spectra are very similar for typical linewidths (see Fig. 4). High-resolution spectroscopy15 could solve this problem. In this case, the attachment to gold clusters leads to more pronounced differences in the spectra and makes the differentiation between the isomers easier. Also the influence of the gold cluster size as described above could then be studied experimentally. However, if conventional IR spectra are recorded, the limited resolution might make such a task impossible. Consequently, other types of spectroscopy are considered in the following.
(d) Raman scattering (RS)
The RS spectra presented in this section have been prepared analogously to the IR spectra. Also the RS spectra are shown for a frequency range from 1000 to 1800 cm−1 (see Fig. 5), all frequencies have been scaled by a factor of 0.97 and convoluted by Lorentzians of 20 cm−1 FWHM to account for a typical line broadening.65 In order to simulate off-resonance RS, the excitation wavelength is chosen to be 1064 nm (≅1.2 eV), where no transitions to electronic excited states are induced (see next section).The frequencies of the vibrational modes are naturally the same as in the IR spectra. Due to the low symmetry of the system, especially when including the gold clusters, normal modes are obtained which are both IR and Raman active. Therefore, the properties of the frequencies in the Raman spectra have been already discussed in the previous section.
Looking at the intensities of the RS spectra (Fig. 5), one observes that the νC![[double bond, length as m-dash]](https://www.rsc.org/images/entities/char_e001.gif) C modes are dominating while the νC–C and νC
C modes are dominating while the νC–C and νC![[double bond, length as m-dash]](https://www.rsc.org/images/entities/char_e001.gif) O modes – in contrast to the IR spectra – are less intense. No clear trend is found for the absolute intensities, in some cases the signal for νaC
O modes – in contrast to the IR spectra – are less intense. No clear trend is found for the absolute intensities, in some cases the signal for νaC![[double bond, length as m-dash]](https://www.rsc.org/images/entities/char_e001.gif) C is the strongest, in other cases the one for νsC
C is the strongest, in other cases the one for νsC![[double bond, length as m-dash]](https://www.rsc.org/images/entities/char_e001.gif) C, see Table 4. However, the absolute intensities of the νC
C, see Table 4. However, the absolute intensities of the νC![[double bond, length as m-dash]](https://www.rsc.org/images/entities/char_e001.gif) C and νC
C and νC![[double bond, length as m-dash]](https://www.rsc.org/images/entities/char_e001.gif) O modes are higher for the larger gold clusters. This effect is well-known and contributes to the chemical enhancement mechanism in SERS.18,66 Note that a full simulation of SERS spectra requires incorporating additional mechanisms like the electromagnetic enhancement induced by plasmonic excitations, see e.g.ref. 18 and 67. Table 4 also shows that the absolute intensities are higher for the PDA–Au20 vertex than for the PDA–Au20 surface system. This fact, once again, shows that the geometry of the metal nanostructure, where the molecule is attached, is important. Additionally, the absolute intensities are higher for the trans than for the cis systems and also the increase with gold-cluster size is more pronounced for the trans isomers. However, this effect in absolute intensity can be rarely observed in experimental spectra since the measurement of absolute scattering cross sections is difficult. Therefore, the spectra in Fig. 5 are normalized with respect to the highest peak of each spectrum as is often done in experiments. In combination with the typical line broadening, a distinction between cis and trans isomers is hardly possibly using RS. Higher resolution is commonly obtained employing RRS spectroscopy, which will be discussed below. As a pre-condition for RRS, information about the energies of the electronic excited states is required and thus, the UV absorption spectra will be discussed in the following.
O modes are higher for the larger gold clusters. This effect is well-known and contributes to the chemical enhancement mechanism in SERS.18,66 Note that a full simulation of SERS spectra requires incorporating additional mechanisms like the electromagnetic enhancement induced by plasmonic excitations, see e.g.ref. 18 and 67. Table 4 also shows that the absolute intensities are higher for the PDA–Au20 vertex than for the PDA–Au20 surface system. This fact, once again, shows that the geometry of the metal nanostructure, where the molecule is attached, is important. Additionally, the absolute intensities are higher for the trans than for the cis systems and also the increase with gold-cluster size is more pronounced for the trans isomers. However, this effect in absolute intensity can be rarely observed in experimental spectra since the measurement of absolute scattering cross sections is difficult. Therefore, the spectra in Fig. 5 are normalized with respect to the highest peak of each spectrum as is often done in experiments. In combination with the typical line broadening, a distinction between cis and trans isomers is hardly possibly using RS. Higher resolution is commonly obtained employing RRS spectroscopy, which will be discussed below. As a pre-condition for RRS, information about the energies of the electronic excited states is required and thus, the UV absorption spectra will be discussed in the following.
(e) Absorption spectra (UV)
The study of the absorption spectra can provide valuable insight into the electronic structure and hence, the discrimination of different switch states might be possible directly. Beyond this fact, a study of the absorption spectra is needed in order to select the excited states which are in resonance in RRS and to identify the states with the properties of interest. In the present study, special attention is paid to states that have an important π → π* contribution, because this transition influences the nature of the double bonds which are key for the cis/trans isomerization of the PDA molecule.The absorption spectra are shown in Fig. 6. They are generated from TDDFT simulations, where the obtained line spectrum is broadened with Lorentzians of 0.05 eV FWHM. The computations include a maximum number of 10, 20, 50 or 1000 excited states for PDA, PDA–Au, PDA–Au2 or PDA–Au20, respectively. For further analysis, all computed electronic excited states are classified according to the nature of the Kohn–Sham orbitals participating in the transitions.68
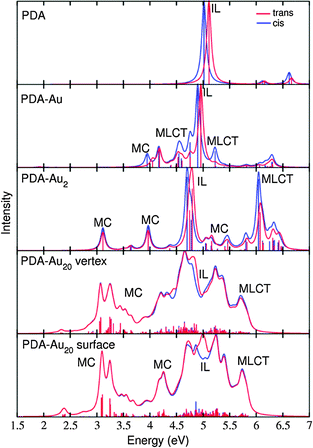 | ||
| Fig. 6 Absorption spectra of trans (red) and cis (blue) isomers for the systems under study. The transitions were broadened by Lorentzians of 0.05 eV FWHM. | ||
In the following, states involving transitions, where both the initial and the final orbital are localized in the metal cluster alone, are termed metal center (MC) states. If the participating orbitals are localized only in the PDA molecule, which can be called ligand in order to stay in the terminology used for metallo-organic compounds, the corresponding state is termed intra-ligand (IL) state. If transitions from orbitals in the metal cluster to orbitals in the ligand play a role, the state is labeled as metal–ligand charge-transfer (MLCT) state. Obviously, an electronic state is not necessarily pure and also mixtures of MC, IL and MLCT character may occur.
The absorption spectra (Fig. 6) reveal how the excited state composition changes for the different molecule-gold clusters. The low energy region of the absorption spectra is governed by MC states, the IL state of interest (with π → π* transition) is found approximately between 4.5 and 5.5 eV and the high energy region (above 5.5 eV) is dominated by MLCT states.
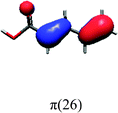
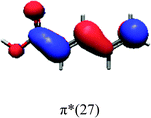
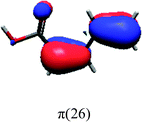
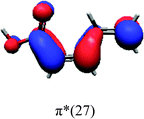
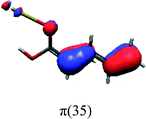
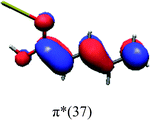
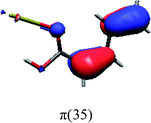
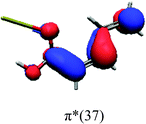
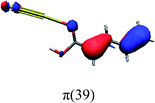
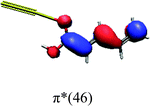
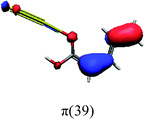
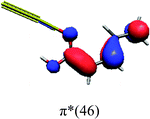
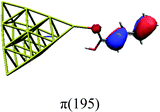
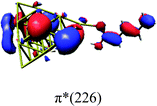
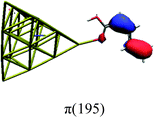
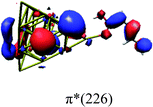
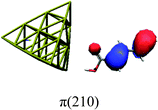
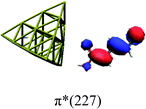
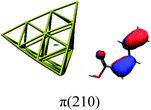
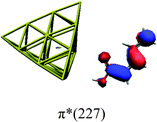
In order to identify the desired π → π* state, the simulation outcome is scanned for the orbitals of interest. These orbitals are plotted in Table 5 for the respective systems. States with a large contribution of this π → π* transition are collected in Table 6.
| trans | cis | ||||||||
|---|---|---|---|---|---|---|---|---|---|
| State | ΔE/eV | f | Character | c 2/% | State | ΔE/eV | f | Character | c 2/% |
| PDA | |||||||||
| 2 | 5.1104 | 0.706 | IL | 99.9 | 2 | 5.0166 | 0.566 | IL | 99.9 |
| PDA–Au | |||||||||
| 24 | 4.9584 | 0.778 | IL | 48.8 | 24 | 4.8998 | 0.492 | IL | 45.0 |
| MC | 51.2 | MC | 55.0 | ||||||
| PDA–Au2 | |||||||||
| 17 | 4.7440 | 0.357 | IL | 32.2 | 17 | 4.6978 | 0.495 | IL | 73.0 |
| MC | 67.8 | MC | 27.0 | ||||||
| 19 | 4.7981 | 0.547 | IL | 50.6 | 20 | 4.7771 | 0.207 | IL | 14.2 |
| MC | 49.4 | MC | 85.8 | ||||||
| PDA–Au20 vertex | |||||||||
| 433 | 4.5859 | 0.085 | IL | 3.6 | 434 | 4.5807 | 0.031 | IL | 7.8 |
| MC | 71.9 | MC | 80.7 | ||||||
| MLCT | 24.5 | MLCT | 11.5 | ||||||
| 445 | 4.6142 | 0.018 | IL | 8.6 | 459 | 4.6482 | 0.154 | IL | 2.8 |
| MC | 68.6 | MC | 97.2 | ||||||
| MLCT | 22.8 | ||||||||
| 456 | 4.6390 | 0.043 | IL | 2.6 | 519 | 4.7925 | 0.081 | IL | 3.2 |
| MC | 80.0 | MC | 94.0 | ||||||
| MLCT | 17.4 | MLCT | 2.8 | ||||||
| 458 | 4.6487 | 0.140 | IL | 3.2 | |||||
| MC | 94.4 | ||||||||
| MLCT | 2.4 | ||||||||
| 539 | 4.8344 | 0.133 | IL | 2.4 | |||||
| MC | 68.8 | ||||||||
| MLCT | 28.8 | ||||||||
| PDA–Au20 surface | |||||||||
| 544 | 4.8733 | 0.080 | IL | 4.6 | 544 | 4.8659 | 0.177 | IL | 21.0 |
| MC | 95.4 | MC | 79.0 | ||||||
| 552 | 4.8952 | 0.046 | IL | 5.0 | 567 | 4.9245 | 0.095 | IL | 6.8 |
| MC | 90.6 | MC | 93.2 | ||||||
| MLCT | 4.4 | ||||||||
| 579 | 4.9576 | 0.060 | IL | 7.4 | 586 | 4.9692 | 0.050 | IL | 2.4 |
| MC | 83.2 | MC | 86.8 | ||||||
| MLCT | 9.4 | MLCT | 10.8 | ||||||
| 590 | 4.9833 | 0.081 | IL | 5.2 | |||||
| MC | 94.8 | ||||||||
| 592 | 4.9890 | 0.089 | IL | 4.8 | |||||
| MC | 92.3 | ||||||||
| MLCT | 2.9 | ||||||||
While for the pure PDA molecule the π·π* orbitals are important only for a single electronic state, the situation is more complex if metal atoms are added. For the cluster systems, the character of the states of interest is mixed and e.g. for the PDA–Au20 surface system, the states are a mixture of IL (only 5–10%, including π → π*), MLCT, and MC type. A clear classification of the state character is hence impossible for the larger clusters, not only because of the mixing of transitions but also because the orbitals themselves already show some mixed character, see e.g. small contributions localized in the metal for the π orbitals of PDA–Au or PDA–Au2 as shown in Table 5. This phenomenon is even more pronounced for the π* orbital of the PDA–Au20 vertex system. Such mixed orbitals are quite common and further conclusions based on this fact are difficult since in general a specific molecular orbital basis is not unique. However, the observed mixture may indicate that the different parts of the system (PDA molecule and metal cluster) may not be seen as separate fragments but are entangled to a great extent.
When comparing the cis and trans isomers, we find it difficult to distinguish the two forms of the respective systems, see Fig. 6 and Table 6. However, small differences can be found and these will lead to noticeable differences in the RRS spectra, as discussed in the next section.
(f) Resonance Raman scattering (RRS)
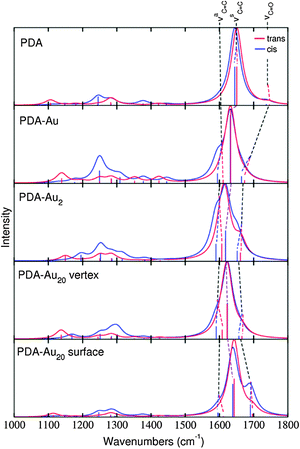
Fig. 7 shows the RRS spectra of the different PDA systems. All spectra are prepared in the same manner as the IR and RS spectra previously, i.e., a frequency range from 1000 to 1800 cm−1 has been adopted and all the frequencies have been scaled by a factor of 0.97. Since RRS spectra offer high resolution,43 the obtained line spectra have been convoluted by Lorentzians of 5 cm−1 FWHM.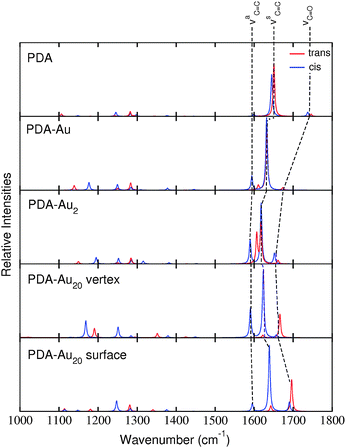 | ||
| Fig. 7 RRS spectra of trans (red) and cis (blue) isomers of the various systems. The line spectra were convoluted by Lorentzians of 5 cm−1 FWHM. | ||
The wavelength for the resonant excitation is chosen to match the energy difference between the electronic ground state and the IL states with a strong oscillator strength and the biggest contribution of the transition π → π*. The selected states and their energies, oscillator strengths and characters are presented in Table 6.
As intended by the choice of the excitation wavelength, the RRS spectra are dominated by peaks in the region of the νC![[double bond, length as m-dash]](https://www.rsc.org/images/entities/char_e001.gif) C modes.
C modes.
The RRS spectra of the isolated PDA molecule are very similar comparing the cis and trans isomers. Only minor changes are observed for the molecule attached to a single gold atom. For the PDA–Au2 system, differences are visible in the RRS spectra. The vibrational mode νaC![[double bond, length as m-dash]](https://www.rsc.org/images/entities/char_e001.gif) C is shifted to higher wavenumbers in the trans isomer, while the cis isomer exhibits approximately the same frequency as the pure molecule. Differences in the spectra are even more pronounced for the PDA–Au20 clusters. The trans isomers of the PDA–Au20 surface and PDA–Au20 vertex systems show an intense peak for the normal mode νC
C is shifted to higher wavenumbers in the trans isomer, while the cis isomer exhibits approximately the same frequency as the pure molecule. Differences in the spectra are even more pronounced for the PDA–Au20 clusters. The trans isomers of the PDA–Au20 surface and PDA–Au20 vertex systems show an intense peak for the normal mode νC![[double bond, length as m-dash]](https://www.rsc.org/images/entities/char_e001.gif) O (1666.1 and 1696.2 cm−1 respectively), while the cis isomer exhibits an intense νsC
O (1666.1 and 1696.2 cm−1 respectively), while the cis isomer exhibits an intense νsC![[double bond, length as m-dash]](https://www.rsc.org/images/entities/char_e001.gif) C mode (1623.3 and 1639.1 cm−1 respectively). Additionally, the mode νaC
C mode (1623.3 and 1639.1 cm−1 respectively). Additionally, the mode νaC![[double bond, length as m-dash]](https://www.rsc.org/images/entities/char_e001.gif) C at 1595.3 cm−1 is enhanced in the cis isomer of the PDA–Au20 vertex system, while in the trans isomer this vibrational normal mode has a very low intensity.
C at 1595.3 cm−1 is enhanced in the cis isomer of the PDA–Au20 vertex system, while in the trans isomer this vibrational normal mode has a very low intensity.
Such differences are not observed in the RS spectra (see Section d), where no resonance enhancement is present. Hence, these differences stem from the differing excited states which are involved for the cis or the trans isomer, respectively (see the different composition of the respective states in Table 6).
As stated above (see Section d), the attachment of a molecule to gold nanoparticles leads to significant enhancement of the spectroscopic signals. Hence, only a small amount of a substance is needed to carry out an analysis, i.e., to record a SERRS spectrum in this case. The spectra presented here predict such SERRS signals, since the chemical effect included in the present calculations is mainly responsible for the relative intensities of the peaks, while plasmonic effects (neglected here) primarily influence the absolute intensities.66,67
From the different points given above, we infer that a combination of RRS and attachment to metal clusters is well-suited to distinguish between molecular species which are difficult to discern using other types of spectroscopy. The critical difference in the intensities of the νC![[double bond, length as m-dash]](https://www.rsc.org/images/entities/char_e001.gif) C and νC
C and νC![[double bond, length as m-dash]](https://www.rsc.org/images/entities/char_e001.gif) O modes are the reason why we can discriminate between both isomers of PDA in the present case.
O modes are the reason why we can discriminate between both isomers of PDA in the present case.
IV. Conclusions
We presented a computational study focused in the discrimination between the cis and trans isomers of the PDA molecule attached to gold clusters of different size using different spectroscopic techniques. It was shown that the interaction between our molecule and the gold clusters leads to a partial enolisation of the two isomers, which affects the intensity pattern of IR and RS spectra. The effect is more pronounced for larger gold clusters, however, the respective cis and trans isomers show very similar spectra.Furthermore, we investigated properties of the excited states and simulated UV absorption spectra giving insight into how the molecule interacts with the gold cluster at higher energies. The data obtained in this way was then used in the simulation of RRS spectra. Finally, we found that RRS spectroscopy is a suitable tool for the discrimination of the PDA isomers attached to gold nanoparticles. Reasons are a high spectral resolution and more importantly, that excited-state properties influence the signal strength of vibrational modes differently for the different isomers.
Additionally, we have shown that the position where the molecule binds to a larger cluster matters. In the present study, the Au20 vertex and Au20 surface positions were compared and found to yield different spectra.
Last but not least, we hope to encourage experimental studies on the presented system in order to compare to the results that we showed in this work.
Acknowledgements
This work has been supported by the German Federal Ministry of Education and Research within the research initiative Phona. J. G. is grateful to the 7th Framework Programme of the European Union (Grant No. 321971). Generous allocation of computer time at the computer centers of Jena and Leipzig as well as the Vienna Scientific Cluster (VSC) is gratefully acknowledged.References
- M. Weinelt and F. von Oppen, J. Phys.: Condens. Matter, 2012, 24, 390201 CrossRef PubMed.
- P. Marquetand, S. Gräfe, D. Scheidel and V. Engel, J. Chem. Phys., 2006, 124, 054325 CrossRef PubMed.
- K. Hoki, M. Sato, M. Yamaki, R. Sahnoun, L. Gonzalez, S. Koseki and Y. Fujimura, J. Phys. Chem. B, 2004, 108, 4916 CrossRef CAS.
- G. Pérez-Hernández, A. Pelzer, L. González and T. Seideman, New J. Phys., 2010, 12, 075007 CrossRef.
- B. Klaumünzer and D. Kröner, New J. Chem., 2009, 33, 186 RSC.
- D. Kinzel, P. Marquetand and L. González, J. Phys. Chem. A, 2012, 116, 2743 CrossRef CAS PubMed.
- P. Marquetand, P. Nuernberger, T. Brixner and V. Engel, J. Chem. Phys., 2008, 129, 074303 CrossRef PubMed.
- S. Banerjee, D. Kröner and P. Saalfrank, J. Chem. Phys., 2012, 137, 22A534 CrossRef PubMed.
- B. Feringa and W. Browne, Molecular Switches, 2nd edn, 2011, vol. 1 Search PubMed.
- J. J. Bajo, J. González-Vázquez, I. Sola, J. Santamaria, M. Richter, P. Marquetand and L. González, J. Phys. Chem. A, 2012, 116, 2800 CrossRef CAS PubMed.
- K. Lu, G. Finn, T. Lee and L. Nicholson, Nat. Chem. Biol., 2007, 3, 619 CrossRef CAS PubMed.
- R. Rowan, A. Warshel, B. D. Skyes and M. Karplus, Biochemistry, 1974, 13, 970 CrossRef CAS.
- C. Dugave and L. Demange, Chem. Rev., 2003, 103, 2475 CrossRef CAS PubMed.
- W. Browne and B. Feringa, Annu. Rev. Phys. Chem., 2009, 60, 407 CrossRef CAS PubMed.
- M. Quack, Fundamental Symmetries and Symmetry Violations from High Resolution Spectroscopy, John Wiley & Sons, Ltd, 2011 Search PubMed.
- M. Osawa, Surface-enhanced infrared absorption, in Near-Field Optics and Surface Plasmon Polaritons, Topics in Applied Physics, ed. S. Kawata, Springer Berlin Heidelberg, 2001, vol. 81, pp. 163–187 Search PubMed.
- R. Aroca, D. Ross and C. Domingo, Appl. Spectrosc., 2004, 58, 324A CrossRef CAS PubMed.
- S. M. Morton, D. W. Silverstein and L. Jensen, Chem. Rev., 2011, 111, 3962 CrossRef CAS PubMed.
- J. Guthmuller, F. Cecchet, D. Lis, Y. Caudano, A. A. Mani, P. A. Thiry, A. Peremans and B. Champagne, ChemPhysChem, 2009, 10, 2132 CrossRef CAS PubMed.
- C. Feugmo and V. Liègeois, ChemPhysChem, 2013, 14, 1633 CrossRef PubMed.
- L. Jensen, C. M. Aikens and G. C. Schatz, Chem. Soc. Rev., 2008, 37, 1061 RSC.
- D. Cialla, A. März, R. Böhme, F. Theil, K. Weber, M. Schmitt and J. Popp, Anal. Bioanal. Chem., 2012, 403, 27 CrossRef CAS PubMed.
- L. Tong, T. Zhu and Z. Liu, Chem. Soc. Rev., 2011, 40, 1296 RSC.
- S. Schlücker, Angew. Chem., Int. Ed., 2014, 53, 4756 CrossRef PubMed.
- E. Bailo and V. Deckert, Chem. Soc. Rev., 2008, 37, 921 RSC.
- B. Pettinger, P. Schambach, C. J. Villagómez and N. Scott, Annu. Rev. Phys. Chem., 2012, 63, 379 CrossRef CAS PubMed.
- C. Blum, L. Opilik, J. M. Atkin, K. Braun, S. B. Kämmer, V. Kravtsov, N. Kumar, S. Lemeshko, J.-F. Li, K. Luszcz, T. Maleki, A. J. Meixner, S. Minne, M. B. Raschke, B. Ren, J. Rogalski, D. Roy, B. Stephanidis, X. Wang, D. Zhang, J.-H. Zhong and R. Zenobi, J. Raman Spectrosc., 2014, 45, 22 CrossRef CAS.
- D. Zhang, X. Wang, K. Braun, H.-J. Egelhaaf, M. Fleischer, L. Hennemann, H. Hintz, C. Stanciu, C. J. Brabec, D. P. Kern and A. J. Meixner, J. Raman Spectrosc., 2009, 40, 1371 CrossRef CAS.
- T. Böhler, A. Edtbauer and E. Scheer, Phys. Rev. B: Condens. Matter Mater. Phys., 2007, 76, 125432 CrossRef.
- N. Okabayashi, M. Paulsson and T. Komeda, Prog. Surf. Sci., 2013, 88, 1 CrossRef CAS PubMed.
- J.-C. Leng, L. Lin, X.-N. Song, Z.-L. Li and C.-K. Wang, J. Phys. Chem. C, 2009, 113, 18353 CAS.
- M.-L. Bocquet and B. Wang, Prog. Surf. Sci., 2010, 85, 435 CrossRef CAS PubMed.
- A. Ségerie, V. Liégeois, B. Champagne, L.-L. Lin and Y. Luo, J. Phys. Chem. A, 2013, 117, 12783 CrossRef PubMed.
- S. Weigelt, C. Busse, L. Petersen, E. Rauls, B. Hammer, K. V. Gothelf, F. Besenbacher and T. R. Linderoth, Nat. Mater., 2006, 5, 112 CrossRef CAS PubMed.
- B. Assadollahzadeh and P. Schwerdtfeger, J. Chem. Phys., 2009, 131, 064306 CrossRef PubMed.
- D. Schooss, P. Weis, O. Hampe and M. Kappes, Philos. Trans. R. Soc., A, 2010, 368, 1211 CrossRef CAS PubMed.
- P. Gruene, D. M. Rayner, B. Redlich, A. F. G. Van Der Meer, J. T. Lyon, G. Meijer and A. Fielicke, Science, 2008, 321, 674 CrossRef CAS PubMed.
- M. J. Frisch, G. W. Trucks, H. B. Schlegel, G. E. Scuseria, M. A. Robb, J. R. Cheeseman, G. Scalmani, V. Barone, B. Mennucci, G. A. Petersson, H. Nakatsuji, M. Caricato, X. Li, H. P. Hratchian, A. F. Izmaylov, J. Bloino, G. Zheng, J. L. Sonnenberg, M. Hada, M. Ehara, K. Toyota, R. Fukuda, J. Hasegawa, M. Ishida, T. Nakajima, Y. Honda, O. Kitao, H. Nakai, T. Vreven, J. A. Montgomery, Jr., J. E. Peralta, F. Ogliaro, M. Bearpark, J. J. Heyd, E. Brothers, K. N. Kudin, V. N. Staroverov, R. Kobayashi, J. Normand, K. Raghavachari, A. Rendell, J. C. Burant, S. S. Iyengar, J. Tomasi, M. Cossi, N. Rega, J. M. Millam, M. Klene, J. E. Knox, J. B. Cross, V. Bakken, C. Adamo, J. Jaramillo, R. Gomperts, R. E. Stratmann, O. Yazyev, A. J. Austin, R. Cammi, C. Pomelli, J. W. Ochterski, R. L. Martin, K. Morokuma, V. G. Zakrzewski, G. A. Voth, P. Salvador, J. J. Dannenberg, S. Dapprich, A. D. Daniels, Ö. Farkas, J. B. Foresman, J. V. Ortiz, J. Cioslowski and D. J. Fox, Gaussian 09, revision a.1, Gaussian, Inc.: Wallingford CT, 2009 Search PubMed.
- P. Hohenberg and W. Kohn, Phys. Rev., 1964, 136, B864 CrossRef.
- A. D. Becke, Phys. Rev. A: At., Mol., Opt. Phys., 1988, 38, 3098 CrossRef CAS.
- C. Lee, W. Yang and R. G. Parr, Phys. Rev. B: Condens. Matter Mater. Phys., 1988, 37, 785 CrossRef CAS.
- S. H. Vosko, L. Wilk and M. Nusair, Can. J. Phys., 1980, 58, 1200 CrossRef CAS PubMed.
- J. Guthmuller, J. Chem. Theory Comput., 2011, 7, 1082 CrossRef CAS.
- R. Krishnan, J. S. Binkley, R. Seeger and J. A. Pople, J. Chem. Phys., 1980, 72, 650 CrossRef CAS PubMed.
- M. Burkatzki, C. Filippi and M. Dolg, J. Chem. Phys., 2007, 126, 234105 CrossRef CAS PubMed.
- S. A. Serapian, M. J. Bearpark and F. Bresme, Nanoscale, 2013, 5, 6445 RSC.
- E. Runge and E. K. U. Gross, Phys. Rev. Lett., 1984, 52, 997 CrossRef CAS.
- J. Guthmuller and B. Champagne, J. Chem. Phys., 2007, 127, 164507 CrossRef PubMed.
- T. Petrenko and F. Neese, J. Chem. Phys., 2007, 127, 164319 CrossRef PubMed.
- M. Thomas, F. Latorre and P. Marquetand, J. Chem. Phys., 2013, 138, 044101 CrossRef PubMed.
- E. J. Heller, R. Sundberg and D. Tannor, J. Phys. Chem., 1982, 86, 1822 CrossRef CAS.
- M. Wächtler, J. Guthmuller, L. González and B. Dietzek, Coord. Chem. Rev., 2012, 256, 1479 CrossRef PubMed.
- J. Guthmuller, B. Champagne, C. Moucheron and A. Kirsch De Mesmaeker, J. Phys. Chem. B, 2010, 114, 511 CrossRef CAS PubMed.
- J. Guthmuller and L. González, Phys. Chem. Chem. Phys., 2010, 12, 14812 RSC.
- F. Hirshfeld, Theor. Chim. Acta, 1977, 44, 129 CrossRef CAS.
- J. P. Ritchie, J. Am. Chem. Soc., 1985, 107, 1829 CrossRef CAS.
- J. P. Ritchie and S. M. Bachrach, J. Comput. Chem., 1987, 8, 499 CrossRef CAS.
- I. Kamiya, H. Tsunoyama, T. Tsukuda and H. Sakurai, Chem. Lett., 2007, 36, 646 CrossRef CAS.
- M. Stratakis and H. Garcia, Chem. Rev., 2012, 112, 4469 CrossRef CAS PubMed.
- J. P. Merrick, D. Moran and L. Radom, J. Phys. Chem. A, 2007, 111, 11683 CrossRef CAS PubMed.
- K. Esperdy and D. D. Shillady, J. Chem. Inf. Comput. Sci., 2001, 41, 1547 CrossRef CAS PubMed.
- J. L. Payton, S. M. Morton, J. E. Moore and L. Jensen, Acc. Chem. Res., 2014, 47, 88–99 CrossRef CAS PubMed.
- S. Mukherjee, F. Libisch, N. Large, O. Neumann, L. V. Brown, J. Cheng, J. B. Lassiter, E. A. Carter, P. Nordlander and N. J. Halas, Nano Lett., 2013, 13, 240 CrossRef CAS PubMed.
- M. W. Knight, Y. Wang, A. S. Urban, A. Sobhani, B. Y. Zheng, P. Nordlander and N. J. Halas, Nano Lett., 2013, 13, 1687 CAS.
- F. Negri, C. Castiglioni, M. Tommasini and G. Zerbi, J. Phys. Chem. A, 2002, 106, 3306 CrossRef CAS.
- J. R. Lombardi and R. L. Birke, J. Phys. Chem. C, 2008, 112, 5605 CAS.
- M. Thomas, S. Mühlig, T. Deckert-Gaudig, C. Rockstuhl, V. Deckert and P. Marquetand, J. Raman Spectrosc., 2013, 44, 1497 CrossRef CAS.
- R. Stowasser and R. Hoffmann, J. Am. Chem. Soc., 1999, 121, 3414 CrossRef CAS.
| This journal is © the Owner Societies 2015 |

