 Open Access Article
Creative Commons Attribution 3.0 Unported Licence
Differences in single and aggregated nanoparticle plasmon spectroscopy
Pushkar
Singh
a,
Tanja
Deckert-Gaudig
a,
Henrik
Schneidewind
a,
Konstantin
Kirsch
a,
Evelien M.
van Schrojenstein Lantman
b,
Bert M.
Weckhuysen
*b and
Volker
Deckert
*ac
aLeibniz Institute of Photonic Technology, Albert-Einstein-Str. 9, 07745 Jena, Germany
bInorganic Chemistry and Catalysis, Debye Institute for Nanomaterial Science, Utrecht University, Universiteitsweg 99, 3584 CG Utrecht, The Netherlands. E-mail: b.m.weckhuysen@uu.nl
cInstitute of Physical Chemistry and Abbe Center of Photonics, Friedrich-Schiller University Jena, Helmholtzweg 4, 07743 Jena, Germany. E-mail: volker.deckert@ipht-jena.de
First published on 10th December 2014
Abstract
Vibrational spectroscopy usually provides structural information averaged over many molecules. We report a larger peak position variation and reproducibly smaller FWHM of TERS spectra compared to SERS spectra indicating that the number of molecules excited in a TERS experiment is extremely low. Thus, orientational averaging effects are suppressed and micro ensembles are investigated. This is shown for a thiophenol molecule adsorbed on Au nanoplates and nanoparticles.
Tip-enhanced Raman scattering (TERS) allows investigating molecular information on the nanometer scale. This technique is a combination of scanning probe microscopy (SPM) and Raman spectroscopy, which is applied in different branches of nano-sciences enabling high spatial resolution and high sensitivity simultaneously. A metal-coated atomic force microscope tip produces localized surface plasmon resonance (LSPR) when illuminated with an appropriate wavelength of light. This leads to a Raman signal enhancement of several orders of magnitude. Additionally, due to the confinement of the electromagnetic field at the tip apex, a spatial resolution in the nanometer range can be achieved.1–4
Recent experiments indicate that even single molecules can be detected using TERS.5–8 Thus it is an excellent tool to get vibrational information down to a single molecule (SM) level as well as to perform fundamental research where high spatial resolution is required e.g. distinction of isotopes,6 nano-scale pressure sensors,9 identification of nano-oxidation sites in biological molecules,10 separation of lipid and protein domains in a single cell,11 the study of molecular catalytic reaction,12etc.
In many cases it seems to be sensible to compare the well-known surface-enhanced Raman scattering (SERS) spectra of a compound with the data obtained by a TERS experiment due to identical enhancement mechanisms in both types of experiments. However, variations in the peak position and full-width-half-maximum (FWHM) in many TERS and SERS experiments can hardly be ignored. In general, band position fluctuation and sometimes even the suppression of a band reflects a specific molecular environment. Thus, information regarding molecular orientation, adsorption site, bond strength and molecular environment can be extracted.12,13
In a typical SM-SERS experiment13–17 a very low concentration of molecules (<10−8 M) is used to ensure that on average less than one molecule is present in the large electromagnetic field of the laser focus. In such SM experiments large peak position fluctuations are observed.18 TERS can be regarded as close to SM-SERS experiments where the signal-enhancing unit is reduced to a single nanoparticle. Consequently, only a few molecules experience the above mentioned signal enhancement. Considering this, vibrational spectra collected at the SM level using SERS and TERS should look alike and provide similar chemical information. On the other hand, one important difference between SERS and TERS experiments must be considered: as the tip can be positioned freely, the interaction between the molecule and the nanoparticle in TERS does not have to be thermodynamically or kinetically favored. In SERS, in contrast, molecules will preferentially bind to favored sites. This can lead to a broader variation in potential conformations in a TERS experiment.
TERS has already been applied to study the tip position and time dependent properties of DNA nucleobases by different groups.19–22 Temporal variations in contact-mode TERS spectra of an adenine crystal show large peak position fluctuations.19 This was attributed to changes in the molecular orientation with respect to the tip and chemical interaction of the tip with the sample. Recently, the position and time dependent TERS spectra of an adenine homopolymer were studied in a gap mode arrangement.21 These studies demonstrate that characteristic bands are reproducibly detected but fluctuations in the peak position are always an issue and that sample orientation with respect to tip plays a vital role.
While band position fluctuations in TERS with resonantly excited molecules have already been studied by the van Duyne group and the variations have been attributed to the variations in the excited state properties,23,24 to our knowledge a direct comparison to non-resonant molecules and their corresponding SERS data regarding such fluctuations is missing. As aforementioned, SERS spectra are usually the closest reference data available and a better understanding of the reliability of SERS data for TERS spectra assignment is desirable. Here, TERS and SERS data of thiophenol were compared. Thiophenol was chosen to keep the system comparably simple and to control orientation and coverage of the molecule by specific adsorption via the thiol group to a single atomically flat gold nanoplate (TERS) and gold nanoparticles (SERS), respectively. From the results it was concluded that the main reason for peak fluctuations in TERS is the small number of molecules in the sampled area and their specific orientation.
The experimental TERS setup has been described in detail elsewhere.20 In short, laser radiation is focused in transmission geometry on a silver coated AFM non-contact tip using an oil immersion microscope objective (40X, 1.35NA, Olympus). The AFM head (JPK AG, Germany) is mounted on an inverted microscope. The scattered TERS signal is collected using the same objective and passes through a dichroic mirror and notch filter before it enters the spectrometer (Action Advanced SP2750 A, SI GmbH, Germany). The same setup was used for the all SERS measurements. TERS and SERS spectra were recorded using 532 nm laser excitation and using 10 s acquisition time. The power on the sample was 830 μW (TERS) and 810 μW (SERS), respectively, in order to achieve a similar signal-to-noise ratio in the spectra.
Synthesis of gold nanoplates on chemically cleaned glass slides (concentration HNO3/30% H2O2 (3![[thin space (1/6-em)]](https://www.rsc.org/images/entities/char_2009.gif) :
:![[thin space (1/6-em)]](https://www.rsc.org/images/entities/char_2009.gif) 1) solution, 2 h) was performed according to a previously described method.25 For the TERS experiments, a self-assembled monolayer of thiophenol was prepared by immersing the gold nanoplate substrate for 18 h in a 5 × 10⁻³ M ethanolic solution of thiophenol. Gold nanoparticles for SERS were synthesized and immobilized on glass slides according to ref. 26 and 27. 2 μL of 5 × 10⁻³ M ethanolic thiophenol solution was dropped on the substrate and dried before the measurement.
1) solution, 2 h) was performed according to a previously described method.25 For the TERS experiments, a self-assembled monolayer of thiophenol was prepared by immersing the gold nanoplate substrate for 18 h in a 5 × 10⁻³ M ethanolic solution of thiophenol. Gold nanoparticles for SERS were synthesized and immobilized on glass slides according to ref. 26 and 27. 2 μL of 5 × 10⁻³ M ethanolic thiophenol solution was dropped on the substrate and dried before the measurement.
It is commonly known that thiophenol covalently binds via sulfur to gold surfaces, i.e. to nanoparticles in SERS and to nanoplates in TERS. Specifically in the latter case this was a crucial step to avoid undesired binding of the molecule to the Ag tip. This would cause a band shift as can be seen in experiments when SERS on Ag islands is compared to TERS. In our case such shifts were never observed, hence the Au-S bonds are stable under our conditions.
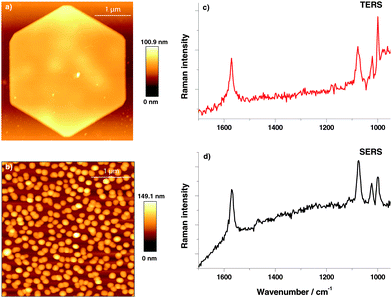
A topographic AFM image of the gold nanoplate used to assemble the thiophenol monolayer is shown in Fig. 1(a), a corresponding SERS substrate is shown in Fig. 1(b). For position and time dependent experiments 200 TERS and SERS spectra were recorded using 532 nm laser excitation and 10 s acquisition time. Typical TERS and SERS spectra are shown in Fig. 1(c) for TERS and (d) for SERS, respectively. The three thiophenol marker bands in SERS at 999 cm−1 (ring breathing mode), 1075 cm−1 (C–C in-plane bending) and 1569 cm−1 (C–C stretching) are clearly visible in all spectra. The C–C in plane bending mode at 1075 cm−1 having a1-type symmetry is known to show a peak position shift on different substrates28 and therefore was excluded from analysis. Each peak was fitted with a Lorentzian function (Igor PRO 6.22A, Wavemetrics, USA) to provide information on the band position and FWHM.
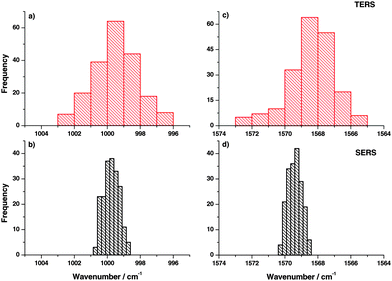
TERS spectra were recorded at different locations (distance 10 nm between positions) on the gold nanoplates. Similarly, SERS spectra were also recorded at different positions on the gold nanoparticle substrate. Here the distance between locations was 150 nm. The band position variation for the two selected modes in TERS is shown in the histograms in Fig. 2(a) and (c). A relatively large band position fluctuation of about 6–9 cm−1 can be observed. The same bands in the SERS spectra show only a small peak position fluctuation of about 2 cm−1. Comparing the band position variation of the present TERS data with SM-SERS spectra by Nie and Emory13 a similar fluctuation can be found. Actually, the current TERS measurement cannot be considered as the SM experiment, but the observed band position fluctuation already points to a very small number of molecules in the interaction region of the TERS tip. As a monolayer was probed this was an unexpected behavior. To explain this SM-like fluctuation in TERS spectra, two possible mechanisms are proposed:
(1) The electromagnetic enhancement of a tip with a radius of 10 nm is supposed to excite at least hundreds of molecules from the thiophenol monolayer. Thus, a SM-like behavior can be explained if all those molecules under investigation have the same orientation and neighborhood. As the tip moves to the next position it interacts with a different set of molecules, where again the molecules have the same orientation relative to one another, however it differs from the previous location of the TERS probe.
(2) A “single-molecule like” vibrational spectrum under TERS conditions can be expected if an additional chemical enhancement is taken into account. This can lead to a much higher spatial resolution since an interaction between the apex of the tip to the surface can only occur to a few if not only a single molecule being in direct neighborhood to the tip.7 Such an effect could also lead to the observed variation in the peak position.
It is already known that the thiophenol monolayer on a gold surface forms ordered domains of about 15 nm diameter.29–31 Reorientation of the molecules will cause a different response to the polarization of the exciting light.32
In a SERS measurement the orientation effect is averaged over many nanoparticles in the laser focus contributing to the overall signal. Hence, no fluctuation in the peak position was expected as experimentally observed and shown in Fig. 2(b) and (d).
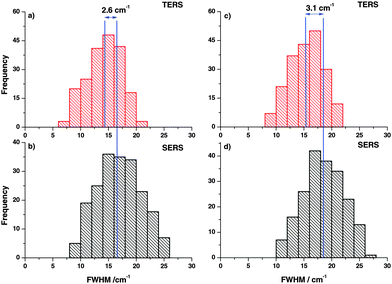
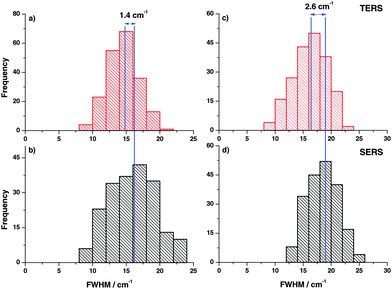
In the next step, FWHM of the Raman bands in the respective experiments was analyzed in the same way. The FWHM was determined for every TERS and SERS spectrum and plotted in histograms as shown in Fig. 3. The vertical lines drawn in the histograms correspond to the average FWHM values. The comparison clearly illustrates that the average FWHM in TERS spectra is smaller than in the SERS spectra. In general, the FWHM of a Raman band is determined by several factors. If instrumental influences like slit width are neglected, the line width of a spectral band for gases and liquids is mostly influenced by vibrational relaxation and dephasing. Already for liquid mixtures the effect of the microscopic environment must be considered and the actual observed line width is a superposition of all possible microenvironments weighted to their respective probabilities.33–35 As vibrational relaxation and dephasing usually take place in a range of up to hundreds of picoseconds and the mechanisms should be similar in TERS and SERS.36 Thus, the main effect that leads to the observed changes can be attributed to the different roles of the micro-environments. In the SERS experiments more than ten nanoparticles and around 106 molecules (assuming a laser spot size of 500 nm) contribute to the overall line width, while in a TERS experiment only one nanoparticle and at most only a few hundred molecules contribute to the overall line width. These observations are supported by the observation of concentration dependent line width variations in Raman band studies by different groups,37,38 which is in line with our experiments as well.
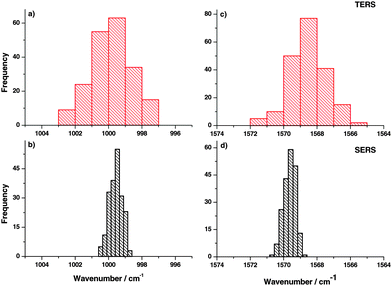
In order to further support this hypothesis, measurements on a single location were done and the time dependent behavior of TERS and SERS spectra was studied. Hence, the sample position was fixed with respect to tip and laser focus and spectra were collected consecutively. The histograms of peak position variation of different bands in TERS experiments are shown in Fig. 4(a) and (c). The corresponding SERS results are shown in Fig. 4(b) and (d). Comparing peak position variations in time traces and the position dependent TERS measurements, similar variations were observed. Again this indicates that the observed area under a TERS tip is very small, otherwise a thermal drift (if any) would not change the peak position notably. Small changes in the monolayer position with respect to the tip are expected due to diffusion.39 No correlation was observed in peak position variation in consecutive TERS time traces, which indicates that the dominant mechanism for large peak position variation is likely a chemical interaction between the tip and the sample that detects even small conformational changes of the probed molecule.
In addition, the FWHM variation in the time trace (Fig. 5) clearly demonstrates that the average FWHM in the SERS experiment is larger compared to TERS, indicating that more molecules are involved in SERS measurements yielding a larger FWHM. The difference in average FWHM varies from peak to peak, which indicates nonlinear coupling of modes from different molecules.
Different substrates (Au, Ag, etc.)28,40 can also potentially influence the results. To check this effect we additionally performed SERS on silver island films by adding 2 μL of 5 × 10⁻³ M ethanolic thiophenol solution and drying it before the measurement. SERS spectra are recorded using 75 μW power of 532 nm laser excitation with 1s acquisition time. A comparison of the 40 spatially dependent SERS and TERS spectra is shown in Fig. 6. Fig. 6(a) shows the AFM topography of silver island film.41,42 On the silver island film more than hundred nanoparticles with around 107 molecules contribute to the SERS signal. Fig. 6(b) and (d) and Fig. 6(c) and (e) give histograms of the peak position variation of the selected bands in TERS and corresponding SERS spectra on silver island film in position dependent measurements. An absolute band shift was observed, which was different for each marker band. The absolute band shift between TERS and SERS is caused by (1) a slightly different binding of thiophenol to the substrate (Au or Ag) and (2) tip-sample nanogap. The relative peak position variations are still comparable with the SERS experiment on Au nanoparticles. In Fig. 6(f) and (h) and Fig. 6(g) and (i) histograms of position dependent FWHM variations in TERS and corresponding SERS spectra on the silver island film are plotted showing higher FWHM in SERS compared to TERS. Again, nonlinear coupling of modes leads to asymmetric FWHM variation of the selected bands.
Conclusions
We have demonstrated the large peak position fluctuations in the TERS study (6–9 cm−1) of the thiophenol monolayer, which indicate a single molecule like behavior and two possible mechanisms for such behavior were suggested. No correlation in peak position variation of consecutive TERS spectra in time dependent measurement was observed. Thus, the dominant mechanism for fluctuations in the peak position is the direct chemical interaction between the tip and the sample. TERS probes the small conformational molecular changes on such a small scale that the normally observed averaging is absent.Bands in the TERS spectra of thiophenol exhibit a narrower line-width than the SERS spectra. These observations can also be related to the apparently smaller number of molecules excited in TERS compared to SERS experiments. While in TERS only molecules in closest vicinity to the single nanoparticle at the tip apex experience a signal enhancement, in SERS many hot spots and all the molecules in their vicinity contribute to the over-all signal. Additionally, differences in average values of FWHM in SERS and TERS spectra vary from peak to peak and can be explained by the nonlinear coupling of modes between different molecules which could be influenced by metal nanoparticles under investigation.
Both the peak position and FWHM comparisons of TERS and SERS spectra indicate that in TERS experiments a micro-ensemble of molecules is excited by the field at the tip apex in contrast to a macro-ensemble of investigated molecules in the SERS experiments. Thus, the results demonstrate that SERS databases can only be used with caution for TERS spectra assignment. In particular band position variations of 10 cm−1 and more in TERS can occur as only a few molecules are probed.
Acknowledgements
Support from the European Union and the state of Thuringia (FKZ: 2011 FE 9048; 2011 VF 0016) as well as through the Deutsche Forschungsgemeinschaft (FR 1348/19-1) is gratefully acknowledged. B.M.W. acknowledges financial support from an European Research Council (ERC) Advanced Grant (no. 321140). We would like to thank Matthias Thiele for the preparation of gold nanoparticle SERS substrates.Notes and references
- D. Cialla, T. Deckert-Gaudig, C. Budich, M. Laue, R. Möller, D. Naumann, V. Deckert and J. Popp, J. Raman Spectrosc., 2009, 40, 240–243 CrossRef CAS.
- T. Deckert-Gaudig and V. Deckert, Phys. Chem. Chem. Phys., 2010, 12, 12040–12049 RSC.
- U. Neugebauer, P. Rösch, M. Schmitt, J. Popp, C. Julien, A. Rasmussen, C. Budich and V. Deckert, ChemPhysChem, 2006, 7, 1428–1430 CrossRef CAS PubMed.
- B. Pettinger, P. Schambach, C. J. Villagömez and N. Scott, Annu. Rev. Phys. Chem., 2012, 63, 379–399 CrossRef CAS PubMed.
- C. C. Neacsu, J. Dreyer, N. Behr and M. B. Raschke, Phys. Rev. B: Condens. Matter Mater. Phys., 2006, 73, 193406 CrossRef.
- M. D. Sonntag, J. M. Klingsporn, L. K. Garibay, J. M. Roberts, J. A. Dieringer, T. Seideman, K. A. Scheidt, L. Jensen, G. C. Schatz and R. P. Van Duyne, J. Phys. Chem. C, 2012, 116, 478–483 CAS.
- R. Zhang, Y. Zhang, Z. C. Dong, S. Jiang, C. Zhang, L. G. Chen, L. Zhang, Y. Liou, J. Aizpurua, Y. Luo, J. L. Yang and J. G. Hou, Nature, 2013, 498, 82–86 CrossRef CAS PubMed.
- W. H. Zhang, B. S. Yeo, T. Schmid and R. Zenobi, J. Phys. Chem. C, 2007, 111, 1733–1738 CAS.
- T. Yano, P. Verma, Y. Saito, T. Ichimura and S. Kawata, Nat. Photonics, 2009, 3, 473–477 CrossRef CAS.
- B. R. Wood, M. Asghari-Khiavi, E. Bailo, D. McNaughton and V. Deckert, Nano Lett., 2012, 12, 1555–1560 CrossRef CAS PubMed.
- M. Richter, M. Hedegaard, T. Deckert-Gaudig, P. Lampen and V. Deckert, Small, 2011, 7, 209–214 CrossRef CAS PubMed.
- E. M. van Schrojenstein Lantman, T. Deckert-Gaudig, A. J. G. Mank, V. Deckert and B. M. Weckhuysen, Nat. Nanotechnol., 2012, 7, 583–586 CrossRef CAS PubMed.
- S. Nie and S. R. Emory, Science, 1997, 275, 1102–1106 CrossRef CAS PubMed.
- J. A. Dieringer, K. L. Wustholz, D. J. Masiello, J. P. Camden, S. L. Kleinman, G. C. Schatz and R. P. Van Duyne, J. Am. Chem. Soc., 2009, 131, 849–854 CrossRef CAS PubMed.
- K. Kneipp, Y. Wang, H. Kneipp, L. T. Perelman, I. Itzkan, R. R. Dasari and M. S. Feld, Phys. Rev. Lett., 1997, 78, 1667–1670 CrossRef CAS.
- H. Liu, L. Zhang, X. Lang, Y. Yamaguchi, H. Iwasaki, Y. Inouye, Q. Xue and M. Chen, Sci. Rep., 2011, 1, 112 Search PubMed.
- P. G. Etchegoin and E. C. Le Ru, Phys. Chem. Chem. Phys., 2008, 10, 6079–6089 RSC.
- T. Vosgröne and A. J. Meixner, ChemPhysChem, 2005, 6, 154–163 CrossRef PubMed.
- T. Ichimura, H. Watanabe, Y. Morita, P. Verma, S. Kawata and Y. Inouye, J. Phys. Chem. C, 2007, 111, 9460–9464 CAS.
- A. Rasmussen and V. Deckert, J. Raman Spectrosc., 2006, 37, 311–317 CrossRef CAS.
- R. Treffer, X. M. Lin, E. Bailo, T. Deckert-Gaudig and V. Deckert, Beilstein J. Nanotechnol., 2011, 2, 628–637 CrossRef CAS PubMed.
- D. Zhang, K. F. Domke and B. Pettinger, ChemPhysChem, 2010, 10, 1662–1665 CrossRef PubMed.
- M. D. Sonntag, D. Chulhai, T. Seideman, L. Jensen and R. P. Van Duyne, J. Am. Chem. Soc., 2013, 135, 17187–17192 CrossRef CAS PubMed.
- J. M. Klingsporn, N. Jiang, E. A. Pozzi, M. D. Sonntag, D. Chulhai, T. Seideman, L. Jensen, M. C. Hersam and R. P. Van Duyne, J. Am. Chem. Soc., 2014, 136, 3881–3887 CrossRef CAS PubMed.
- T. Deckert-Gaudig and V. Deckert, Small, 2009, 5, 432–436 CrossRef CAS PubMed.
- J. Turkevich, P. C. Stevenson and J. Hillier, Discuss. Faraday Soc., 1951, 11, 55–75 RSC.
- G. Frens, Nature, 1973, 241, 20–22 CAS.
- B. Ren, G. Picardi, G. Pettinger, R. Schuster and G. Ertl, Angew. Chem., Int. Ed., 2005, 44, 139–142 CrossRef CAS PubMed.
- A. Dhirani, R. W. Zehner, R. P. Hsung, P. Guyot-Sionnest and L. R. Sita, J. Am. Chem. Soc., 1196, 118, 3319–3320 CrossRef.
- D. Käfer, A. Bashir and G. Witte, J. Phys. Chem. C, 2007, 111, 10546–10551 Search PubMed.
- L. Wan, H. Terashima, H. Noda and M. Osawa, J. Phys. Chem. B, 2000, 104, 3563–3569 CrossRef CAS.
- T. Deckert-Gaudig, E. Rauls and V. Deckert, J. Phys. Chem. C, 2010, 114, 7412–7420 CAS.
- F. Bondarev and A. I. Mardaeva, Opt. Spektrosk., 1973, 35, 286–288 Search PubMed.
- E. W. Knapp and S. F. Fischer, J. Chem. Phys., 1981, 74, 89–95 CrossRef CAS PubMed.
- E. W. Knapp and S. F. Fischer, J. Chem. Phys., 1982, 76, 4730–4735 CrossRef CAS PubMed.
- E. J. Heilweil, M. P. Casassa, R. R. Cavanagh and J. C. Stephenson, Annu. Rev. Phys. Chem., 1989, 40, 143–171 CrossRef CAS.
- S. Bratos and G. Tarjus, Phys. Rev. A: At., Mol., Opt. Phys., 1985, 32, 2431–2438 CrossRef CAS.
- A. K. Ojha, S. K. Srivastava, R. K. Singh and B. P. Asthana, J. Phys. Chem. A, 2006, 110, 9849–9853 CrossRef CAS PubMed.
- K. F. Domke, D. Zhang and B. Pettinger, J. Phys. Chem. C, 2007, 111, 8611 CAS.
- K. T. Carron and L. G. Hurley, J. Phys. Chem., 1991, 95, 9979–9984 CrossRef CAS.
- R. Stöckle, V. Deckert, C. Fokas and R. Zenobi, Appl. Spectrosc., 2000, 54, 1577–1583 CrossRef.
- R. Stöckle, V. Deckert, C. Fokas, D. Zeisel and R. Zenobi, Vib. Spectrosc., 2000, 22, 39–48 CrossRef.
| This journal is © the Owner Societies 2015 |

