 Open Access Article
Creative Commons Attribution 3.0 Unported Licence
Direct evidence for a substantive reaction between the Criegee intermediate, CH2OO, and the water vapour dimer†
Tom R.
Lewis
a,
Mark A.
Blitz
*ab,
Dwayne E.
Heard
ab and
Paul W.
Seakins
ab
aSchool of Chemistry, University of Leeds, Leeds, LS2 9JT, UK. E-mail: m.blitz@leeds.ac.uk
bNational Centre for Atmospheric Science, University of Leeds, Leeds, LS2 9JT, UK
First published on 19th January 2015
Abstract
The C1 Criegee intermediate, CH2OO, reaction with water vapour has been studied. The removal rate constant shows a quadratic dependence on [H2O], implying reaction with the water dimer, (H2O)2. The rate constant, kCH2OO+(H2O)2 = (4.0 ± 1.2) × 10−12 cm3 molecule−1 s−1, is such that this is the major atmospheric sink for CH2OO.
The Criegee intermediate is the long postulated intermediate formed in the ozonolysis of alkenes.1 Even though much effort had gone into its direct observation from ozonolysis reactions, it has only recently been directly observed at low pressures via production in the reaction:2
| CH2I + O2 → CH2OO + I | (R1a) |
| CH2I + O2(+M) → CH2IO2 | (R1b) |
Many of these new direct kinetic measurements on Criegee intermediates have determined rate constants significantly higher than older, indirect studies and their importance in atmospheric chemistry has been re-evaluated, in particular its reaction with SO2 in competition with unimolecular decomposition9 and photolysis.4,10 The importance of these latter processes remains uncertain. An intriguing result of this new work on the Criegee intermediate is its reaction with H2O:11
| CH2OO + H2O → Products (HO–CH2OOH) | (R2) |
In this communication we demonstrate that by generating the Criegee intermediate using reaction (R1) and directly following it in time via UV/Vis spectroscopy, reaction is observed with H2O vapour that is described by a quadratic dependence on [H2O]. This observation confirms reaction of the Criegee intermediate with the water dimer and that there is no significant difference in Criegee intermediate chemistry whether the intermediate is generated viareaction (R1) or by ozonolysis.
The experiments were carried out using our newly constructed multiplexing absorption kinetics spectrometer coupled to laser flash photolysis. Full details about the setup will be described in a forthcoming publication. The essential details are as follows: the output from a xenon lamp was multi-passed 14 times through the 1.5 metre reaction cell and configured such that this probe beam was overlapped for the majority of this distance with the 248 nm excimer laser that passed along the length of the reactor. This probe beam was then directed via a fibre optic into a spectrograph (Jobin Yvon CP140-103) where the wavelengths 250–850 nm were simultaneously measured using a CCD image sensor (Hamamatsu S7031, back-thinned FFT-CCD). All the wavelengths were recorded for 1 millisecond intervals for a total of 200 milliseconds and transferred to a PC via a PCI interface board. All these data were processed by the PC using a custom built LabView program before the next photolysis laser pulse; the excimer laser was fired between 1–0.2 Hz. At each wavelength (λ), the 50 points before the excimer laser pulse were averaged and assigned to I0(λ) (intensity of the probe light), and all these I0(λ) were compared to all the wavelength time points after the excimer laser fired, I(λ). The program calculated ΔI/I0 for each wavelength versus time, the time-resolved differential absorption signal for each wavelength.
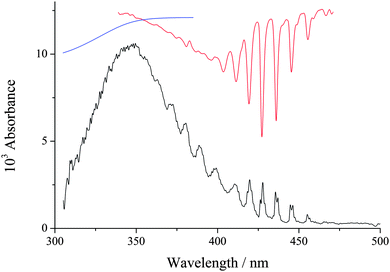
An example of a spectrum at early time after photolysis is shown in Fig. 1, where it can be seen that the spectrum between 300–400 nm is dominated by the C1 Criegee intermediate. At longer wavelengths absorption by the IO radical is also observable (CH2I2 photolysis produces a small amount of CH2, which reacts with O2 to produce O(3P)18 which in turn reacts with the precursor to produce IO19). The IO is removed from the system much more slowly than CH2OO. H2O vapour was added to the system by passing the main gas, N2 (BOC, OFN), through a bubbler filled with deionized water, where the pressure in the bubbler was measured and could be varied over range 1000–2000 Torr. [O2] (∼2 × 10¹⁷ molecule cm−3) was high enough to ensure R1 was rapid and the total pressure was varied between 50–400 Torr, where N2 was the main buffer gas. At each pressure the kinetics of the system were recorded without H2O vapour and then the N2 flow was switched to the H2O bubbler, where the pressure can be adjusted. These experiments were carried out at 294 K.
The features of the spectrum in Fig. 1, especially between 350–420 nm, are consistent with the absorption literature spectrum of CH2OO.20,21 However, the present experiment records the differential absorption spectrum, ΔI/I0, and it needs to be corrected for CH2I2 photolysis and IO before it can quantitatively be used to compare to the literature. Also, the spectrum is Fig. 1 has been corrected for scattered photons (>850 nm) hitting the CCD camera, see ESI† for further details. Hence this work cannot be compared with absolute cross-sections from any previous study at present. It is at 350 nm where the cross-section value reported by Ting et al.22 is ca. a factor of three times lower than the values reported by Beames et al.4 and Sheps.21 In our previous study, using a completely different absorption setup on CH2I2 photolysis in the presence of O2 at atmospheric pressure, we mis-assigned the Criegee intermediate spectrum as the CH2IOO from reaction (R1b).23 If we now re-assign this spectrum as CH2OO and divide the cross-sections by 0.18, which our recent measurements have determined as the yield of Criegee intermediate at atmospheric pressure,3 the spectrum is 40% lower at 350 nm than the cross-section value of Ting et al.22
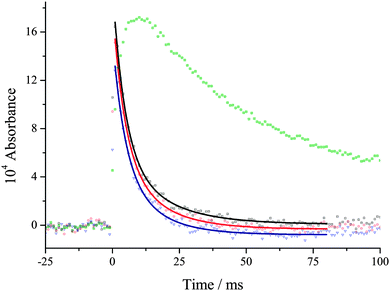
If the reaction of CH2OO with water is slow, then self-reaction6 should dominate CH2OO decay. The CH2OO kinetic traces were analysed using an expression for second-order loss and it was observed that they were always better described by first-order kinetics, even for the traces at the lowest total pressure, see Fig. 2 for example. At this stage it is not clear what is causing the unexpected first order kinetics; a possible explanation is unimolecular decay:7,9
| CH2OO → products | (R3) |
It should be emphasised that experiments were always carried out in the absence of water vapour and then in the presence of water vapour, and therefore the difference between the pseudo-first-order decays can be attributed to the presence of water. The reaction with H2O vapour is slow but it will be pseudo-first-order, and reaction of the Criegee intermediate with water vapour is only significant at the higher total pressures, where more water vapour can be added. Therefore it is reasonable to describe the Criegee intermediate loss as a first-order process:
[CH2OO] = [CH2OO]0![[thin space (1/6-em)]](https://www.rsc.org/images/entities/char_2009.gif) exp(−kobst) exp(−kobst) | (E1) |
The early-time spectrum in Fig. 1 shows that both CH2OO and IO are present and from Fig. 2 it can be seen that the CH2OO is removed much faster than IO under all conditions, especially at high water vapour concentrations. The data were analysed at five different wavelengths, 353, 350, 346, 344 and 341 nm, using the equation:
[CH2OO] = [CH2OO]0![[thin space (1/6-em)]](https://www.rsc.org/images/entities/char_2009.gif) exp(−kobst) + [B]0 exp(−kobst) + [B]0![[thin space (1/6-em)]](https://www.rsc.org/images/entities/char_2009.gif) exp(−kbt) + C exp(−kbt) + C | (E2) |
![[thin space (1/6-em)]](https://www.rsc.org/images/entities/char_2009.gif) exp(−kbt) takes into account the small but significant contribution to the absorption from IO, kb is the rate constant for IO loss, and C takes into account CH2I2 photolysis, which is significant up to 400 nm. In this analysis all the data at the five wavelengths were fitted simultaneously using eqn (E2), where kobs was treated as a global parameter and all the other parameters were local. At each total pressure the kobs was determined in the presence, k2′ + k3, and absence of H2O, k3. Therefore subtracting kobs with and without H2O gives k2′. As can be seen in Fig. 2, the fits to the data were good and kobs was defined with errors always less than 10%. The validity of using eqn (E2) is that kobs and not kb is significantly changing as [H2O] is added to the system, and therefore kobsvs. [H2O] is a good measure of reaction (R2).
exp(−kbt) takes into account the small but significant contribution to the absorption from IO, kb is the rate constant for IO loss, and C takes into account CH2I2 photolysis, which is significant up to 400 nm. In this analysis all the data at the five wavelengths were fitted simultaneously using eqn (E2), where kobs was treated as a global parameter and all the other parameters were local. At each total pressure the kobs was determined in the presence, k2′ + k3, and absence of H2O, k3. Therefore subtracting kobs with and without H2O gives k2′. As can be seen in Fig. 2, the fits to the data were good and kobs was defined with errors always less than 10%. The validity of using eqn (E2) is that kobs and not kb is significantly changing as [H2O] is added to the system, and therefore kobsvs. [H2O] is a good measure of reaction (R2).
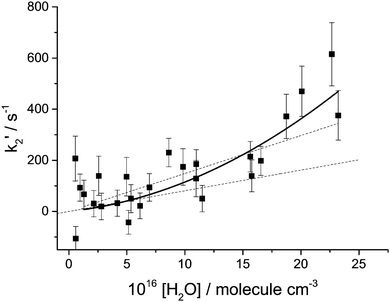
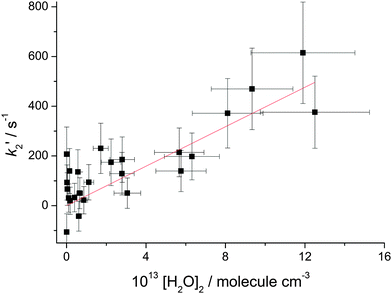
In Fig. 3k2′ is plotted versus the H2O vapour concentration, and from this figure it is clear that at the highest concentrations the Criegee intermediate is reacting with water. However, closer inspection of this plot indicates that its dependence on H2O concentration is better described by a quadratic rather than a linear dependence. The data are better described by a quadratic function based on the value of χ2. Also shown in Fig. 3 are linear least squares fits to the data over the full range and [H2O] < 7.5 × 10¹⁶ molecule cm−3, 13 points, where it can be observed that there is a factor is two increase in the slope. These observations, together with visual inspection, highlight the curvature in the data. This observation is in agreement with the recent paper by Berndt et al.16 where, from ozonolysis of ethylene, the removal of the Criegee intermediate (versus reaction with SO2) was shown to have a quadratic dependence on [H2O]. In Fig. 4, k2′ is plotted versus [(H2O)2] and it can be seen that the data are now better described by a linear relationship; good evidence that the Criegee intermediate is reacting predominantly with the dimer. The [(H2O)2] was calculated using the parameterisation of Scribano et al.,25 which is the same calculation as used by Berndt et al.16 Therefore the results from this study can be directly compared to Berndt et al. even though there is an estimated 20% error in the water dimer concentration.
The slope of Fig. 4 is equal to the rate constant for the bimolecular reaction:26
| CH2OO + (H2O)2 → HO–CH2OOH + H2O | (R4) |
The value reported by Berndt et al. was k4 = 1.01 ± 0.03 × 10⁻¹¹ cm3 molecule−1 s−1, which is about a factor of two larger than our present value. So while both studies are in broad agreement in that reaction (R4) is operating, there is a significant discrepancy in the magnitude of the rate constant. In the present work, the rate constant k4 is extracted from the change in kobs on addition of water vapour, where k2′/k3 < 10 and hence leads to larger than usual error in the bimolecular rate constant, see Fig. 4, but not as high as a factor of two. [H2O] was determined from measuring the temperature and pressure of the bubbler and it was assumed that the entire H2O equilibrium vapour pressure was delivered to the reactor. This is normally a reliable method to estimate the concentration of species introduced via a bubbler; previous work using a bubbler to deliver amines to a kinetic experiment has shown good agreement between calculated concentrations and values measured directly in the cell via UV absorption.27 However, it is acknowledged that there is a potential to overestimate the water vapour concentration. Alternatively, there may be another reason for this discrepancy. The experiments from Berndt et al.16 used an atmospheric pressure time-of-flight mass spectrometer, where gas was sampled via a small aperture into the low pressure environment of the mass spectrometer. This gas expansion promotes cooling, which promotes dimer formation, and if dimer formation is promoted more rapidly than the reduction in pressure, then Criegee intermediate loss inside the mass spectrometer increases. While this is speculative, there are examples of promoted chemistry inside this type of mass spectrometer.28 At the moment the source of this difference in the rate constant is unclear but it is clear that the Criegee intermediate generated viareaction (R1) or via ozonolysis produces essentially the same chemistry, i.e. there is no non-thermal kinetics.
This brings into question the failure of previous studies to observe any reaction of CH2OO with H2O vapour. In the experiments by Welz et al.2 the Criegee intermediate was directly monitored and the highest amount of [H2O] added was 3 × 10¹⁶ molecule cm−3 (corresponding to 2 × 10¹² molecule cm−3 dimer). This amount of [H2O] increases the rate constant by no more than 20 s−1, which in the experiments of Welz et al. is too small to observe. In the experiments by Stone et al.12 CH2O was used to follow the Criegee kinetics in time and up to [H2O] = 1.7 × 10¹⁷ molecule cm−3 (corresponding to 6 × 10¹³ molecule cm−3 dimer) was added to the system. The calculated increase in the Criegee intermediate removal rate constant is between 250–600 s−1 and should be measurable. However, this method relies on CH2O only coming from characterised CH2OO and CH2IO2 chemistry. If the products of reaction (R4) bring about new chemistry that forms CH2O then it could mask any reaction with H2O vapour. This new chemistry would be from radical–radical reactions. Therefore in the experiments of Stone et al.12 where the radical densities are a few 1012 molecule cm−3 CH2O could be formed on a timescale not incompatible with this possible explanation. In the experiments of Ouyang et al.13 Criegee intermediate kinetics with H2O were determined in competition with NO2 by following the NO3 formed from CH2OO + NO2. In these experiments up to 6 × 10¹⁷ molecule cm−3 of H2O (corresponding to 8 × 10¹⁴ molecule cm−3 dimer) was added to the system, therefore the Criegee intermediate removal rate constant should have been >3000 s−1, but no removal was observed. However, this method is dependent on Criegee intermediate + NO2 reacting to make NO3. The experiments by Ouyang et al.13 were not time-resolved; the contents of the reactor flowed into a cavity spectrometer and therefore it is possible that other secondary chemistry was responsible for NO3 production. In a forthcoming paper it will be demonstrated using the current flash photolysis/UV/Vis absorption setup that NO3 is not significantly made by reaction of Criegee with NO2, and the small amount of observed NO3 is consistent with the iodine chemistry, INO2 + IONO2 → NO3 + NO2 + I2. Therefore the lack of change in the NO3 signal versus added H2O indicates a lack of reactivity in iodine chemistry and not Criegee intermediate chemistry.
Conclusions
The Criegee intermediate, CH2OO, has been observed to react in the presence of water vapour. This is the first direct measurement to show that this reaction is occurring and its kinetics implies that the reaction is predominantly with the water dimer, (H2O)2, where k4 = (4.2 ± 1.2) × 10−12 cm3 molecule−1 s−1. This result is in support of the recent indirect measurements by Berndt et al.16 and indicates that Criegee intermediate chemistry is essentially independent of the method of generation via either ozonolysis or iodo-alkyl radical + O2. The observed loss contrasts with other previous studies, but we believe the discrepancies can be explained by either the use of relatively low concentrations of water (limiting dimer formation) or via secondary chemistry in more indirect studies monitoring products. The direct observation of Criegee intermediates as used in this study will be less susceptible to such systematic errors.Using the representative range in (H2O)2 concentrations (molecule cm−3) reported by Vereecken et al.,29 8.5 × 10¹³ (mega city) to 5.5 × 10¹⁴ (tropical forest), results in first-order loss rate for C1 Criegee intermediate ranging from 357–2310 s−1. This is significantly greater than first order loss rates with other trace gases. In the atmospheric implications from Vereecken et al.29reaction (R4) was included, using a theoretical estimate of the rate constant, and it was concluded that water vapour was the dominant removal process. This assessment provides a better representation of Criegee chemistry compared to modelling studies that have not included reaction (R4).30 Given the importance of Criegee intermediates, further studies of the reaction with water dimer are required to confirm the fast kinetics reported in this work and to identify the products of the reaction.
Acknowledgements
TRL is grateful to NERC for studentship funding. We acknowledge funding from NERC (NE/K005820/1) and EPSRC (EP/J10871/1).References
- R. Criegee, A. Kerckow and H. Zinke, Chem. Ber., 1955, 88, 1878–1888 CrossRef CAS.
- O. Welz, J. D. Savee, D. L. Osborn, S. S. Vasu, C. J. Percival, D. E. Shallcross and C. A. Taatjes, Science, 2012, 335, 204–207 CrossRef CAS PubMed.
- D. Stone, M. Blitz, L. Daubney, T. Ingham and P. Seakins, Phys. Chem. Chem. Phys., 2013, 15, 19119–19124 RSC.
- J. M. Beames, F. Liu, L. Lu and M. I. Lester, J. Am. Chem. Soc., 2012, 134, 20045–20048 CrossRef CAS PubMed.
- C. A. Taatjes, O. Welz, A. J. Eskola, J. D. Savee, D. L. Osborn, E. P. F. Lee, J. M. Dyke, D. W. K. Mok, D. E. Shallcross and C. J. Percival, Phys. Chem. Chem. Phys., 2012, 14, 10391–10400 RSC.
- Z. J. Buras, R. M. I. Elsamra and W. H. Green, J. Phys. Chem. Lett., 2014, 5, 2224–2228 CrossRef CAS.
- Y. Liu, K. D. Bayes and S. P. Sander, J. Phys. Chem. A, 2014, 118, 741–747 CrossRef CAS PubMed.
- C. A. Taatjes, D. E. Shallcross and C. J. Percival, Phys. Chem. Chem. Phys., 2014, 16, 1704–1718 RSC.
- A. Novelli, L. Vereecken, J. Lelieveld and H. Harder, Phys. Chem. Chem. Phys., 2014, 16, 19941–19951 RSC.
- F. Liu, J. M. Beames, A. S. Petit, A. B. McCoy and M. I. Lester, Science, 2014, 345, 1596–1598 CrossRef CAS PubMed.
- A. B. Ryzhkov and P. A. Ariya, Chem. Phys. Lett., 2006, 419, 479–485 CrossRef CAS PubMed.
- D. Stone, M. Blitz, L. Daubney, N. U. M. Howes and P. Seakins, Phys. Chem. Chem. Phys., 2014, 16, 1139–1149 RSC.
- B. Ouyang, M. W. McLeod, R. L. Jones and W. J. Bloss, Phys. Chem. Chem. Phys., 2013, 15, 17070–17075 RSC.
- M. Suto, E. R. Manzanares and L. C. Lee, Environ. Sci. Technol., 1985, 19, 815–820 CrossRef CAS PubMed.
- K. H. Becker, J. Bechara and K. J. Brockmann, Atmos. Environ., Part A, 1993, 27, 57–61 CrossRef.
- T. Berndt, J. Voigtlaender, F. Stratmann, H. Junninen, R. L. Mauldin, III, M. Sipilae, M. Kulmala and H. Herrmann, Phys. Chem. Chem. Phys., 2014, 16, 19130–19136 RSC.
- D. R. Glowacki, J. Lockhart, M. A. Blitz, S. J. Klippenstein, M. J. Pilling, S. H. Robertson and P. W. Seakins, Science, 2012, 337, 1066–1069 CrossRef CAS PubMed.
- M. A. Blitz, C. Kappler, M. J. Pilling and P. W. Seakins, Z. Phys. Chem., 2011, 225, 957–967 CrossRef CAS.
- T. J. Dillon, M. E. Tucceri, R. Sander and J. N. Crowley, Phys. Chem. Chem. Phys., 2008, 10, 1540–1554 RSC.
- W.-L. Ting, C.-H. Chang, Y.-F. Lee, H. Matsui, Y.-P. Lee and J. J.-M. Lin, J. Chem. Phys., 2014, 141, 104308 CrossRef PubMed.
- L. Sheps, J. Phys. Chem. Lett., 2013, 4, 4201–4205 CrossRef CAS.
- W.-L. Ting, Y.-H. Chen, W. Chao, M. C. Smith and J. J.-M. Lin, Phys. Chem. Chem. Phys., 2014, 16, 10438–10443 RSC.
- T. J. Gravestock, M. A. Blitz, W. J. Bloss and D. E. Heard, ChemPhysChem, 2010, 11, 3928–3941 CrossRef CAS PubMed.
- Y.-T. Su, H.-Y. Lin, R. Putikam, H. Matsui, M. C. Lin and Y.-P. Lee, Nat. Chem., 2014, 6, 477–483 CrossRef CAS PubMed.
- Y. Scribano, N. Goldman, R. J. Saykally and C. Leforestier, J. Phys. Chem. A, 2006, 110, 5411–5419 CrossRef CAS PubMed.
- A. B. Ryzhkov and P. A. Ariya, Phys. Chem. Chem. Phys., 2004, 6, 5042–5050 RSC.
- L. Onel, M. Dryden, M. A. Blitz and P. W. Seakins, Environ. Sci. Technol. Lett., 2014, 1, 367–371 CrossRef CAS.
- M. Ehn, J. A. Thornton, E. Kleist, M. Sipilae, H. Junninen, I. Pullinen, M. Springer, F. Rubach, R. Tillmann, B. Lee, F. Lopez-Hilfiker, S. Andres, I.-H. Acir, M. Rissanen, T. Jokinen, S. Schobesberger, J. Kangasluoma, J. Kontkanen, T. Nieminen, T. Kurten, L. B. Nielsen, S. Jorgensen, H. G. Kjaergaard, M. Canagaratna, M. Dal Maso, T. Berndt, T. Petaejae, A. Wahner, V.-M. Kerminen, M. Kulmala, D. R. Worsnop, J. Wildt and T. F. Mentel, Nature, 2014, 506, 476–479 CrossRef CAS PubMed.
- L. Vereecken, H. Harder and A. Novelli, Phys. Chem. Chem. Phys., 2012, 14, 14682–14695 RSC.
- O. Welz, A. J. Eskola, L. Sheps, B. Rotavera, J. D. Savee, A. M. Scheer, D. L. Osborn, D. Lowe, A. Murray Booth, P. Xiao, M. Anwar, H. Khan, C. J. Percival, D. E. Shallcross and C. A. Taatjes, Angew. Chem., Int. Ed., 2014, 53, 4547–4550 CrossRef CAS PubMed.
Footnote |
| † Electronic supplementary information (ESI) available. See DOI: 10.1039/c4cp04750h |
| This journal is © the Owner Societies 2015 |


