 Open Access Article
Creative Commons Attribution 3.0 Unported Licence
Non-invasive and continuous monitoring of the sol–gel phase transition of supramolecular gels using a fast (open-ended coaxial) microwave sensor†
Adela I.
Carrillo‡
a,
Jürgen
Bachl‡
a,
Judith
Mayr
a,
Pedro J.
Plaza-González
b,
José M.
Cátala-Civera
*b and
David
Díaz Díaz
*ac
aUniversität Regensburg, Fakultät für Chemie und Pharmazie, Institut für Organische Chemie, Universitätsstr. 31 D-93053, Regensburg, Germany. E-mail: David.Diaz@chemie.uni-regensburg.de
bInstituto de Aplicaciones de las Tecnologías de la Información y de las Comunicaciones Avanzadas (ITACA), Universitat Politècnica de València, Camino de Vera s/n, Valencia 46022, Spain
cIQAC-CSIC, Jordi Girona 18-26, Barcelona 08034, Spain
First published on 23rd January 2015
Abstract
An open coaxial re-entrant microwave sensor has been used for the non-invasive and continuous monitoring of the sol–gel transition of physical gels characterized by different gelation mechanisms, solvents, compositions, and stabilities. Comparison of measurements by differential scanning calorimetry allowed the identification of the phase transition by a change in the dielectric properties of the material over time.
Self-assembled viscoelastic gels of organic solvents (organogels), water (hydrogels) or water–organic solvent mixtures (aqueous gels) have been recognized as promising materials for bottom-up nanofabrication tools in various fields including biomedicine, sensors, cosmetics, food, catalysis, and environmental remediation.1–3 As soft materials, gels are continuous in structure and solid-like in rheological behavior. In contrast to chemical gels,4,5 which are based on covalent bonds (usually cross-linked polymers unable to redissolve), physical (also called supramolecular) gels6,7 are made of either low-molecular-weight (LMW) compounds or polymers – so called gelators – through extensive non-covalent interactions, predominantly hydrogen-bonding, van der Waals, dipole–dipole, charge-transfer, donor–acceptor, π–π stacking and metal-coordination interactions. Furthermore, systems based on both types of connections are also known.8,9 The solid-like appearance of these gels is the result of the entrapment of the liquid (major component) in the interstices of a solid 3D matrix of large surface area (minor component), usually through surface tension and capillary forces.1,2 Remarkably, many gels can immobilize up to 105 solvent molecules per molecule of gelator and increase the viscosity of the medium by a factor of 1010.
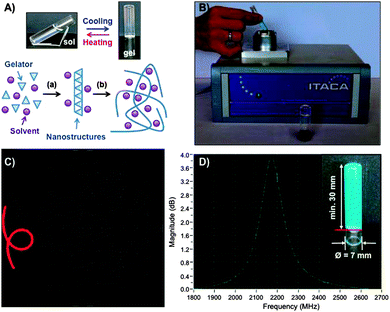
In the case of LMW gelators, the formation of the viscoelastic matrix is a consequence of the entanglement of 1D supramolecular fibers (typically of micrometer scale lengths and nanometer scale diameters), which is usually induced by cooling their hot isotropic solutions to room temperature (RT) (Fig. 1A). However, it should be noted that gelation of liquids at RT10,11 or induced by ultrasound treatment12 instead of heating–cooling has also been described. Due to the weakness of the non-covalent interactions that maintain the dynamic supramolecular structure, physical gels are usually thermoreversible. Moreover, the sol–gel (and/or gel–sol) phase transition could also be triggered by other stimuli such as pH, light irradiation or ionic strength if the gelator molecule possesses appropriate structural moieties for recognition.13,14 It is also important to recognize that the metastable nature of physical gels derives from an elusive equilibrium between dissolution and crystallization, which has stimulated numerous studies and applications in the field of crystal engineering during the last few years.15,16
Due to the brittleness of these materials, it is usually easier to monitor the gel–sol transition rather than the sol–gel for the construction of phase diagrams according to both the gel–sol transition temperature (TGS) and the sol–gel transition temperature (TSG). Among different techniques, rheology, NMR spectroscopy and conventional differential scanning calorimetry (DSC) are the most common and accurate methods used so far for this kind of study, albeit they normally suffer from the disadvantages of being relatively time consuming and requiring the use of very expensive equipments and trained personnel. Techniques of higher specificity such as ESR, NIR and fluorescence spectroscopy have also been used to characterize the sol–gel transitions of colloids.17 On the other hand, dielectric measurements have also been used to determine sol–gel transitions, usually below a few kHz.18,19 At these frequencies the dielectric properties are normally related to the conductive nature of the material and this quantity becomes (less) sensitive to chemical changes that occur at gelation.20 Dielectric measurements at microwave frequencies, however, are very sensitive to the mobility of molecules in the gel (especially when some water dipoles are involved). Therefore, the use of the mobility of the molecular structure through dielectric properties provides a direct (and in situ) measurement of the chemical and physical state of the matter.20,21 Changes in dielectric parameters can be related to critical points in different material processes, such as cure reaction onset, gelation, end-of-cure, build-up of the glass-transition temperature, etc.21,22 For example, a microwave system designed for adhesive cure monitoring has been previously described by some of us23 where in situ dielectric measurements correlate very well with conventional measurement techniques such as DSC, combining accuracy and rate with simplicity and an affordable cost.
This communication presents a microwave non-destructive system for monitoring the sol–gel transition process of supramolecular gels (Fig. 1A). A microwave sensor adapted to a standard pyrex vial containing the precursor isotropic solution allows in situ measurements of dielectric properties in order to distinguish the changes over time and temperature.
Fig. 1B shows a picture of the portable microwave device used to conduct the dielectric measurements. The system comprises a microwave sensor, a microwave transmitter and receiver (from 1.5 to 2.5 GHz) and a control unit to provide real-time information about the gelation progress without interfering with the reaction. The precursor isotropic solution is introduced in a pyrex vial and placed inside an open coaxial re-entrant (microwave) cavity sensor.24,25 When the low-intensity electromagnetic waves penetrate into the material, its molecules tend to orient with the (applied) external field and the material gains certain polarization, reflecting the back part of the microwave signal from the sensor. This reflected signal is measured continuously to determine the resonance frequency and quality factor of the sensor23 during gelation to monitor the transition process. Fig. 1C and D show a typical response of the reflected signal in the microwave cavity sensor in the imaginary plane (Smith chart) or in magnitude representation of a gelation experiment at a given temperature. We have reported elsewhere the fundamental details of the microwave system with a different sensor head.23
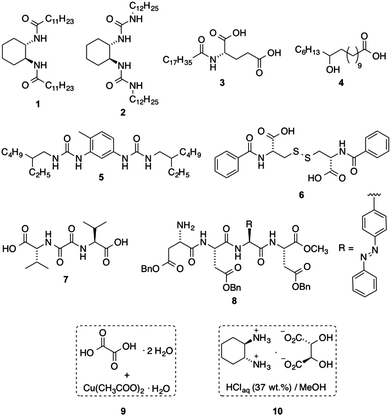
Fig. 2 shows the library of known gelators that we prepared (ESI†) to test the ability of the microwave sensor to monitor the sol–gel transition of physical gels. The library included single LMW gelators (1–8) as well as bicomponent (9)26 and multicomponent gelator systems (10).15 A number of gels with different solvents and compositions could be easily obtained from this library at well-defined concentrations. Moreover, N,N′-dibenzoyl-L-cystine (6) was included in this study for the preparation of aqueous gels.27 Azobenzene-containing peptide 8 was selected because its phase transition can be triggered either thermally or photochemically.28 Besides the classical heating–cooling treatment needed for the formation of thermoreversible physical gels made from solid compounds 1–8, gelator systems 9 and 10 enable sol–gel phase transitions at RT and well below RT, respectively. In the case of 9, DMF stock solutions of oxalic acid dihydrate and copper(II) acetate monohydrate were mixed at RT to form the corresponding organogel. Multicomponent solution 10 constitutes a special system used to form organogels at low temperatures upon addition of a small amount of this solution to a suitable organic solvent (ESI†). In contrast to the gels obtained from 1–8, those derived from 9–10 are not thermoreversible despite the non-covalent interactions involved in the gelation process. Moreover, gels made from 10 eventually undergo subsequent transition to a thermodynamically most stable crystallization phase.15 This collection of gelators offered a versatile scenario for the proof-of-concept of the detection of the sol–gel transition in physical gels by continuously monitoring the dielectric properties of the materials.
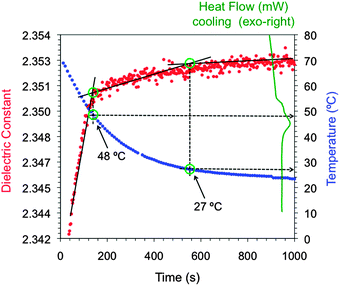
The isotropic solutions of the gelators were prepared as previously reported (ESI†). Preliminary experiments with solutions prepared at different concentrations of a LMW gelator showed a response of the microwave sensor to viscosity changes of the medium (ESI†). On the basis of this observation, the dielectric properties of the sol–gel transition were continuously monitored at microwave frequencies and the obtained profile was correlated with the actual temperature of the material (ESI†). Moreover, DSC thermograms were recorded separately for model systems in order to draw meaningful comparisons between the change in the dielectric properties of the material and the exothermic effect associated with the sol–gel transition (Fig. 3). The temperature profiles during the sol–gel period were constructed independently by means of a thermocouple probe (∅ 0.1 mm) centrally placed inside the mixture. We confirmed that the use of this probe did not affect the gelation kinetics. After each measurement, the state of the material was examined by the “stable-to-inversion” test, and the gel condition of model samples that did not show gravitational flow upon turning the vial upside-down was also confirmed by oscillatory rheological measurements (ESI†).
Fig. 3 shows the evolution of the dielectric constant (the real part of the dielectric properties) of the isotropic solution of 3 in toluene during the sol–gel period. The curve provides at least three sections with trend lines of different slopes. The first intersection point between the 1st and 2nd trend lines corresponded to a temperature of 48 °C, which lies in the same region compared to the single exothermic peak observed by DSC and attributed to the TSG. However, the visual inspection of the sample vial, as well as in situ monitoring of the temperature profile, showed that complete macroscopic gelation of the solvent (i.e., the material did not flow upon inversion of the vial upside-down) was only achieved when the temperature reached ca. 26 °C. This value was in good agreement with the second intersection point between the 2nd and 3rd trend lines. The reason for the slight difference between the estimated temperatures and the actual values probably falls in the procedure to prepare the sample, which is heated (or cooled in the case of gelator 10) before introducing it into the sensor system, whereas the measurement cell remains at RT. This modifies the temperature of both the sample holder and the material during the measurement of the resonance frequency causing the observed deviations.
Moreover, appropriate control experiments demonstrated the relationship between the molecular aggregation of the gelator molecules and the dielectric properties of the bulk material as recorded by the sensor (vide infra). These experiments included the investigation of systems displaying a sol–gel transition at RT (e.g., metallogel made from the gelator mixture 9; photoinduced reversible phase transition of the gel made from 8), as well as studies in different solvents and in the absence of gelator molecules (ESI†).
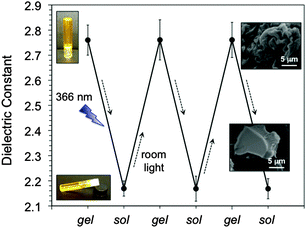
In this context, we have recently demonstrated that gelator 8, a tetrapeptide bearing an azobenzene unit in the side-chain, is able to form a variety of physical organogels mainly through hydrogen bonding and π–π interactions as driving forces.28 Moreover, the gelation can be triggered by thermal, ultrasound or light stimuli. Thus, UV irradiation at λmax = 366 nm of the corresponding gel made in toluene caused the trans–cis isomerization of the azobenzene unit, which was accompanied by a gel–sol transition of the gel to the corresponding solution at RT. This photoisomerization was in agreement with the decrease of the π–π* transition band (λmax = 328 nm) and simultaneous increase of the n–π* transition (λmax = 439 nm) (ESI†). On the other hand, cis–trans back isomerization and, hence, sol–gel transition could be achieved upon exposure of the sample to room light. As expected, the fibrillar morphology of the gel material disappeared in solution as evidenced by FESEM. As shown in Fig. 4, cyclic phase photoinduced transitions at RT were also accompanied by a reproducible change in the dielectric properties of the material.
The use of the gelator system 9 constitutes another interesting example of gelation at RT. In this context, oxalic acid has been proven to be the lowest molecular weight organic ligand able to form stable supramolecular metallogel networks in the presence of metal salts.26 Specifically, a transient colloidal suspension can be obtained at RT upon combination of two solutions containing Cu(II) acetate monohydrate (0.28 M in DMF) and oxalic acid dihydrate (0.5 M in DMF). This colloidal intermediate gradually evolves into a stable gel under undisturbed conditions, which could be perceived as a change in the dielectric properties (i.e., the average dielectric constant of colloidal intermediate ≈34.28 and the dielectric constant of the stable gel phase ≈33.65).
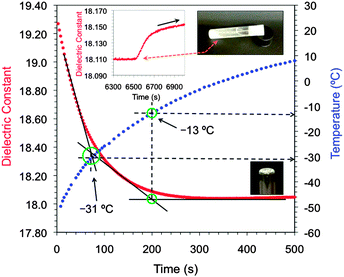
Moreover, the formation of organogels well below 0 °C can be achieved by the addition of small volumes of the multicomponent liquid gelator system 10i.e., a 0.13 M methanolic solution of (1R,2R)-1,2-diaminocyclohexane L-tartrate and 2.4 equiv. of concentrated HCl (37 wt% in aqueous solution) to a variety of organic solvents pre-cooled close to their freezing points.15 This procedure afforded the preparation of isotropic solutions containing the gelator system, which subsequently turned into homogeneous gels while warming up to RT (ESI†). However, in contrast to many organogels the temporal stability of these gels is very short due to the thermodynamic formation of (1R,2R)-1,2-diaminocyclohexane dichloride crystals, which finally causes the complete disruption of the gel matrix.15 Gel–crystal transitions have been previously related to the Ostwald rule of stages.29,30 Herein, the microwave sensor permitted not only the detection of the sol–gel transition at low temperature (T = −31 °C) that matched well the value read by a thermocouple in a separate experiment (T = −33 °C), but also the subsequent gel–crystal transition at RT ca. 2 h after gel formation (Fig. 5). Complete gel formation was verified by visual inspection at ca. −15 °C, which matched well with the second intersection point registered at −13 °C. As observed with other gelators, good correlations between measured and actual TSG values were also observed for other solvents (ESI†).
Fig. 6 shows a comparative plot of the TSG values obtained for a variety of gels using the microwave sensor, and the actual values were measured by other techniques as explained above (e.g., DSC and in situ thermocouple measurements).
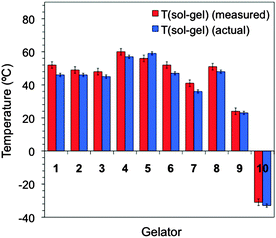 | ||
| Fig. 6 Representative chart comparing the TSG values estimated from the sensor outputs and the actual values obtained as described above for gels made from 1–10. See ESI† for additional examples and experimental details in tabular form (i.e., solvent and gelator concentration). | ||
The results indicated a good correlation between the different techniques to recognize the sol–gel transition under different conditions (e.g., solvent nature, concentration, and gelator structure). Finally, preliminary experiments have shown that the microwave sensor could also be used to detect the melting (gel–sol) transitions as we could record the variation of the dielectric properties of the material at single points (upon heating separately) and correlate marked changes with the TGS determined by DSC or the inverse flow method31 (ESI†).
Conclusions
The foregoing results demonstrate that the sol–gel transition of supramolecular gels can be estimated using a rapid and non-destructive open-ended coaxial microwave sensor, which allows continuous recording of the dielectric properties of dynamic mixtures at microwave frequencies without the need for reference values. The device comprises a microwave sensor, a microwave transmitter and receiver (from 1.5 to 2.5 GHz) and a control unit. When the electromagnetic waves penetrate into the material, its molecules tend to orient with the applied field and the material gains certain polarization, reflecting back part of the microwave signal from the sensor. The reflected signal is measured continuously to determine the resonance frequency and quality factor of the sensor during the gelation phenomenon. The phase transition is accompanied by a clear modification of the dielectric constant of the bulk material. This technique is compatible with a variety of physical gels characterized by different gelation mechanisms. Not only sol–gel but also gel–crystal transitions can be detected at microwave frequencies. Although the adaptation of the sensor for this particular application is still in its infancy, it has shown easy operability and remarkable sensitivity towards both composition and material stability (or structural change). Besides the application of the sensor to study other gel-like materials (e.g., polymer physical gels, chemical gels, and ionogels), work towards the integration of an internal precision heating/cooling controller of broad range in the microwave sensor, minimization of the sample volume, and the adaptation to a high-throughput analysis mode are currently underway.Acknowledgements
Financial support from Universität Regensburg (Anschubfinanzierung von Wissenschaftlichen Projekten), and the Ministerio de Economía y Competitividad –MINECO (Project Reference N° TEC2012-37532-C02-01) and European Regional Development Funds (ERDF) is gratefully acknowledged. We thank Prof. Oliver Reiser (Universität Regensburg) for his continuous support. We are also indebted to the groups of Prof. Achim Göpferich and PD. Dr Rainer Müller (Universität Regensburg) for their assistance with rheological and DSC measurements, respectively. D.D.D. thanks DFG for the Heisenberg Professorship Award.Notes and references
- R. G. Weiss and P. Terech, Molecular Gels: Materials with Self-Assembled Fibrillar Networks, Springer, New York, 2006 Search PubMed.
- X. Y. Liu and J.-L. Li, Soft fibrillar materials: fabrication and applications, Wiley-VCH, Weinheim, 2013 Search PubMed.
- D. D. Díaz, D. Kühbeck and R. J. Koopmans, Chem. Soc. Rev., 2011, 40, 427 RSC , and references therein.
- T. Tanaka, Sci. Am., 1981, 244, 110 CrossRef PubMed.
- D. Derossi, Y. Kajiwara and Y. Osada, Polymer Gels: Fundamentals and Biomedical Applications, Plenum Press, New York, 1991 Search PubMed.
- A. Ajayaghosh, V. K. Praveen and C. Vijayakumar, Chem. Soc. Rev., 2008, 37, 109 RSC.
- S. Banerjee, R. K. Das and U. Maitra, J. Mater. Chem., 2009, 19, 6649 RSC , and references therein.
- S. M. Aharoni, in Synthesis, Characterization, and Theory of Polymeric Networks and Gels, ed. S. M. Aharoni, Plenum, New York, 1992 Search PubMed.
- E. R. Zubarev, M. U. Pralle, E. D. Sone and S. I. Stupp, Adv. Mater., 2002, 14, 198 CrossRef CAS.
- D. R. Trivedi and P. Dastidar, Chem. Mater., 2006, 18, 1470 CrossRef CAS.
- M. Xue, D. Gao, X. Chen, K. Liu and Y. Fang, J. Colloid Interface Sci., 2011, 361, 556 CrossRef CAS PubMed.
- D. Bardelang, Soft Matter, 2009, 5, 1969 RSC , and references therein.
- F. Ilmain, T. Tanaka and E. Kokufuta, Nature, 1991, 349, 400 CrossRef CAS , and references therein.
- Y. Osada and A. R. Khokhlov, Polymer Gels and Networks, Marcel Dekker, New York, 2002 Search PubMed.
- I. Kapoor, E.-M. Schön, J. Bachl, D. Kühbeck, C. Cativiela, S. Saha, R. Banerjee, S. Roelens, J. J. Marrero-Tellado and D. D. Díaz, Soft Matter, 2012, 8, 3446 RSC.
- D. K. Kumar and J. W. Steed, Chem. Soc. Rev., 2014, 43, 2080 RSC , and references therein.
- P. Terech, C. Rossat and F. Volino, J. Colloid Interface Sci., 2000, 227, 363 CrossRef CAS PubMed.
- F. Salehli, H. C. Atalgil-Giz, A. Giz, O. Kamer and B. Altuncevahir, J. Appl. Polym. Sci., 2000, 77, 463 CrossRef CAS.
- F. Salehli, O. Kamer, H. C Atalgil-Giz, A. Giz and G. Yıldız, J. Non-Cryst. Solids, 2002, 305, 183 CrossRef CAS.
- J. Chen and M. Hojjati, Polym. Eng. Sci., 2007, 150 Search PubMed.
- D. Kranbuehl, M. Hoff, T. Hamilton, R. Clerk and W. Freeman, Proc. Am. Chem. Soc. Div. Polym. Mater. Sci. Eng., 1988, 59, 1116 CAS.
- B. García-Baños, A. J. Canós, F. L. Peñaranda-Foix and J. M. Catalá-Civera, IEEE Sens. J., 2011, 11, 62 CrossRef.
- B. García-Baños, J. M. Catalá Civera, F. L. Peñaranda-Foix, A. J. Canós and O. Sahuquillo-Navarro, Meas. Sci. Technol., 2012, 23, 1 CrossRef.
- W. Xi, W. R. Tinga, W. A. G. Voss and B. Q. Tian, IEEE Trans. Microwave Theory Tech., 1992, 40, 747 CrossRef.
- B. García-Baños, J. M. Catalá-Civera, A. J. Canós and F. L. Peñaranda-Foix, Microwave Sensors for Non-Invasive Monitoring of Industrial Processes, in Smart Sensors for Industrial Applications, CRC Press, 2013, ch. 29 Search PubMed.
- S. Saha, E.-M. Schön, C. Cativiela, D. D. Díaz and R. Banerjee, Chem. – Eur. J., 2013, 19, 9562 CrossRef CAS PubMed.
- E.-M. Schön, J. Bachl and D. D. Díaz, Nanosci. Nanotechnol.–Asia, 2014, 4, 31 CrossRef.
- P. Fatás, J. Bachl, S. Oehm, A. I. Jiménez, C. Cativiela and D. D. Díaz, Chem. – Eur. J., 2013, 19, 8861 CrossRef PubMed.
- V. J. Anderson and H. N. W. Lekkerkerker, Nature, 2002, 416, 811 CrossRef CAS PubMed.
- P. Zhu, X. Yan, Y. Su, Y. Yang and J. Li, Chem. – Eur. J., 2010, 16, 3176 CrossRef CAS PubMed.
- A. Takahashi, M. Sakai and T. Kato, Polym. J., 1980, 12, 335 CrossRef CAS.
Footnotes |
| † Electronic supplementary information (ESI) available: Materials and methods, synthetic procedures, gel preparation, additional figures, and expanded discussion. See DOI: 10.1039/c4cp04063e |
| ‡ These authors contributed equally to this work. |
| This journal is © the Owner Societies 2015 |

