 Open Access Article
La(OH)3:Eu3+ and La2O3:Eu3+ nanorod bundles: growth mechanism and luminescence properties†
Sk. Khaja
Hussain‡
,
Goli
Nagaraju
,
E.
Pavitra
,
G.
Seeta Rama Raju‡
 and
Jae Su
Yu
*
Department of Electronics and Radio Engineering, Institute for Wearable Convergence Electronics, Kyung Hee University, 1 Seocheon-dong, Giheung-gu, Yongin-si, Gyeonggi-do 446-701, Republic of Korea. E-mail: jsyu@khu.ac.kr; Fax: +82 206 2820; Tel: +82 31 201 3820
First published on 3rd November 2015
Abstract
Oriented attachment assisted self-assembled three-dimensional (3D) flower-like La(OH)3:Eu3+ nanorod bundles were successfully synthesized by a facile wet-chemical method. Hexamethylenetetramine played an important role in the formation of the hexagonal phase of La(OH)3:Eu3+ with respect to the reaction time and its concentration. No other surfactants or capping agents were used. The calcination temperature did not show any influence on the morphological texture, and the La2O3:Eu3+ phase was obtained by a subsequent annealing process. The phase formation and morphological properties were confirmed by X-ray diffraction, scanning electron microscopy, and transmission electron microscopy. The photoluminescence properties were studied for both the synthesized La(OH)3:Eu3+ and La2O3:Eu3+ samples, and also compared with that of the solid-state reaction based La2O3:Eu3+ phosphor. The 3D flower-like La2O3:Eu3+ nanorod bundles showed an intense red emission due to the hypersensitive 5D0 → 7F2 transition with good asymmetric ratio and chromaticity coordinates. Likewise, a systematic study of the cathodoluminescence (CL) properties was carried out in detail. Furthermore, to estimate the CL potentiality, the La2O3:Eu3+ phosphor was compared with a commercially available Y2O3:Eu3+ red phosphor.
Introduction
Generally, the chemical and physical properties of inorganic nanostructures depend on their chemical composition, size, phase, surface chemistry, and shape.1–5 In recent times, hierarchical three-dimensional (3D) complex architectures formed via self-assembly of 1D or 2D inorganic nanostructures have attracted much attention owing to their fascinating properties and versatile applications in solid-state lighting based optoelectronic applications with desired functions.1–4 However, investigation of reasonable synthetic procedures for the construction of complex 3D architectures by facile and useful growth methods without any external assistance via a chemical self-assembly route is still an intensive and hot research topic.5,6 Besides, copolymers or surfactants always play an important role in the formation procedure of novel 3D architectures due to their direct functioning during the nanostructure aggregation process along with their stabilizing quality in equilibrium systems.5Moreover, trivalent rare-earth (RE3+) ions such as Eu3+, Tb3+, Ce3+, Dy3+, Er3+, and Tm3+ which activate micro-/nano-structured metal oxide host lattices have been proved to be excellent for various applications such as field-emission display (FED) devices, optoelectronic devices, biological fluorescence labelling, lasers or waveguides, etc.7,8 FEDs are considered to be one of the most promising next-generation flat-panel display technologies due to their advantages of thin panel, wide viewing angle, self-emission, fast response time, high brightness/contrast, light weight, and low power consumption.9,10 Owing to the excellent light output and color rendering properties, FEDs are of great importance in nano fields with their wonderful stability under electron bombardment.11
For the above-mentioned applications, RE3+ ions activated yttrium (Y) based host lattice materials are widely used because of their suitable crystal structure and higher chemical stability.9,12 As compared with Y, lanthanum (La) is more abundant in RE mineral sources and lanthanum oxide (La2O3) is cheaper than yttrium oxide (Y2O3), but La based materials are still inadequate in the RE industry.9 In general, inorganic compounds containing La3+ ions are identified as excellent host materials for RE activators because the RE doping levels can be controlled over a wide range without changing the host lattice crystal structure. Thus, it is essential to study La based materials practically.
In this work, we synthesized novel self-assembled La2O3:Eu3+ flower-like architectures by a facile wet-chemical route. Here, hexamethylenetetramine (HMTA) is used as a surfactant. The obtained 3D flower-like morphology of the La(OH)3:Eu3+ precursor sample remains the same even after annealing at elevated temperatures. The formation mechanism of the self-assembled 3D flower-like lanthanum hydroxide architectures was examined as a function of reaction time and molar ratio of HMTA. The photoluminescence (PL) and cathodoluminescence (CL) properties of La(OH)3:Eu3+ and La2O3:Eu3+ flower-like architectures were also studied.
Experimental
La2(1−x)O3:2xEu3+ 3D flower-like nanorod bundles were synthesized by a silicon oil bath based facile wet-chemical method. The silicon oil bath was employed for temperature stability. In this synthesis, high-purity grade (Sigma-Aldrich Corp.) chemicals of lanthanum nitrate hexahydrate (La(NO3)3·6H2O), HMTA, and europium nitrate pentahydrate (Eu(NO3)3·5H2O) were used without any further purification. To prepare the La2O3:Eu3+ phosphors, the composition of La(NO3)3 and Eu(NO3)3·5H2O with HMTA was taken as equimolar ratio (1![[thin space (1/6-em)]](https://www.rsc.org/images/entities/char_2009.gif) :
:![[thin space (1/6-em)]](https://www.rsc.org/images/entities/char_2009.gif) 1). 2(1 − x) mol of La(NO3)3 and 2x mol of Eu(NO3)3·5H2O were added to 150 mL of de-ionized (DI) water under stirring at 500 rpm. After 30 min of stirring, the equal molar ratio of HMTA was added and the stirring was continued at room temperature for 1 h to achieve complete homogenization of all the reactants. The reaction mixture beaker was then wrapped with a polyethylene cover and kept in the silicon oil bath at 75 °C for different reaction times. After the reaction progressed at a given time, the silicon oil bath temperature was gradually decreased to room temperature and then the beaker was separated from the oil bath. The obtained precipitate was centrifuged at 3000 rpm for 5 min and washed with DI water and ethanol several times. The precipitate was dried at 120 °C for a day in an ambient atmosphere. The above experimental process was performed for the formation of La(OH)3:Eu3+ by varying the reaction time (1, 3, 5, 7, and 10 h), and all other parameters were unchanged. Finally, self-assembled 3D flower-like nanorod bundles of Eu3+ ions doped La(OH)3 were obtained. In order to examine the effect of HMTA, the experiment was repeated (reaction time of 10 h) under similar conditions except by varying the concentration of HMTA. Finally, the optimized precursor samples were calcined at different temperatures for further characterizations.
1). 2(1 − x) mol of La(NO3)3 and 2x mol of Eu(NO3)3·5H2O were added to 150 mL of de-ionized (DI) water under stirring at 500 rpm. After 30 min of stirring, the equal molar ratio of HMTA was added and the stirring was continued at room temperature for 1 h to achieve complete homogenization of all the reactants. The reaction mixture beaker was then wrapped with a polyethylene cover and kept in the silicon oil bath at 75 °C for different reaction times. After the reaction progressed at a given time, the silicon oil bath temperature was gradually decreased to room temperature and then the beaker was separated from the oil bath. The obtained precipitate was centrifuged at 3000 rpm for 5 min and washed with DI water and ethanol several times. The precipitate was dried at 120 °C for a day in an ambient atmosphere. The above experimental process was performed for the formation of La(OH)3:Eu3+ by varying the reaction time (1, 3, 5, 7, and 10 h), and all other parameters were unchanged. Finally, self-assembled 3D flower-like nanorod bundles of Eu3+ ions doped La(OH)3 were obtained. In order to examine the effect of HMTA, the experiment was repeated (reaction time of 10 h) under similar conditions except by varying the concentration of HMTA. Finally, the optimized precursor samples were calcined at different temperatures for further characterizations.
Characterization
The X-ray diffraction (XRD) patterns of the 3D flower-like nanorod bundles of La(OH)3:Eu3+ for different reaction times were recorded using a Mac Science (M18XHF-SRA) X-ray diffractometer with Cu Kα = 1.5406 Å. The morphologies of the 3D flower-like nanorod bundles were examined by using a field-emission scanning electron microscope (FE-SEM: JEOL JSM-6700) and a field-emission transmission electron microscope (FE-TEM: JEOL JEM-2100 F). The Fourier transform infrared (FTIR) spectra of the La(OH)3:Eu3+ and La2O3:Eu3+ samples were measured by using a Thermo Nicolet – 5700 FTIR spectrophotometer with the KBr pellet technique. Thermogravimetric and differential thermal analysis (TG-DTA) data were recorded by using an SDT Q600 V8.3 Build 101 instrument with a heating rate of 5 °C min−1 in a nitrogen flow of 100 mL min−1. The room-temperature PL and PL excitation (PLE) spectra were measured by using a Photon Technology International (PTI, USA) fluorometer. The CL properties were measured by a Gatan (UK) MonoCL3 system attached with the SEM (Hitachi S-4300 SE).Results and discussion
Structure and morphological studies of La(OH)3:Eu3+
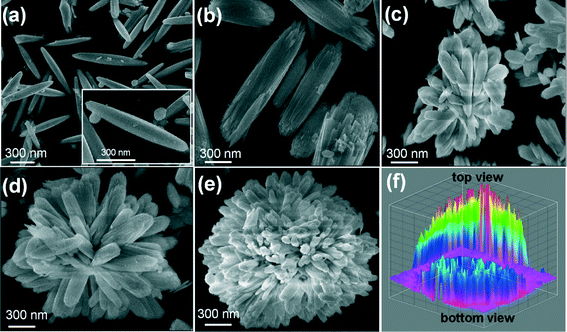
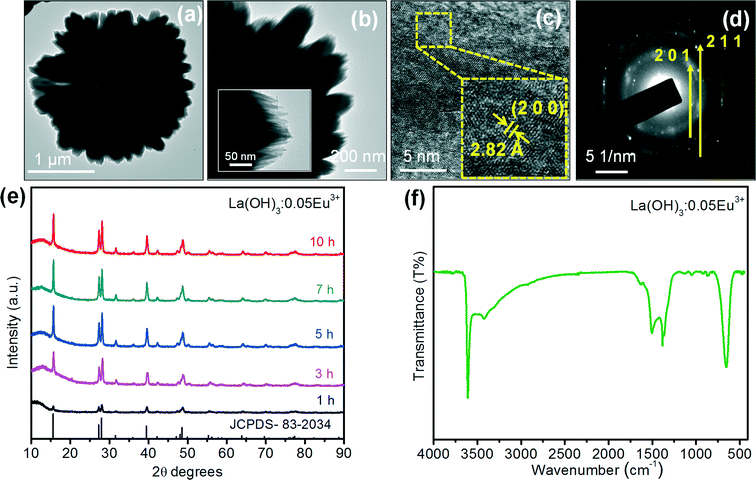
Fig. 1 shows the FE-SEM images of the self-assembled 3D flower-like morphology of La(OH)3:0.05Eu3+ (0.05 mol Eu3+ ion doped La(OH)3) nanorod bundles as a function of reaction time. The following mechanism was suggested for the formation of the self-assembled 3D flower-like La(OH)3:0.05Eu3+ nanorod bundles. Fig. 1(a) shows the SEM images of the La(OH)3:0.05Eu3+ submicron rods, which were obtained after 1 h of reaction time. The average length and diameter of the submicron rods were 4.9 μm and 454 nm, respectively. For more clarity, a single submicron rod of La(OH)3:0.05Eu3+ is shown in the inset of Fig. 1(a). Upon extending the reaction time to 3 h, the submicron rods split into nanorod bundles (Fig. 1(b)). With further increase of reaction time to 5 h, some of the individual nanorod bundles gathered and began to form like a group through a self-assembly process, as can be seen in Fig. 1(c). When the reaction time was increased to 7 h, the La(OH)3 nanorod bundles paired up and adhered to each other, showing improvement in the self-assembly process, which can be clearly observed in Fig. 1(d). At this stage, 70% of the self-assembly process was completed and the structure appeared as a flower. Finally, when the reaction time was increased to 10 h, the self-assembly process was completed and La(OH)3 nanorod bundles with 3D flower-like morphologies were observed, as shown in Fig. 1(e). For in-depth analysis of the nanorod bundle based La(OH)3 flower-like morphology, the 3D image was drawn using the interactive 3D surface plot of ImageJ software, as shown in Fig. 1(f). The interactive analysis of the top and bottom views of the La(OH)3 3D flower-like structures clarifies that they were grown with the combination of almost uniform sized and crystal splitting based nanorod bundles.The TEM image of the 3D flower-like La(OH)3:0.05Eu3+ sample (Fig. 2(a) and (b)) is well consistent with the SEM image of a similar sample. The corresponding selected area electron diffraction (SAED) pattern for the edge of the single nanorod bundle of La(OH)3:Eu3+ is shown in Fig. 2(c). The SAED pattern covers a number of bright spots in an irregular manner, revealing the nanocrystalline nature, and the diffraction spots were indexed to the pure hexagonal phase of La(OH)3 with the space group P63/m (176), corresponding to the (201) and (211) reflections. The high-resolution TEM (HRTEM) image of the precursor sample shows the imaging characteristics of the hexagonal structure. Here, the d-spacing of 2.82 Å corresponds to the distance of the (200) plane.
XRD analysis of La(OH)3:0.05Eu3+
The phase purity of the as-prepared La(OH)3:0.05Eu3+ samples was examined by XRD. Fig. 2(e) shows the XRD patterns of the pure La(OH)3:0.05Eu3+ samples obtained at different reaction times of 1, 3, 5, 7 and 10 h. At 1 h of reaction time, the intensities of the diffraction peaks were very weak. However, the intensity of the diffraction peaks also increased with increasing the reaction time, indicating that the crystallinity of the La(OH)3:0.05Eu3+ samples depends on the reaction time. All the diffraction peaks are attributed to the hexagonal crystal phase, which are in good agreement with the standard JCPDS card [83-2034] with the space group P63/m (176). This clearly indicates that a long reaction time is required for the growth of self-assembled 3D flower-like La(OH)3:0.05Eu3+ nanorod bundles with higher crystallinity because it increases the ionic transfer rate and separation of nuclei which allows complete crystal growth.13 No impurity phase is affected by the Eu3+ ions at the current doping levels, indicating that Eu3+ ions are completely dissolved into the La3+ sites of the La(OH)3 host lattice. It is well known that the pure phase is favorable for the luminescence properties of phosphors. Moreover, the full width at half maximum (FWHM) values of the strongest diffraction peaks were used to calculate the crystallite size from the well-known Scherer equation of Dhkl = kλ/β![[thin space (1/6-em)]](https://www.rsc.org/images/entities/char_2009.gif) cos
cos![[thin space (1/6-em)]](https://www.rsc.org/images/entities/char_2009.gif) θ,14 where D is the average grain size, k (0.9) is the shape factor, λ is the X-ray wavelength (1.5406 Å), β is the FWHM and θ is the diffraction angle of the observed peak. The calculated average crystallite sizes at 1, 3, 5, 7 and 10 h were 26.6, 40, 42.4, 49.3, and 55.7 nm, respectively.
θ,14 where D is the average grain size, k (0.9) is the shape factor, λ is the X-ray wavelength (1.5406 Å), β is the FWHM and θ is the diffraction angle of the observed peak. The calculated average crystallite sizes at 1, 3, 5, 7 and 10 h were 26.6, 40, 42.4, 49.3, and 55.7 nm, respectively.
FTIR study of La(OH)3:0.05Eu3+
FTIR is also one of the additional characterization techniques used to examine the presence of hydroxyl (OH−) groups and the formation of La(OH)3. Fig. 2(f) shows the FTIR spectrum of the 3D flower-like La(OH)3:0.05Eu3+ nanorod bundles synthesized at 10 h of reaction time. The spectrum showed an intense and sharp band at 3613 cm−1, corresponding to the stretching and bending O–H vibrations of La(OH)3.15,16 The bands at 3424 and 1635 cm−1 correspond to the O–H vibration from the absorbed water on the sample surface.13,15,16 The sharp peak at 1390 cm−1 is attributed to the bending mode of O–H.13,16 The band at nearly 660 cm−1 is related to the bending vibration of La–O–H.15 This FTIR analysis of the as-prepared La(OH)3 sample indeed indicates the presence of OH− groups.Growth mechanism of La(OH)3:Eu3+ 3D architectures
In order to explore the growth mechanism of the 3D flower-like La(OH)3:Eu3+ nanorod bundle morphology, various experiments were performed based on the reaction time and HMTA concentration. Herein, HMTA was used as an additive. In the initial stage of the growth process, HMTA hydrolyzed slowly in DI water upon heating and gradually released the OH− ions due to its weak basic nature. The following chemical reaction may occur in the growth process:13,17| (CH2)6N4 + 6H2O → 6HCHO + 4NH3 |
| 4NH3 + H2O → 4NH4+ + OH− |
| La3+ + 3OH− → La(OH)3 |
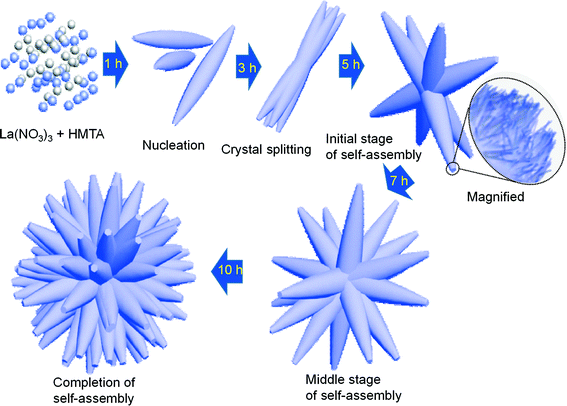
In this mechanism, HMTA played a key role in forming the self-assembled 3D flower-like morphologies of La(OH)3:0.05Eu3+ nanorod bundles with respect to the reaction time. No other templates/surfactants/emulsions were used in this experiment. It has been reported that when HMTA is used as a capping agent, it produces more OH− ions in the solution at a certain reaction temperature.17,18 A possible growth mechanism involved in the process of the formation of self-assembled 3D flower-like nanorod bundles is illustrated schematically in Fig. 3. In this synthesis, at the initial stage, individual submicron rods of La(OH)3:0.05Eu3+ are formed with the pure hexagonal phase as explained in the XRD section, indicating the occurrence of fast nucleation. The fast nucleation is caused by the presence of excess NH4+ ions in the reaction media, which accelerates the reaction between La3+ and OH− ions. With further increase of reaction time to 3 h, the submicron rods begin to split into nanorod bundles within the same unit due to crystal splitting, and the resulting submicron rods look like nanorod bundles. The nature of crystal splitting varies depending on both kinetic and thermodynamic factors which are related to the selected material.19–21 From the literature and the above proposed reaction mechanism, it is assumed that the excess of NH4+ ions strongly affects the formation of nanorod bundles.19–21 It is observed that as the reaction time further increases to 5 h, the splitting process is saturated, and the nanorod bundles tend to coalesce with each other by an oriented attachment assisted self-assembly process. This process usually depends on the size and surface capping of nanoparticles.18,22 It can be also noted that the presence of NH4+ ions not only induces the fast reaction but also acts as a soft template, thus prompting the oriented attachment assisted self-assembly process.18,22 The self-assembly process continues as the reaction time increases to 7 h. Finally, an anisotropic natured 3D flower-like morphology is observed after completing the reaction at 10 h. From the observed results, we are able to describe the growth mechanism of La(OH)3 3D flower-like structures as involving a sequence of nucleation, crystal splitting and self-assembly process assisted by oriented attachment.
To explore the role of HMTA concentration in the growth process of the self-assembled 3D flower-like morphologies of La(OH)3:Eu3+ nanorod bundles, a series of experiments were performed at 10 h of reaction time by varying the molar ratio of HMTA/La(NO3)3 such as (0.5![[thin space (1/6-em)]](https://www.rsc.org/images/entities/char_2009.gif) :
:![[thin space (1/6-em)]](https://www.rsc.org/images/entities/char_2009.gif) 1) (1
1) (1![[thin space (1/6-em)]](https://www.rsc.org/images/entities/char_2009.gif) :
:![[thin space (1/6-em)]](https://www.rsc.org/images/entities/char_2009.gif) 1) and (1.5
1) and (1.5![[thin space (1/6-em)]](https://www.rsc.org/images/entities/char_2009.gif) :
:![[thin space (1/6-em)]](https://www.rsc.org/images/entities/char_2009.gif) 1); the resulting SEM images are presented in Fig. S1 of the ESI.† At a molar ratio of 0.5HMTA and 1La(NO3)3, the synthesized La(OH)3:Eu3+ samples did not yield the perfect 3D flower-like morphology. It is noticed that the amount of HMTA is insufficient to produce NH4+ ions for the completion of the crystal splitting process and stabilization of La3+ ions in the solution. As a result, self-assembly of submicron rods with a partial 3D flower-like morphology at a low crystal splitting rate was observed and the corresponding low- and high-magnification SEM images are presented in Fig. S1(a) and (b),† respectively. Fig. S1(c) and (d)† shows clear views of the low- and high-magnification SEM images of the self-assembled perfect 3D flower-like morphologies of La(OH)3:Eu3+ nanorod bundles at a molar ratio of 1HMTA and 1La(NO3)3. Finally, at a molar ratio of 1.5HMTA and 1La(NO3)3, aggregation of the nanorod bundles took place and a disordered self-assembly process occurred due to the oversaturation of HMTA. The low- and high-magnification SEM images of the aggregated 3D flower-like morphology of La(OH)3:Eu3+ samples are shown in Fig. S1(e) and (f).† Therefore, from the above reasonable and scientific study, the concentration of HMTA played a crucial role in controlling the perfect 3D flower-like morphologies of La(OH)3:Eu3+ nanorod bundles.
1); the resulting SEM images are presented in Fig. S1 of the ESI.† At a molar ratio of 0.5HMTA and 1La(NO3)3, the synthesized La(OH)3:Eu3+ samples did not yield the perfect 3D flower-like morphology. It is noticed that the amount of HMTA is insufficient to produce NH4+ ions for the completion of the crystal splitting process and stabilization of La3+ ions in the solution. As a result, self-assembly of submicron rods with a partial 3D flower-like morphology at a low crystal splitting rate was observed and the corresponding low- and high-magnification SEM images are presented in Fig. S1(a) and (b),† respectively. Fig. S1(c) and (d)† shows clear views of the low- and high-magnification SEM images of the self-assembled perfect 3D flower-like morphologies of La(OH)3:Eu3+ nanorod bundles at a molar ratio of 1HMTA and 1La(NO3)3. Finally, at a molar ratio of 1.5HMTA and 1La(NO3)3, aggregation of the nanorod bundles took place and a disordered self-assembly process occurred due to the oversaturation of HMTA. The low- and high-magnification SEM images of the aggregated 3D flower-like morphology of La(OH)3:Eu3+ samples are shown in Fig. S1(e) and (f).† Therefore, from the above reasonable and scientific study, the concentration of HMTA played a crucial role in controlling the perfect 3D flower-like morphologies of La(OH)3:Eu3+ nanorod bundles.
Effect of calcination temperature
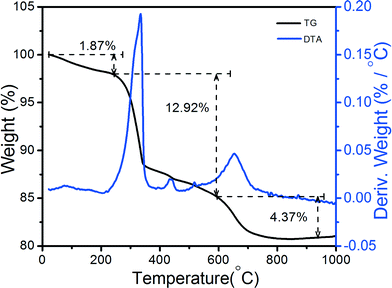
Thermal decomposition of RE hydroxide is a simple and universal route towards tailored RE and metal oxides. Fig. 4 shows the thermal behavior and weight loss percentage (%) of the as-prepared La(OH)3:0.05Eu3+ sample. The sample was characterized by TG/DTA analysis from room temperature to 1000 °C. TG/DTA measurements were conducted to determine the transformation of La(OH)3 to LaOOH and La2O3.23–26 The total weight loss of the La(OH)3 sample was 19.16 wt%, and it could be seen in the TG curve. From the TG curve, it was observed that the weight loss occurred in three steps up to 800 °C. The weight loss percentage in the first step was 1.87%. This is attributed to the transformation of La(OH)3 to LaOOH up to approximately 250 °C.25,26 In the second step, the major weight loss occurred up to 12.92%, related to the dehydration of LaOOH and the formation of La2O3 around 600 °C.11,24,25 Furthermore, 4.37% weight loss occurred due to the removal of intercalated nitrate ions up to 800 °C.25 The theoretical values for weight loss of the mentioned transformation were reported to be 9.5 and 4.5%, respectively, which were in agreement with the reported data.23,25,26 The DTA spectrum revealed two major exothermic peaks. One of the peaks occurred at 335 °C, which is related to the second and major weight loss, indicating good agreement with the transformation of La(OH)3 into LaOOH as reported earlier.25 It is well known that LaOOH is an intermediate phase with a monoclinic crystal structure and the space group is P21/m (No. 11).25 The second peak observed at approximately 652 °C is associated with the dehydration of LaOOH and the formation of La2O3.25,26 Therefore, from the TG-DTA data, it is found that more heat is required to eliminate the hydroxyl group and form La2O3.XRD analysis and FTIR study of La2O3:Eu3+
To obtain the product La2O3:0.05Eu3+ from La(OH)3:0.05Eu3+ samples, the precursor samples were calcined for 6 h at 600 and 800 °C (raising the temperature with 1 °C min−1), and the suitable calcination temperature was optimized. Fig. 5(a) shows the XRD patterns of La(OH)3:0.05Eu3+ at different calcination temperatures. From the XRD patterns, the low intensity of oxide diffraction peaks was observed at 600 °C, indicating that it requires a high temperature to be converted to La2O3:0.05Eu3+ with better crystallinity. After being calcined at 800 °C, all the diffraction peaks were readily indexed to the pure hexagonal phase of La2O3:0.05Eu3+ with the space group P![[3 with combining macron]](https://www.rsc.org/images/entities/char_0033_0304.gif) m1(164), which agrees well with the standard JCPDS card [05-0602]. Fig. S2 of the ESI† shows the XRD patterns of La2O3:Eu3+ samples as a function of Eu3+ ion concentration. Notably, there were no impurity peaks found from any other secondary phases, indicating that La(OH)3:Eu3+ was completely converted into La2O3:Eu3+ after calcination at 800 °C. Moreover, the functional groups of La2O3:0.05Eu3+ were further examined by FTIR spectroscopy. Fig. 5(b) shows the FTIR spectra of the La2O3:0.05Eu3+ sample with self-assembled 3D flower-like nanorod bundles. From the FTIR spectra, it is clearly noticed that there is no major intense and sharp peak at 3613 cm−1 related to the stretching and bending vibration of O–H.7,16 Also, the observed remaining peaks at 3424 and 1635 cm−1 had weak and broad absorption bands, which shows the existence of water molecules on the surface of La2O3:0.05Eu3+ nanostructures.13 The bands between 850 and 500 cm−1 indicate the La–O bending vibrational frequencies.7,16
m1(164), which agrees well with the standard JCPDS card [05-0602]. Fig. S2 of the ESI† shows the XRD patterns of La2O3:Eu3+ samples as a function of Eu3+ ion concentration. Notably, there were no impurity peaks found from any other secondary phases, indicating that La(OH)3:Eu3+ was completely converted into La2O3:Eu3+ after calcination at 800 °C. Moreover, the functional groups of La2O3:0.05Eu3+ were further examined by FTIR spectroscopy. Fig. 5(b) shows the FTIR spectra of the La2O3:0.05Eu3+ sample with self-assembled 3D flower-like nanorod bundles. From the FTIR spectra, it is clearly noticed that there is no major intense and sharp peak at 3613 cm−1 related to the stretching and bending vibration of O–H.7,16 Also, the observed remaining peaks at 3424 and 1635 cm−1 had weak and broad absorption bands, which shows the existence of water molecules on the surface of La2O3:0.05Eu3+ nanostructures.13 The bands between 850 and 500 cm−1 indicate the La–O bending vibrational frequencies.7,16
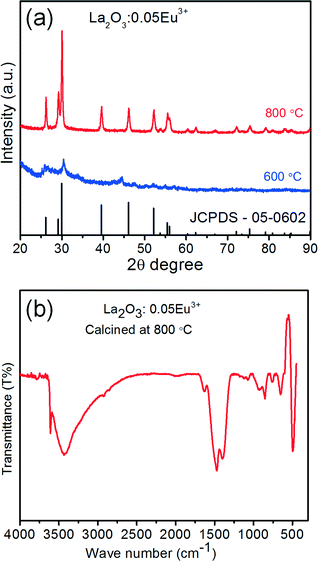 | ||
| Fig. 5 (a) XRD patterns of the calcined La2O3:0.05Eu3+ samples at 600 and 800 °C. (b) FTIR spectrum of the calcined La2O3:0.05Eu3+ sample at 800 °C. | ||
Structural and morphological studies of La2O3:Eu3+ 3D architectures after calcination process
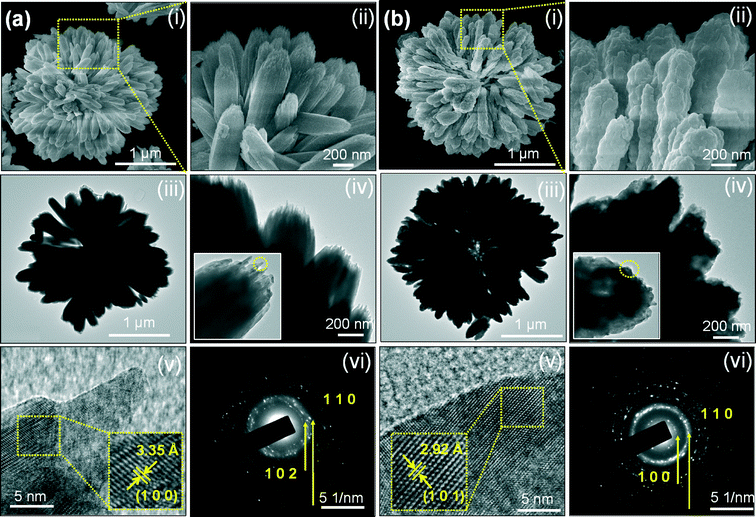
To examine the stability of the 3D flower texture, the typical FE-SEM, TEM, and HRTEM images, and SAED patterns of La2O3:0.05Eu3+ samples after calcination at 600 and 800 °C were obtained (see Fig. 6). The SEM images in Fig. 6(a)(i) and (b)(i) revealed that the self-assembled 3D flower-like nanorod bundles inherited their original morphology. However, from a close observation of the high-magnification SEM image (Fig. 6(a)(ii)), the surface of the self-assembled 3D flower-like nanorod bundles became rough with sharp chews as compared with the La(OH)3:0.05Eu3+ precursor. This might be due to the gradual elimination of OH and the increased particle size as a result of increased crystallinity during the calcination process (600 °C). This situation can be also confirmed by analysis of TEM images, as shown in Fig. 6(a)(iii) and (a)(iv). When the calcination temperature was further increased to 800 °C, without changing the 3D flower texture, the particles in the nanorod bundles became bigger and coalesced or merged with each other, and the sharpness of the chews completely vanished. The merging is related to the melting process because the surface-to-volume ratio of the nanoparticles is relatively high, and at high temperatures, the surface energy substantially affects the interior bulk properties of the materials. For further clarification, the high-magnification SEM and TEM images are shown in Fig. 6(b)(ii), (b)(iii) and (b)(iv). However, the conversion of La(OH)3:0.05Eu3+ to La2O3:0.05Eu3+ did not change the morphology, and such a transformation is common for decomposition of RE metal hydroxide and metal compounds.15,25 The original texture morphologies were maintained perhaps due to the higher activation energies needed for the collapse of these structures, and this morphology-inheriting method is a facile and general strategy for designing morphology-dependent functional compounds.15,25 The fine structure of the as-prepared La2O3:0.05Eu3+ samples was further studied from the HRTEM images and SAED patterns. The SAED patterns of the calcined samples confirmed their nanocrystalline nature by producing a number of bright spots in an irregular manner and exhibiting the (100) (110) and (102) reflections, as shown in Fig. 6(a)(iv) and (b)(iv). The corresponding HRTEM image shows the imaging characteristics of the hexagonal La2O3 structure with a d-spacing of 3.35 Å, corresponding to the (100) plane of the sample calcined at 600 °C (Fig. 6(a)(v)). In a similar way, the sample calcined at 800 °C exhibited a d-spacing of 2.92 Å, corresponding to the (101) plane (Fig. 6(b)(v)). Fig. 7 shows the elemental mapping of the La2O3:Eu3+ sample, which was analyzed by energy dispersive X-ray (EDX) spectroscopy. The EDX spectrum was taken for a single self-assembled 3D flower in TEM mode and no elements other than La, O, and Eu appeared from the measurement, which supports the XRD results.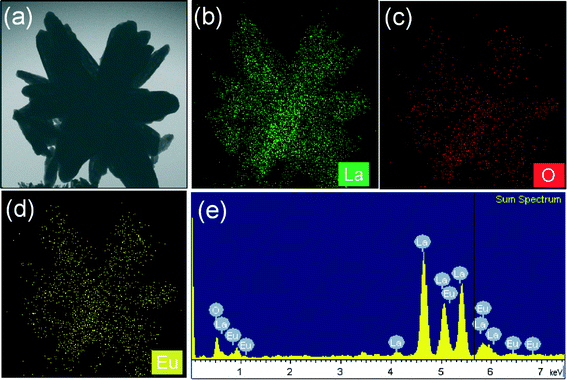 | ||
| Fig. 7 (a) TEM image, (b–d) elemental mapping images, and (e) EDX spectrum for the as-prepared La2O3:Eu3+ sample after being calcined at 800 °C. | ||
Photoluminescence properties
Fig. 8(a) and (b) shows the PLE spectra of the La(OH)3:0.05Eu3+ and La2O3:Eu3+ samples by monitoring the emission wavelengths at 611 and 625 nm, respectively. The dominant excitation wavelength was observed at 393 nm for the La(OH)3 sample along with some weak f–f transitions. However, no charge transfer band (CTB) was observed in the higher energy region. Fig. 8(b) also shows the PLE spectra of La2O3:Eu3+ as a function of Eu3+ ion concentration. The PLE spectra exhibited the CTB with band maxima at 291 nm along with the f–f transitions at 361 nm (7F0 → 5D4), 382 nm (7F0 → 5G4), 395 nm (7F0 → 5L6), 414 nm (7F0 → 5L6), 466 nm (7F0 → 5D2), and 538 nm (7F0 → 5D1).27 It is noticed that the CTB appears for the calcined samples because the distance between the completely filled 2p orbital of O2− ions and the partially filled 4f orbital of Eu3+ ions decreases due to the increased crystallite or particle size. But, for the La(OH)3:0.05Eu3+ phosphor, the charge transfer between the O2− and Eu3+ ions is almost null due to the presence of OH− group and the smaller particle sizes. These sharp excitation peaks of Eu3+ indicate that violet and blue laser diodes/light-emitting diodes are also efficient pumping sources in obtaining Eu3+ emissions.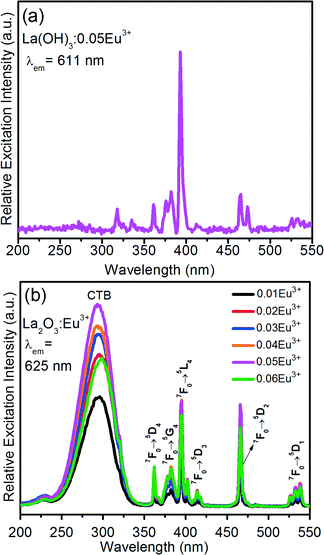 | ||
| Fig. 8 PLE spectra of (a) the La(OH)3:0.05Eu3+ sample after completing the reaction at 10 h and (b) the La2O3:Eu3+ samples as a function of Eu3+ ion concentration. | ||
Fig. 9(a) shows the PL spectra of the La(OH)3:0.05Eu3+ sample with self-assembled 3D flower-like nanorod bundles under an excitation wavelength of 395 nm. Fig. 9(b) shows the PL spectra of the La2O3:0.05Eu3+ sample as a function of excitation wavelength. The La(OH)3:0.05Eu3+ sample revealed intense emission peaks in the blue, orange and red regions due to the emissions coming from higher energy states like 5D3 (430 nm), 5D2 (468 nm), 5D1 (532 nm) and 5D0 (592, 610, 650, and 700 nm). Among them, an intense emission band was observed due to the forced electric–dipole/hypersensitive transition at 611 nm (5D0 → 7F2). However, La2O3:Eu3+ 3D flower-like nanorod bundles show emission bands only from the 5D0 metastable state. An intense emission band appeared at 625 nm due to the (5D0 → 7F2) transition of Eu3+ ions.28,29 In both cases, the intense emission peaks confirmed that the Eu3+ ions are located at the sites without inversion symmetry. The moderate intense emission bands at 578 nm due to the (5D0 → 7F0) transition and the bands at 586 and 594 nm correspond to the magnetic dipole (5D0 → 7F1) transition that appeared in the PL spectra.28,29 The PL spectra exhibited similar emission bands under different excitation wavelengths. The intense emission was observed under an excitation wavelength of 291 nm. Therefore, we presented the PL spectra as a function of Eu3+ ion concentration at 291 nm of excitation wavelength.
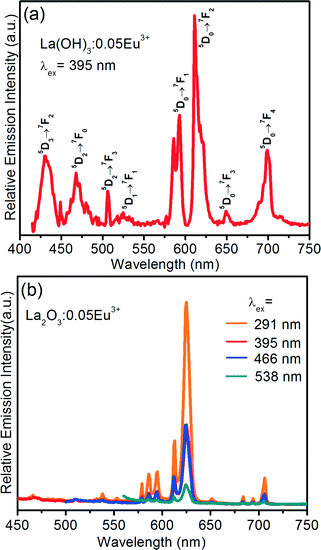 | ||
| Fig. 9 PL spectra of (a) the La(OH)3:0.05Eu3+ sample after completing the reaction at 10 h and (b) the La2O3:0.05Eu3+ sample as a function of excitation wavelength. | ||
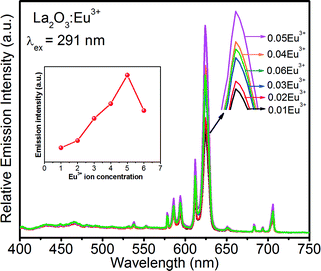
Fig. 10 shows the PL spectra of the La2O3:Eu3+ 3D flower-like nanorod bundle samples as a function of Eu3+ ion concentration. When the Eu3+ ion concentration increased from 1 to 5 mol%, the emission intensity also increased, and with further increase of Eu3+ ion concentration above 6 mol%, the emission intensity decreased due to the concentration quenching. The concentration quenching might be elucidated in the La2O3 host lattice by the following two factors: (i) when the Eu3+ concentration is increased, the resonance between the activator ions increases, which results in the enhancement of excitation migration, and thus the excitation energy reaches the quenching centers, and (ii) the Eu3+ ions are paired or coagulated in the La2O3 host lattice and changed into quenching centers. The above results suggest that the physical and chemical properties of the La2O3:Eu3+ nanophosphors are stable at the optimum concentration of 5 mol% for Eu3+ ions. The correlation between the concentration of Eu3+ ions and emission intensity is also shown in the inset of Fig. 10.
To explore the richness of the red emission of the La2O3:0.05Eu3+ phosphor with 3D flower-like nanorod bundles, the present phosphor was compared with the bulk La2O3:0.05Eu3+ phosphor, which was prepared by a solid-state reaction method under the same composition and annealed at 800 °C for 5 h, as shown in Fig. 11. Under 291 nm excitation, it can be seen that both phosphors displayed similar emission behaviors except intensities. However, at similar measurement conditions, the emission intensity of the La2O3:0.05Eu3+ nanorod bundle phosphor was much higher than that of the phosphor prepared by a solid-state reaction method. It is also noticed that the most intense transition for both phosphors appears at 625 nm, which is the best component for red emission. The R/O values for the La2O3:0.05Eu3+ nanorod bundle phosphor and solid-state reaction based La2O3:0.05Eu3+ phosphor were about 6.40 and 4.32. It is well known that a higher R/O value indicates improved color purity of the red component.30
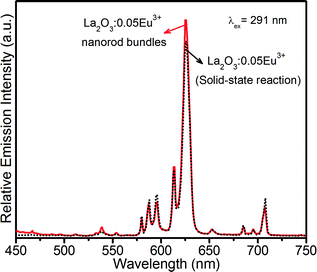 | ||
| Fig. 11 PL intensity comparison of La2O3:0.05Eu3+ phosphor with 3D flower-like nanorod bundles with solid-state reaction based La2O3:0.05Eu3+ phosphor. | ||
Cathodoluminescence properties
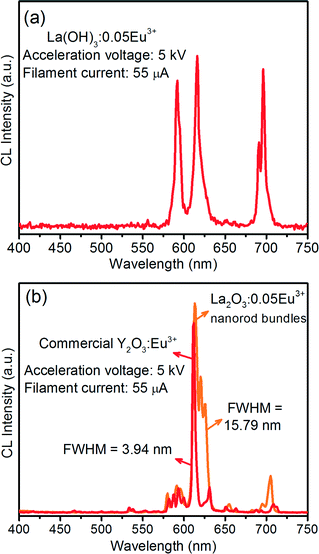
In order to explore the potential of the as-prepared self-assembled 3D flower-like nanorod bundles of La(OH)3:0.05Eu3+ and La2O3:0.05Eu3+ for use as CL materials, their CL properties were investigated in detail. Fig. 12 shows the CL spectra of the optimized (a) La(OH)3:0.05Eu3+ and (b) La2O3:0.05Eu3+ samples under low electron beam excitation (acceleration voltage: 5 kV and filament current: 55 μA). From the CL spectra of both the samples, somewhat different behaviors were observed as compared to the PL spectra. In the PL spectra, the La(OH)3:0.05Eu3+ sample showed moderately intense emission bands in the blue and deep red regions, while in the CL spectra, the emission bands did not appear in the blue region, but a highly intense emission band appeared in the deep red region due to the (5D0 → 7F4) transition. For both La(OH)3:0.05Eu3+ and La2O3:0.05Eu3+ samples, a strong emission band appeared at 615 nm due to the (5D0 → 7F2) transition. The fact that the emission bands were not observed in the blue region and the intense emission was observed in the deep red region can be explained by different mechanisms in the CL process as compared to the PL process.14 In CL, the high energy electrons excite almost all the activator ions due to the deeper penetration depth, and thus there is a possibility of cross-relaxation between Eu3+ ions. As a result, the energy transfer process occurs from the higher energy levels to the lower metastable states.To estimate the possibility of the phosphor for the desired application, it is a better approach to establish their efficiency. The CL efficiency has been analyzed by the radiant efficiency (η) and the luminous efficiency, i.e., brightness (L) of the given material. According to the literature,31 to understand the CL efficiency of the red emitting La2O3:0.05Eu3+ phosphor with self-assembled 3D flower-like nanorod bundles, η and L can be compared with those of the commercially available Y2O3:Eu3+ phosphor under an accelerating voltage of 5 kV and a filament current of 55 μA, as shown in Fig. 12(b). From the comparative CL spectra, the commercial Y2O3:Eu3+ phosphor revealed quite sharp emission peaks in the red region with band maxima at 611 nm, exhibiting a FWHM value of 3.94 nm. The synthesized La2O3:0.05Eu3+ phosphor showed a broad band between 604 and 638 nm with band maxima at 615 nm and the calculated FWHM value is 15.79 nm. It is clear that the La2O3:0.05Eu3+ phosphor with 3D flower-like nanorod bundles exhibited a higher CL intensity, such as brightness, and also a 4 times higher FWHM emission value (emission peak area) than the commercial Y2O3:Eu3+ phosphor. Therefore, the La2O3:0.05Eu3+ 3D flower-like nanorod bundle phosphor might be more efficient than the commercially available Y2O3:Eu3+ phosphor.
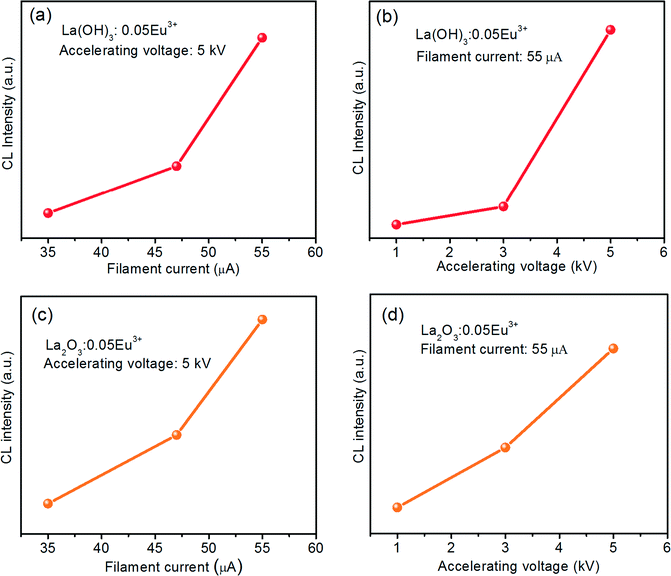
Fig. 13 shows the CL intensities of the La(OH)3:0.05Eu3+ and La2O3:0.05Eu3+ phosphors as a function of filament current and accelerating voltage. From Fig. 13(a) and (c), it is evident that when the accelerating voltage was fixed at 5 kV, the CL intensities of both the as-prepared La(OH)3:0.05Eu3+ and La2O3:0.05Eu3+ samples increased with an increase of filament current from 35 to 55 μA and no saturation was observed up to 55 μA. Fig. 13(b) and (d) shows the increased CL intensities for both La(OH)3:0.05Eu3+ and La2O3:0.05Eu3+ samples with increasing accelerating voltage from 1 to 5 kV under a fixed filament current of 55 μA. The reason behind the increased CL intensity for both samples is that the Eu3+ ions are excited through plasma produced by incident electrons. When the electron penetration depth becomes deeper, more plasma will be produced, thus producing more Eu3+ ions being excited. Hence, the CL intensity increased.9,32 Thus, from the behavior of the increased CL intensity with increasing the filament current and accelerating voltage and also from the comparative study with the commercial Y2O3:Eu3+ phosphor, we are able to suggest that these La(OH)3:0.05Eu3+ and La2O3:0.05Eu3+ phosphor samples are potential red phosphors in the development of FED systems.
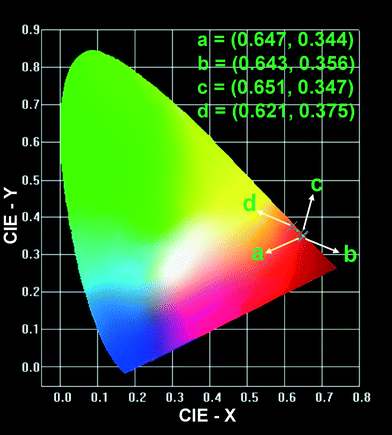
Fig. 14 shows the Commission Internationale de L'Eclairage (CIE) chromaticity coordinates calculated from the PL and CL spectra of La2O3:0.05Eu3+ phosphors synthesized by the facile wet-chemical and solid-state reaction methods. The calculated CIE chromaticity coordinates from the PL emission of the La2O3:0.05Eu3+ phosphor with 3D flower-like nanorod bundles and solid-state reaction based La2O3:0.05Eu3+ phosphor were (0.647, 0.344) and (0.643, 0.356), respectively. Clearly, the La2O3:0.05Eu3+ 3D flower-like nanorod bundle phosphor has a higher red color purity compared to the solid-state reaction based La2O3:0.05Eu3+ phosphor. Hence, the obtained PL results suggest that the emission intensity and color purity of the La2O3:0.05Eu3+ nanorod bundle phosphor are better than those of the solid-state reaction based La2O3:0.05Eu3+ phosphor. Similarly, in order to compare the color richness in the CL spectra, the calculated CIE chromaticity coordinates of the La2O3:0.05Eu3+ 3D flower-like nanorod bundle phosphos were compared with those of the commercially available Y2O3:Eu3+ phosphor. The La2O3:0.05Eu3+ 3D flower-like nanorod bundle phosphor revealed much better chromaticity coordinates (0.651, 0.347) in the red region than the commercially available Y2O3:Eu3+ phosphor (0.621, 0.375), which supports the given explanation about the CL efficiency in the CL section.
Conclusions
In summary, self-assembled 3D flower-like nanorod bundles of La(OH)3:0.05Eu3+ were successfully synthesized by a facile wet-chemical method. The XRD patterns exhibited a hexagonal structure, and the FTIR spectra confirmed the presence of OH− group of La(OH)3:0.05Eu3+ nanorod bundles. From SEM and TEM measurements, it is clear that the 3D flower-like morphology was formed by both crystal splitting and self-assembly process. The growth mechanism was discussed as a function of reaction time. After calcining the La(OH)3:0.05Eu3+ samples, the XRD pattern confirmed the formation of the La2O3:Eu3+ phase. The effect of calcination on the morphology of La2O3:Eu3+ was also examined by SEM and TEM. The PL and CL studies were performed for the La(OH)3:0.05Eu3+ and La2O3:Eu3+ samples. From the PL spectral properties, the synthesized La2O3:0.05Eu3+ nanorod bundle phosphor showed a higher asymmetric ratio value than the solid-state reaction based La2O3:0.05Eu3+ phosphor. Furthermore, in the CL study, the La2O3:0.05Eu3+ phosphor exhibited higher CL intensity, higher FWHM value, and at the same time much better CIE chromaticity coordinates than the commercially available Y2O3:Eu3+ phosphor. Finally, from the above analysis, we are able to suggest that the La(OH)3:Eu3+ and La2O3:Eu3+ phosphors with self-assembled 3D flower-like nanorod bundles are promising materials for application in the development of novel optical systems such as FEDs, cathode ray tubes, plasma display panels, fluorescent lamps, etc.Acknowledgements
This work was supported by a grant from the National Research Foundation of Korea (NRF) funded by the Korean government (MSIP) (No. 2014-069441).References
- G. S. R. Raju, E. Pavitra and J. S. Yu, Dalton Trans., 2013, 42, 11400–11410 RSC.
- Z. Xu, C. Li, D. Yang, W. Wang, X. Kang, M. Shang and J. Lin, Phys. Chem. Chem. Phys., 2010, 12, 11315–11324 RSC.
- A. K. Parchur, A. I. Prasad, A. A. Ansari, S. B. Rai and R. S. Ningthoujam, Dalton Trans., 2012, 41, 11032–11045 RSC.
- A. K. Parchur, A. I. Prasad, S. B. Rai and R. S. Ningthoujam, Dalton Trans., 2012, 41, 13810–13814 RSC.
- J. Yang, C. Li, Z. Quan, C. Zhang, P. Yang, Y. Li, C. Yu and J. Lin, J. Phys. Chem. C, 2008, 112, 12777–12785 CAS.
- N. Zhang, W. Bu, Y. Xu, D. Jiang and J. Shi, J. Phys. Chem. C, 2007, 111, 5014–5019 CAS.
- M. Runowski, T. Grzyb, A. Zep, P. Krzyczkowska, E. Gorecka, M. Giersig and S. Lis, RSC Adv., 2014, 4, 46305–46312 RSC.
- N. Imanaka, J. Ceram. Soc. Jpn., 2005, 113, 387–393 CrossRef CAS.
- G. Li, C. Peng, C. Zhang, Z. Xu, M. Shang, D. Yang, X. Kang, W. Wang, C. Li, Z. Cheng and J. Lin, Inorg. Chem., 2010, 49, 10522–10535 CrossRef CAS PubMed.
- N. Hirosaki, R.-J. Xie, K. Inoue, T. Sekiguchi, B. Dierre and K. Tamura, Appl. Phys. Lett., 2007, 91, 061101 CrossRef.
- B. C. Cheng, Z. Y. Ouyang, B. X. Tian, Y. H. Xiao and S. J. Lei, Ceram. Int., 2013, 39, 7379–7386 CrossRef CAS.
- Z.-L. Wang, H. Chan, H.-L. Li and J. Hao, Appl. Phys. Lett., 2008, 93, 141106 CrossRef.
- M. Vaseem, A. Umar, S. H. Kim and Y.-B. Hahn, J. Phys. Chem. C, 2008, 112, 5729–5735 CAS.
- G. S. R. Raju, E. Pavitra and J. S. Yu, Phys. Chem. Chem. Phys., 2014, 16, 18124–18140 RSC.
- G. Li, C. Li, Z. Xu, Z. Cheng and J. Lin, CrystEngComm, 2010, 12, 4208–4216 RSC.
- M. Aghazadeh, A. N. Golikand, M. Ghaemi and T. Yousefi, J. Electrochem. Soc., 2011, 158, E136–E141 CrossRef CAS.
- R. Zhao, L. Wang, Z.-F. Chai and W.-Q. Shi, RSC Adv., 2014, 4, 52209–52214 RSC.
- Z. Zhuang, X. Xue and Z. Lin, Phys. Chem. Chem. Phys., 2015, 17, 4845–4848 RSC.
- J. Tang and A. P. Alivisatos, Nano Lett., 2006, 6, 2701–2706 CrossRef CAS PubMed.
- A. T. Kelly, I. Rusakova, T. Ould-Ely, C. Hofmann, A. Lüttge and K. H. Whitmire, Nano Lett., 2007, 7, 2920–2925 CrossRef CAS PubMed.
- H. Zhang, D.-H. Ha, R. Hovden, L. F. Kourkoutis and R. D. Robinson, Nano Lett., 2010, 11, 188–197 CrossRef PubMed.
- Z. Deng, D. Chen, F. Tang, X. Meng, J. Ren and L. Zhang, J. Phys. Chem. C, 2007, 111, 5325–5330 CAS.
- A. Neumann and D. Walter, Thermochim. Acta, 2006, 445, 200–204 CrossRef CAS.
- S. Z. Markov, L. V. Ladeinova-Soboleva and A. M. Chernyshova, Russ. Chem. Bull., 1961, 10, 1805–1810 CrossRef.
- X. Zhang, P. Yang, D. Wang, J. Xu, C. Li, S. Gai and J. Lin, Cryst. Growth Des., 2011, 12, 306–312 Search PubMed.
- E. Füglein and D. Walter, J. Therm. Anal. Calorim., 2012, 110, 199–202 CrossRef.
- W. T. Carnall, P. R. Fields and K. Rajnak, J. Chem. Phys., 1968, 49, 4450–4455 CrossRef CAS.
- E. Pavitra and J. Su Yu, Mater. Lett., 2013, 90, 134–137 CrossRef CAS.
- I. L. V. Rosa, A. P. Maciel, E. Longo, E. R. Leite and J. A. Varela, Mater. Res. Bull., 2006, 41, 1791–1797 CrossRef CAS.
- G. S. R. Raju, E. Pavitra, G. Nagaraju and J. S. Yu, Dalton Trans., 2015, 44, 1790–1799 RSC.
- G. Li, C. Li, C. Zhang, Z. Cheng, Z. Quan, C. Peng and J. Lin, J. Mater. Chem., 2009, 19, 8936–8943 RSC.
- G. S. R. Raju, Y. H. Ko, E. Pavitra, J. S. Yu, J. Y. Park, H. C. Jung and B. K. Moon, Cryst. Growth Des., 2011, 12, 960–969 Search PubMed.
Footnotes |
| † Electronic supplementary information (ESI) available. See DOI: 10.1039/c5ce01688f |
| ‡ These authors contributed equally to this work. |
| This journal is © The Royal Society of Chemistry 2015 |

