
 Open Access Article
 This Open Access Article is licensed under a Creative Commons Attribution-Non Commercial 3.0 Unported Licence
In situ variable-temperature single crystal X-ray diffraction studies of the single-crystal-to-single-crystal dehydration and rehydration of a mixed-ligand 2D zinc metal–organic framework using trimesate and 4,4′-bipyridine-N,N′-dioxide as ligands†
Tayyibah
Tahier
and
Clive L.
Oliver
*
Centre for Supramolecular Chemistry Research, Department of Chemistry, University of Cape Town, Rondebosch, 7701, South Africa. E-mail: clive.oliver@uct.ac.za; Fax: +27 21 6505195; Tel: +27 21 6503830
First published on 3rd September 2015
Abstract
A mixed-ligand 2D MOF based on ZnSO4, trimesate and 4,4′-bipyridine-N,N′-dioxide was synthesized and characterized by variable-temperature X-ray diffraction, thermal analysis and infrared spectroscopy. It is the first crystal structure, let alone coordination polymer, containing both trimesate (or trimesic acid) and 4,4′-bipyridine-N,N′-dioxide. The 2D layers are arranged in a polar fashion with adjacent layers creating isolated cavities. Single crystal structure analyses of the same crystal at different temperatures confirm that dehydration occurs via a single-crystal-to-single-crystal transformation and yield insight into the order of water release upon dehydration. Rehydration of the 2D MOF occurred when exposed to air which was confirmed by thermogravimetric analysis and single crystal X-ray diffraction. Water vapour sorption experiments show a type I isotherm, typical of microporous materials.
Introduction
Metal–organic frameworks (MOFs) have received widespread attention in recent years due to their porosity, yielding potential applications which include gas storage, molecular sensing, catalysis and separations.1–10 Coordination bonds that form between the organic linkers and metal ions, which are used as building blocks to synthesise the MOFs, may lead to discrete coordination complexes or to 1D, 2D or 3D coordination polymers. Mixed-ligand MOFs have two or more different types of organic linkers and have recently been reviewed from the point of view of design, construction, tuning and applications.11–13 Different ligands usually play a different role from a structural and functional point of view and need to either have a near equal probability of ligating to the metal employed or the first bound ligand should have a synergistic effect on the binding of the second.12 The use of mixed ligands may have an advantage over using one type of ligand in that tuning of the pores in one dimension may be effected which may not be the case if only one type of ligand is used.14 Single-crystal-to-single-crystal (SCSC) transformations of MOFs have been recognised as an important solid state phenomenon and have gained a considerable amount of attention since the transformed structure can be determined and therefore may yield insight into the mechanism of transformation.15–17 SCSC transformations may occur as a result of external stimuli such as heat, light or the desorption/sorption of guest molecules in the MOF.18 Variable-temperature single crystal X-ray diffraction (VT-SCXRD) studies of MOFs are relatively rare,19,20 however these may yield insight into desolvation processes when coupled with thermogravimetric analysis (TGA).21 As part of our ongoing investigation into the synthesis of mixed-ligand MOFs, we have produced a novel mixed-ligand, pillared, cadmium metal–organic framework using 1,3,5-benzenetricarboxylic acid (trimesic acid) and 1,2-bis(4-pyridyl)ethane where the trimesate linkers and cadmium ions form a 2D sheet, whilst the 1,2-bis(4-pyridyl)ethane molecules link these 2D sheets into a 3D porous framework.22 This structure was shown to undergo a SCSC transformation upon desolvation and solvation with selected solvents which we postulated occurred via a ‘gate-opening’ mechanism. In order to expand on this study, we have attempted to synthesize a similar MOF by replacing the linker molecule 1,2-bis(4-pyridyl)ethane with 4,4′-bipyridine-N,N-dioxide (4,4′-bpdo) and the cadmium metal with zinc. Trimesic acid is a fairly common linker in MOF synthesis with 4,4′-bpdo used to a lesser extent,23 however we have separately used both molecules to synthesize coordination polymers.24,25 Herein, we report the synthesis and structure, as well as the dehydration and rehydration properties, using VT-SCXRD and TGA, of a novel 2D zinc-containing MOF synthesised using both 1,3,5-benzenetricarboxylic acid (H3BTC) and 4,4-bipyridine-N,N′-dioxide. This combination of organic molecules (or ions thereof) have, to the best of our knowledge,23 not been included in any crystal structure, let alone that of a coordination polymer.Experimental section
Materials and physical measurements
All chemicals were of reagent grade, purchased from commercial sources, and used without further purification.Hot-stage microscopy was performed on a Nikon SMZ-10 stereoscopic microscope fitted with a Linkam THMS600 hot stage and a Linkam TP92 control unit. Samples were placed under silicone oil on a cover slip and heated at 10 °C min−1. Thermal events were monitored with a Sony Digital Hyper HAD colour video camera and captured using the Soft Imaging System program analySIS.
Thermogravimetric analysis (TGA) was performed using a TGA Q500 instrument with a heating rate of 10 °C min−1 in the temperature range 25–350 °C, under a dry nitrogen flow of 60 ml min−1. Approximately 2–5 mg of sample was placed in an open crucible for each analysis.
Differential scanning calorimetry (DSC) was performed using a DSC Q200 instrument with a heating rate of 10 °C min−1 in the temperature range 25–250 °C, under a dry nitrogen flow of 60 ml min−1. Approximately 2–5 mg of sample was placed in aluminium pan with a lid and a sealed and empty pan was used as a reference.
Powder X-ray diffraction (PXRD) measurements were performed on a Bruker D8 Advance X-ray diffractometer in the 4–40° 2θ range using a 0.01° step size per second and X-rays generated at 40 kV and 40 mA.
Fourier-transform infrared (FT-IR) spectroscopy was performed in the range 4000–650 cm−1 on a PerkinElmer Spectrum One FT-IR spectrometer using attenuated total reflectance (ATR).
The water vapour and gas sorption experiments were performed with a Micromeritics 3Flex Surface Area Analyzer. The samples were prepared by using a Micromeritics Flowprep with the flow of nitrogen over the sample for 3 hours whilst heated at 60 °C. Furthermore the sample was heated at 100 °C under vacuum in situ before the analysis commenced. The Brunauer–Emmett–Teller (BET) method was applied on data points between 0.01 and 0.10 P/Po as this was the range where the slope of the Roquerol BET graph remained positive.
Preparation of [Zn3(BTC)(4,4′-bpdo)(OH)(SO4)(H2O)3]n·n(H2O)2.33 (1)
1,3,5-Benzenetricarboxylic acid (20 mg, 0.096 mmol) and 4,4-bipyridine-N,N′-dioxide (18 mg, 0.095 mmol) were dissolved in a solvent mixture of 1 ml of H2O, 3 ml of ethanol (EtOH) and 3 ml of N,N′-dimethylformamide (DMF). In a separate vial, ZnSO4·7H2O (27 mg, 0.094 mmol) was dissolved in 2 ml of H2O. Both solutions were heated while stirring, and the clear solutions were combined in a vial and heated at 90 °C for 24 hours, after which triangular, clear crystals were obtained.Single crystal X-ray diffraction analyses and structure determination
A suitable, single crystal of 1 was mounted on a cryoloop using Paratone N oil. Data collections were carried out on a Bruker DUO APEX II CCD diffractometer using graphite monochromated Mo Kα (λ = 0.71073 Å) using an Oxford Cryostream-700 to control the temperature. Data collections were carried out at 104 K, 298 K, 323 K and 373 K on the same crystal. Data reduction and cell refinement were performed using SAINT-Plus.26 The X-ray diffraction data were corrected for the Lorentz-polarization factor and scaled for absorption effects using SADABS. Structure solution and refinement were performed using the crystallographic suite OLEX2.27 The 104 K structure was solved by direct methods, implemented in SHELXT-97,28 with these atom coordinates used a starting model for the refinement of the higher temperature structures. Refinement proceeded using the full-matrix least-squares method, based on F2 values against all reflections, including anisotropic displacement parameters for all non-H atoms, as implemented in SHELXL-2014/7.28 The apparent space group for the 104 K structure was suggested to be P31 by XPREP,26 however structure solution and subsequent refinement yielded a best R-factor of ~20%. Visual investigation of the reciprocal lattice layers using LAYER29 revealed a significant proportion of additional systematic absences for the apparent space group P31 and, in fact, appeared to suggest a rhombohedral lattice centring. However, a significant proportion of systematic absence violations (~23%) were observed if rhombohedral centring was forced. Nevertheless, the structure was solved in R3 and was refined to ~7% with high peaks appearing close the metal centres and with Fo ≫ Fc for reflections with l = 3n. The latter observation together with the unusual diffraction pattern seemed to be consistent with a case of obverse/reverse twinning.30 The TwinRotMat routine in PLATON31 suggested the twin law [0 −1 0 −1 0 0 0 0 −1] with a twin fraction estimation of 0.15. Subsequent refinement applying this twin law yielded an R-factor of ~4%, a twin fraction of 0.184(3), and the absence of a high density close to the metal centres. The same space group and twin law was selected for the higher temperature structures with the refined twin fractions being in close agreement (Table 1).| 104 K | 298 K | 323 K | 373 K | |
|---|---|---|---|---|
| Empirical formula | C57H60N6O55S3Zn9 | C57H54N6O52.21S3Zn9 | C57H54N6O48.96S3Zn9 | C57H42N6O42S3Zn9 |
| Formula weight | 2393.62 | 2326.82 | 2290.93 | 2167.47 |
| Temperature/K | 104 | 298 | 323 | 373 |
| Crystal system | Trigonal | Trigonal | Trigonal | Trigonal |
| Space group | R3 | R3 | R3 | R3 |
| a/Å, α/° | 18.816(4), 90 | 18.798(19), 90 | 18.795(18), 90 | 18.889(19), 90 |
| b/Å, β/° | 18.816(4), 90 | 18.798(19), 90 | 18.795(18), 90 | 18.889(19), 90 |
| c/Å, γ/° | 21.441(5), 120 | 21.57(2), 120 | 21.47(2), 120 | 21.67(2), 120 |
| Volume/Å3 | 6574(3) | 6602(15) | 6568(14) | 6695(15) |
| Z | 3 | 3 | 3 | 3 |
| ρ calc/g cm−3 | 1.814 | 1.756 | 1.738 | 1.613 |
| μ/mm−1 | 2.598 | 2.581 | 2.591 | 2.532 |
| F(000) | 3606 | 3497 | 3443 | 3240.0 |
| Crystal size/mm3 | 0.475 × 0.344 × 0.317 | 0.475 × 0.344 × 0.317 | 0.475 × 0.344 × 0.317 | 0.475 × 0.344 × 0.317 |
| Wavelength/Å | 0.71073 | 0.71073 | 0.71073 | 0.71073 |
| 2θ range for data collection/° | 4.33 to 61.336 | 4.334 to 61.748 | 3.14 to 61.81 | 3.12 to 60.796 |
| Index ranges | −25 ≤ h ≤ 25, −26 ≤ k ≤ 19, −29 ≤ l ≤ 30 | −25 ≤ h ≤ 26, −26 ≤ k ≤ 20, −29 ≤ l ≤ 31 | −25 ≤ h ≤ 26, −26 ≤ k ≤ 21, −29 ≤ l ≤ 31 | −22 ≤ h ≤ 26, −24 ≤ k ≤ 25, −29 ≤ l ≤ 30 |
| Reflections collected | 19![[thin space (1/6-em)]](https://www.rsc.org/images/entities/char_2009.gif) 838 838 |
20095 |
20037 |
13265 |
| Independent reflections | 7900 [Rint = 0.0233, Rsigma = 0.0529] | 7886 [Rint = 0.0301, Rsigma = 0.0681] | 7879 [Rint = 0.0383, Rsigma = 0.0661] | 7012 [Rint = 0.0476, Rsigma = 0.1026] |
| Data/restraints/parameters | 7900/2/408 | 7886/1/390 | 7879/1/378 | 7012/1/354 |
| Goodness-of-fit on F2 | 1.071 | 1.081 | 1.066 | 1.024 |
| Final R indexes [I ≥ 2σ (I)] | R 1 = 0.0383, wR2 = 0.1085 | R 1 = 0.0519, wR2 = 0.1465 | R 1 = 0.0482, wR2 = 0.1347 | R 1 = 0.0508, wR2 = 0.1377 |
| Final R indexes [all data] | R 1 = 0.0394, wR2 = 0.1090 | R 1 = 0.0608, wR2 = 0.1524 | R 1 = 0.0539, wR2 = 0.1372 | R 1 = 0.0635, wR2 = 0.1473 |
| Largest diff. peak/hole/e Å−3 | 2.49/−0.69 | 1.22/−0.67 | 1.00/−0.89 | 0.97/−0.51 |
| Flack parameter | 0.001(5) | 0.057(6) | 0.016(7) | −0.002(11) |
| Refined minor twin component fraction | 0.180(2) | 0.186(1) | 0.185(3) | 0.188(1) |
CCDC 1405005–1405008 and 1405387–1405388 contains the supplementary crystallographic data for this paper.
Results and discussion
Compound 1 was prepared at 90 °C by combining solutions of ZnSO4·7H2O, trimesic acid and 4,4-bipyridine-N,N′-dioxide (Scheme 1). Crystallographic data are listed in Table 1 for the four different temperatures of collection on the same crystal of 1 with the 104 K temperature structure described next.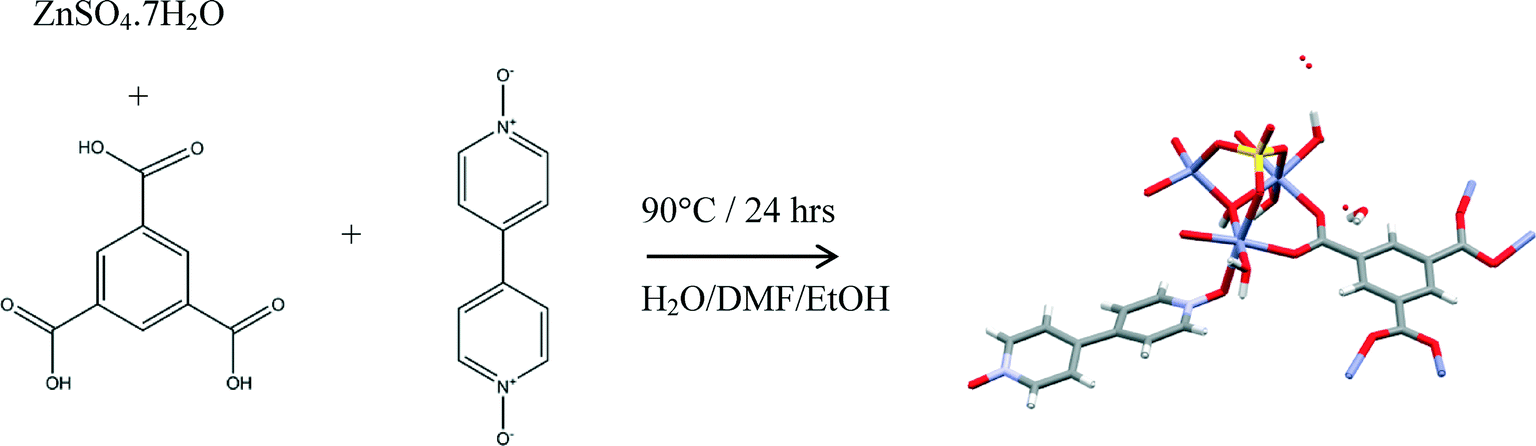 | ||
| Scheme 1 Preparation of 1. | ||
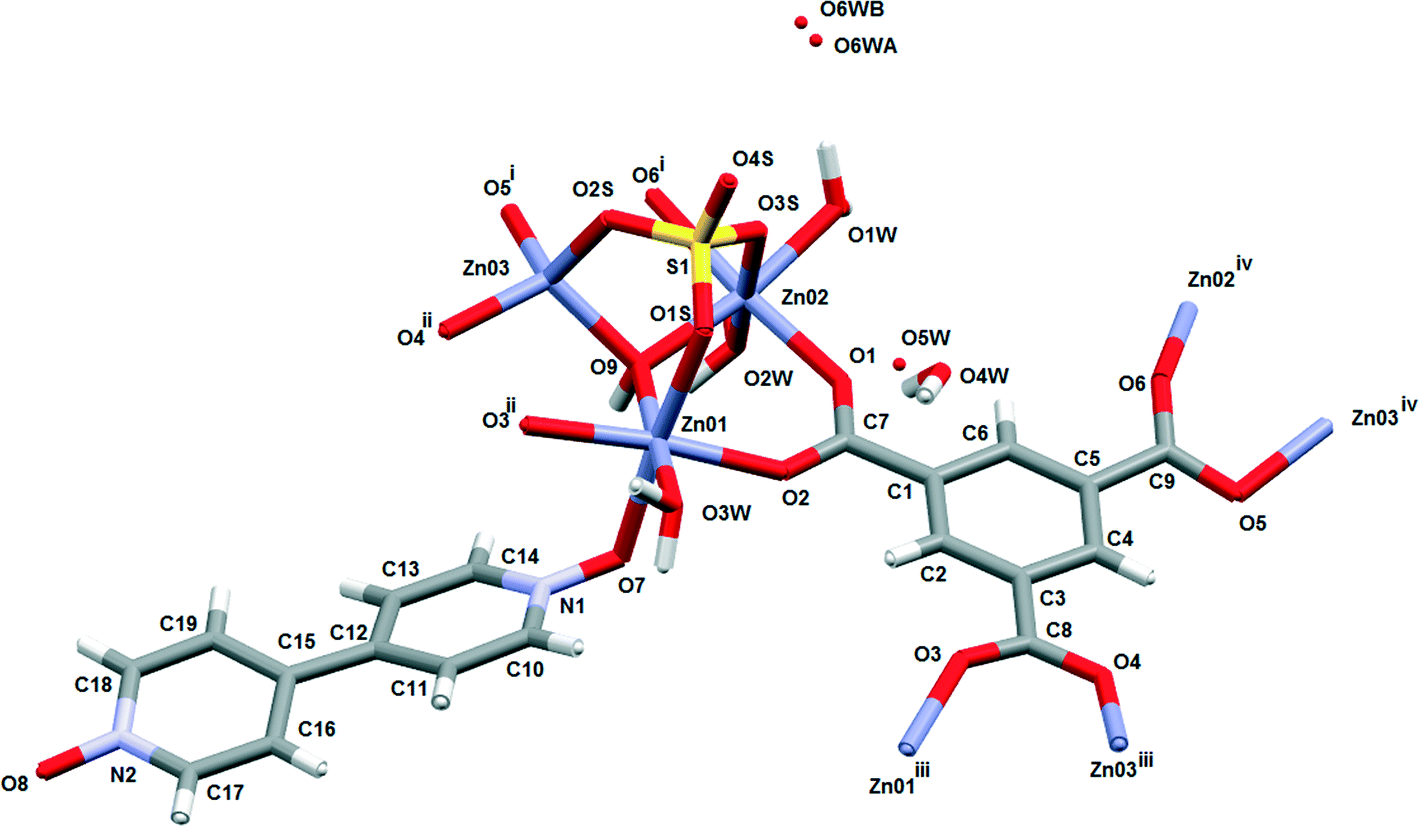
The asymmetric unit (Fig. 1) consists of three Zn(II) cations, one fully deprotonated, bridging trimesate ligand, one 4,4′-bipyridine-N,N′-dioxide molecule, one bridging sulfate anion, a bridging hydroxide group and 5.33 water molecules. Water molecules O1W, O2W and O3W are coordinated to the zinc ions, whilst O4W, O5W and O6W are uncoordinated. Water molecule O5W resides on a 3-fold rotation axis and thus has a site occupancy factor (sof) of 1/3, whilst O6W is disordered over two positions labelled as O6WA and O6WB with sofs of 0.69 and 0.31, respectively. Zn01 has an octahedral coordination geometry and is ligated to the O2 and O3ii atoms of two different trimesate ligands, the O7 atom of the 4,4′-bpdo ligand, the O9 atom of the hydroxide ligand, the O1S atom of the sulfate ligand and to the O3W atom of a water molecule. Zn02 also has octahedral coordination geometry and is ligated to the O1 and O6i atoms of two different trimesate ligands, the O9 atom of the hydroxide ligand, the O3S atom of the sulfate ligand, and to the O1W and O2W atoms of two different water molecules. Zn03 has a tetrahedral coordination environment and is ligated to the O9 atom of the hydroxide ion, the O2S atom of the sulfate ion and to the O4ii and O5i atoms of two different trimesate ligands. The charges on the three Zn(II) ions add up to 6+ which is counter-balanced by the 3− charge of the fully deprotonated trimesate ligand, the 2− charge of the sulfate anion and the 1− charge of the hydroxide ion. The Zn01–O distances range from 2.037(4)–2.158(4) Å, the Zn02–O distances from 2.056(5)–2.179(5) Å, whilst the Zn3–O distances range from 1.939(5)–1.990(5) Å (Table S2†). The three unique Zn(II) atoms form a triangular arrangement and are bridged to each other via the O atom of the single hydroxide ligand, the two O atoms of three carboxylate groups from different trimesate ligands and three O atoms of the single sulfate ion, to form the secondary building unit [Zn3(COO−)3OH−SO42−]. Although three metal centres capped by a single sulfate anion and linked by a hydroxide ion has been observed in a number of structures, whilst three metals bridged by carboxylate groups have been observed in other structures, a motif where three metal centres are linked by three carboxylate groups, a hydroxide ion and a capping sulfate ion, as observed in our structure, has not yet been reported.23 The three carboxylate groups of the trimesate ligand determine the extension of the resulting 2D network in the ab-plane, which, if the centroids of the three unique zinc ions and the trimesate ligand are taken as nodes, form a honeycomb uninodal net of type 3c (Fig. 2a and b). The Zn-trimesate 2D layers that form are capped on opposite sides by sulfate and 4,4′-bpdo ligands (Fig. 2c), respectively. The 4,4′-bpdo ligands are arranged in groups of three, extending at an angle of ~21° from the Zn-trimesate layer and forming a flat bowl-shaped structure (Fig. 2d). The 2D layers stack along the c-direction (Fig. 3a) with all layers relative to each other having their 4,4′-bpdo and sulfate ligands on the same side, illustrating the polar arrangement of the crystal structure as required by the polar space group R3. The 2D layers are hydrogen bonded to each other (Fig. 3b) via a hydroxide ion and coordinated water molecule hydrogen bond to a sulfate ion (O9–H9⋯O4S and O2W–2WB⋯O4S), forming a hydrogen-bonded ring motif with graph set notation R12(6), as well as via a coordinated water molecule hydrogen bond to a 4,4′-bpdo ligand (O3W–H3WB⋯O8) which due to the 3-fold rotation axis forms a hydrogen-bonded ring motif of graph set notation R33(12).
 | ||
| Fig. 1 Basic chemical unit of the 104 K structure of 1 showing the coordination environment of the 3 unique Zn(II) ions. i1 + y − x, 1 − x, z, ii1 − y, 1 + x − y, z, iiiy − x, 1 − x, z, iv1 − y, x − y, z. | ||
 | ||
| Fig. 2 (a) Top view of the 2D layer (b) honeycomb motif taking the nodes at the centres of the metal cluster (in blue) and the trimesate ligand (yellow), respectively (c) side view of 2D layer showing the sulfate groups on one side of the layer and the 4,4′-bpdo molecules on the other and (d) oblique view of the 2D layer showing the ‘flat’ bowl formed by three trigonally arranged 4,4′-bpdo molecules. | ||
 | ||
| Fig. 3 (a) View down the a-axis, (b) hydrogen-bonding between two adjacent 2D layers. | ||
Variable temperature single crystal and powder X-ray diffraction studies
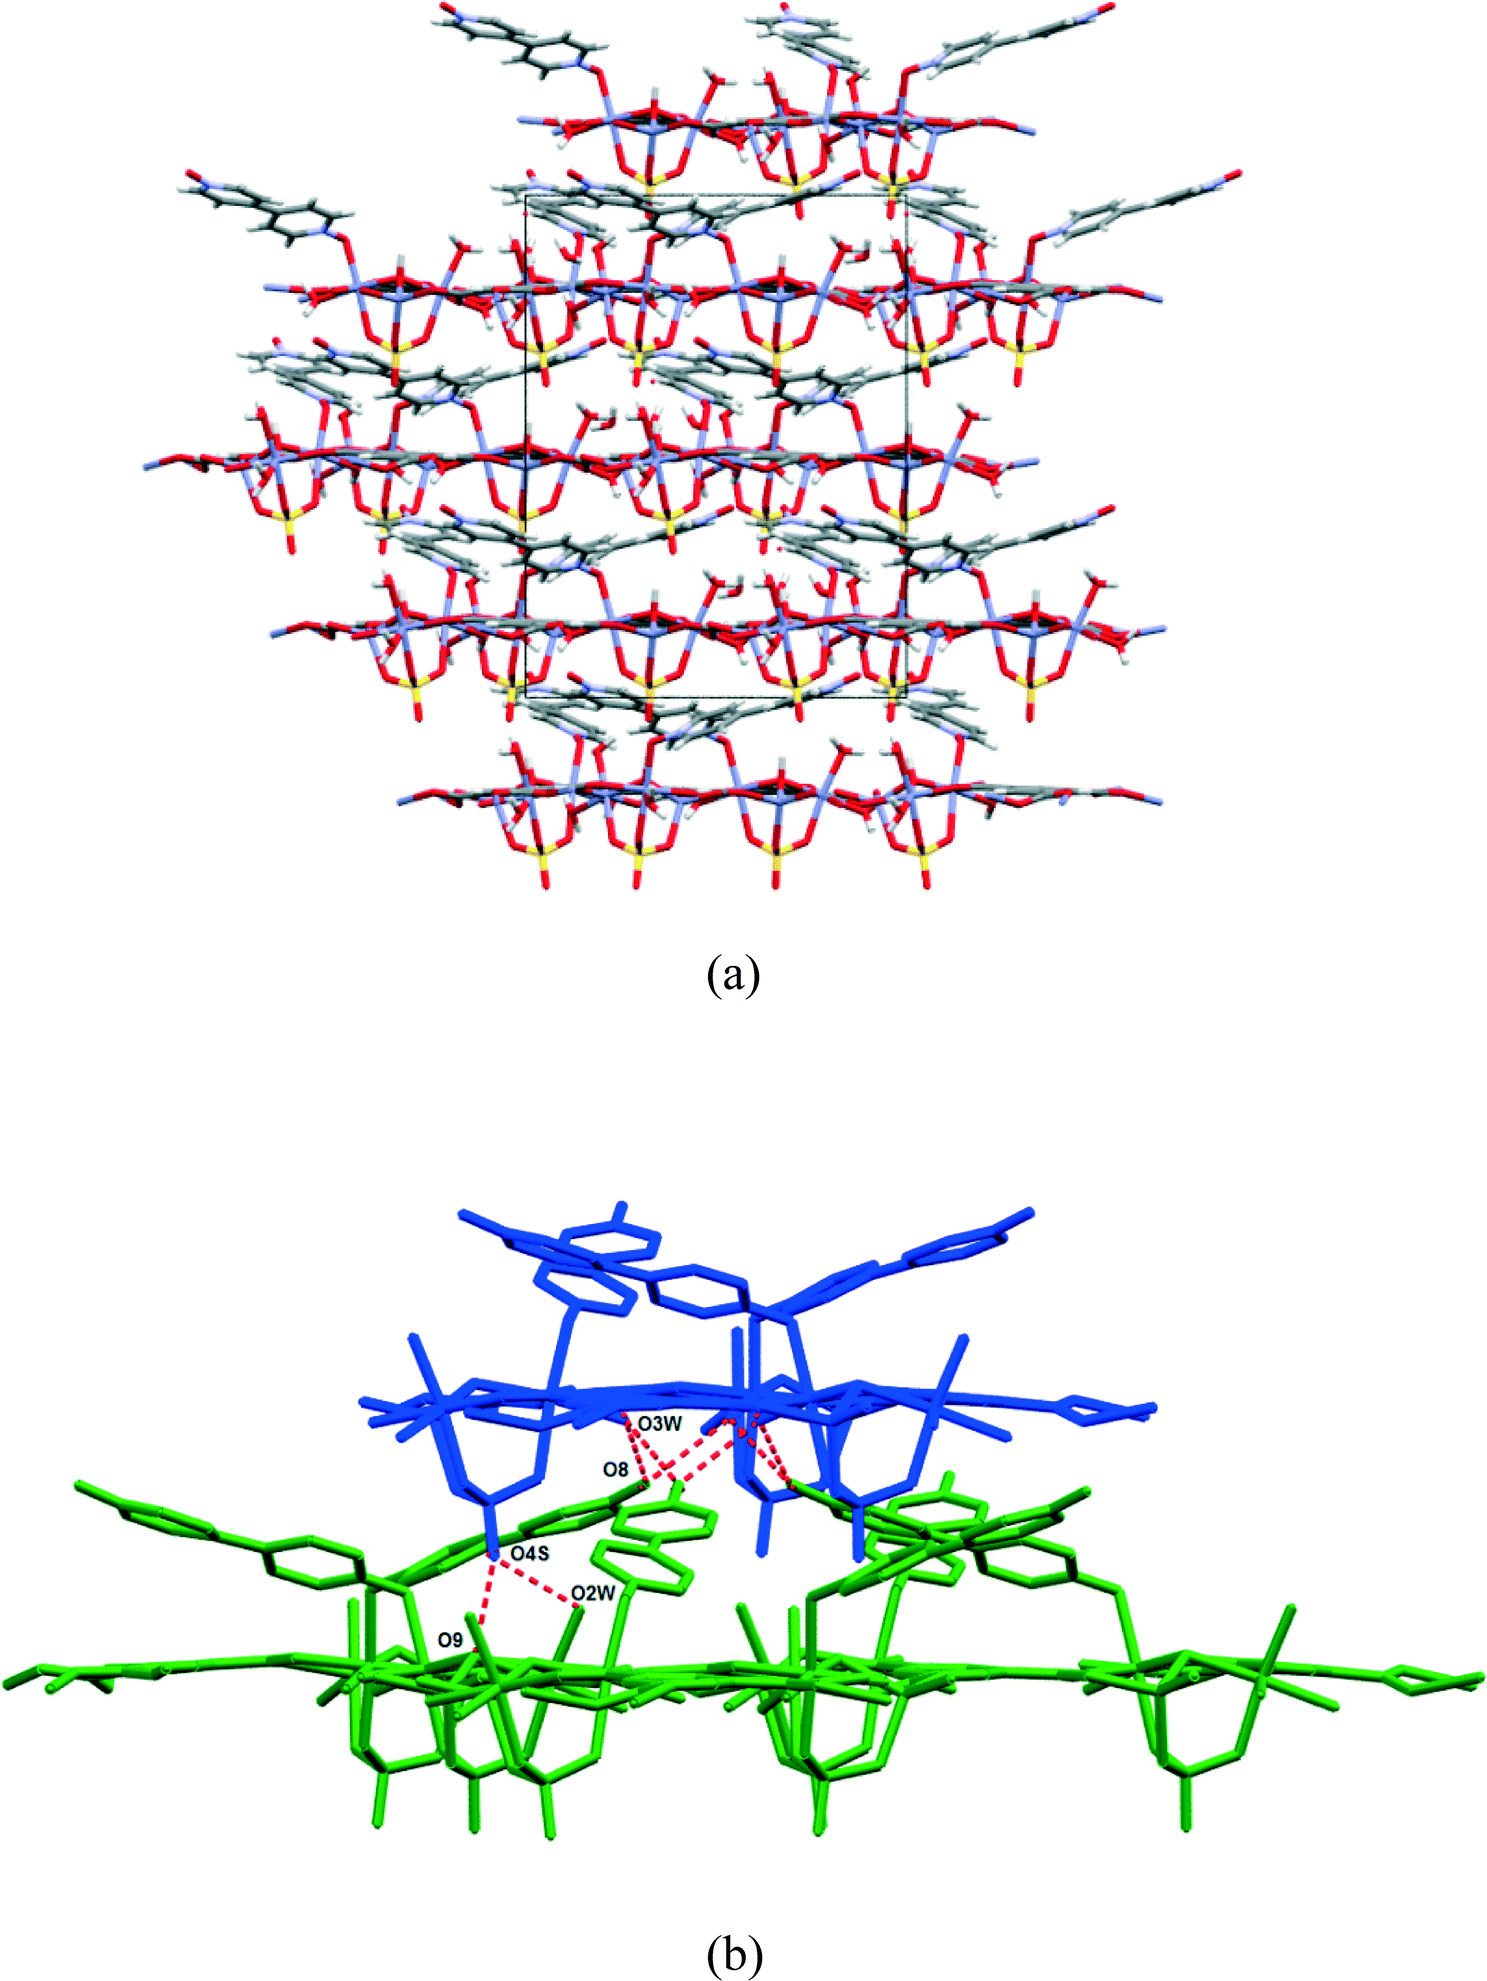
Consecutive data collections were performed on the same crystal at 104 K, 298 K, 323 K and 373 K for which the crystal data are presented in Table 1. The asymmetric units of the higher temperature structures show subtle differences to that of the 104 K structure, the main differences being due to successive dehydration of the crystals as the temperature is increased. In the 104 K structure six water molecules were modelled, three coordinated and 2.33 uncoordinated water molecules. In the 298 K structure electron density peaks appeared for the O5W and O6W water molecules, however these could not be refined successfully due to high isotropic temperature factors, which was probably due to these sites not being fully occupied. Thus the sofs of the uncoordinated water molecules were refined freely with O4W, O5W and O6W refining to final values of 0.93, 0.13, and 0.34. In the 323 K structure, O4W was the only remaining uncoordinated water molecule and its sof value refined to 0.32, whilst in the 373 K structure O6W, O5W, O4W as well as the coordinated O1W and O2W water molecules were absent from the structure. The loss of the O1W and O2W water molecules in the 373 K structure results in the change of coordination geometry around Zn02 from octahedral to tetrahedral with a concomitant shortening of the Zn02⋯Zn03 distance from 3.215(1) Å in the 104 K structure to 3.137(4) Å in the 373 K structure (bond lengths are in Table S2†). In addition, the hydroxide O9 atom is also closer to Zn02 ion in the 373 K vs. 104 K structure (1.989(6) vs. 2.079(4) Å). Overlays of the corresponding atoms of the asymmetric unit atoms of the higher temperature structures with those of the 104 K structure are shown in Fig. 4(a). These show a near exact match yielding root-mean-square deviations of 0.0474 Å, 0.0645 Å and 0.156 Å for the 298 K, 323 K and 373 K overlays with the 104 K structure, respectively. This indicates an increased difference with increasing temperature difference as the structure becomes more dehydrated. Fig. 4(b) shows the overlay of the crystal packing of the 104 K (in blue) and the 373 K (in red) structures. The overlay shows that the crystal packing in the two structures are virtually identical, despite the absence of the water molecules in the 373 K structure, which are present in the 104 K structure (shown as blue spheres). It appears from Fig. 4(b) that the water channels are continuous, however plots of the void space (shown for the 373 K structure in Fig. 4(c)) for all four structures show that isolated cavities are present. Even if the last remaining coordinated water molecule (O3W) water molecule is artificially removed in the 373 K structure the cavities are still isolated. This indicates that cooperative changes have to occur when the water molecules evacuate the structure in order to preserve the monocrystallinity. However, due to their close similarity it was not clear from the low and high temperatures structures how these changes occur, perhaps suggesting that the dynamic changes are transient in that the ‘before’ and ‘after’ structural conformations are the same because they are energetically preferred. The void space per unit cell volume (as calculated by Mercury with a 1.2 Å probe radius) for 1 at all four temperatures is 8.0% (175.5 Å3 per cavity), 10.8% (238.0 Å3 per cavity), 14.2% (311.4 Å3 per cavity) and 24.6% (549.5 Å3 per cavity) for the 104 K, 298 K, 323 K and 373 K structures, respectively. | ||
| Fig. 4 (a) Overlay of the 104 K (blue), 298 K (yellow), 323 K (green) and 373 K (red) asymmetric units as displayed by Mercury. (b) Overlay of the packing of the 104 K (blue) and 373 K structures (red) (water molecules present in the 104 K structure but not present in the 373 K structure are shown as blue spheres) and (c) oblique angle of the crystal packing in the 373 K structure showing isolated voids. | ||
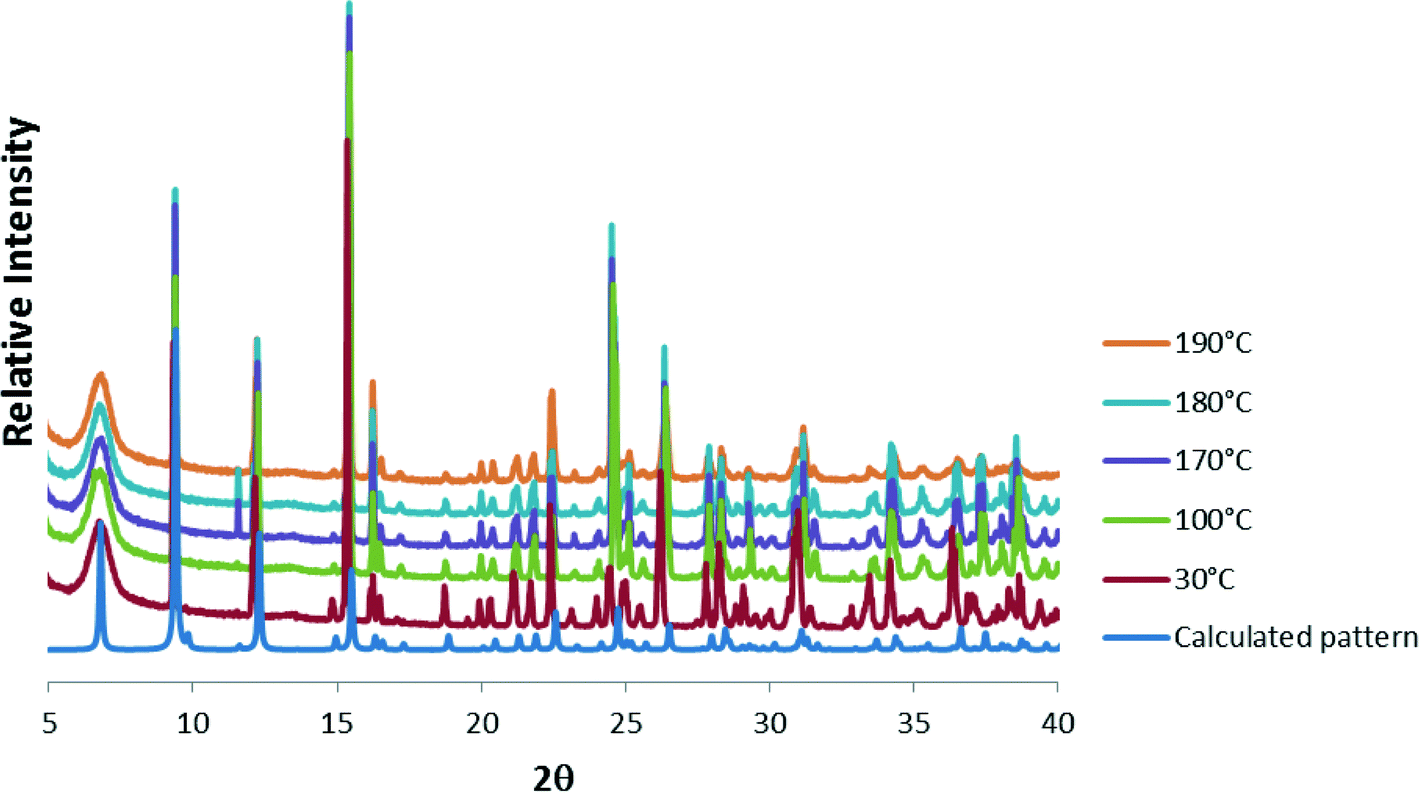 | ||
| Fig. 5 PXRD patterns in the range 30–190 °C compared with the calculated pattern of 1 at 298 K. | ||
Powder X-ray diffraction (PXRD) was used to check that the single crystal structure of 1 at 298 K was representative of the bulk material by comparison with the 30 °C PXRD pattern, whilst higher-temperature PXRD patterns were recorded in order to ascertain whether the crystallinity of the bulk material was maintained upon removal of the solvent when heated. The calculated and 30 °C PXRD patterns agree closely indicating that the bulk material is a close match with the single crystal structure. Peaks at 11.6, 19.5 and 20.0° 2θ are slightly more pronounced in the experimental PXRDs and these are attributed to slight preferred orientation effects. Nevertheless, upon heating the sample, the PXRD patterns remain virtually the same up to 190 °C, after which crystallinity is lost.
Thermal analysis and dehydration/rehydration studies
HSM (Fig. 6) shows a visual indication of the loss of water vapour as bubbles are formed in the silicone oil when crystals of 1 are heated in the range 25–300 °C. The first sign of water loss appears at 92 °C and continues up to 175 °C. During this period, despite some minor cracks, the crystals are largely intact, especially in the case of the smaller crystals. This affords a visual indication that the dehydration process is a SCSC transformation as loss of crystallinity is usually associated with crystals turning opaque. At 250 °C the crystals start turning brown, indicating the onset of decomposition which is well underway by 284 °C.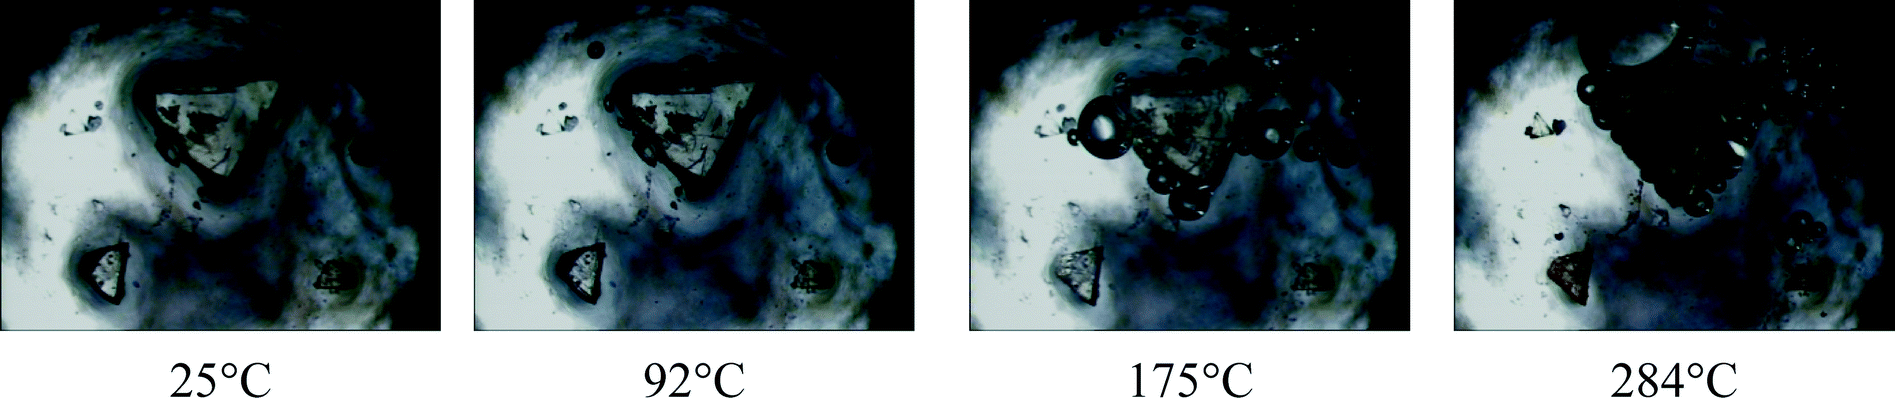 | ||
| Fig. 6 Hot stage microscope photographs of compound 1 under silicone oil at various temperatures (bubbles indicate the release of solvent). | ||
The TGA thermogram of the as-synthesized MOF showed shows a two-step mass loss (Fig. S1†). Based on the asymmetric unit, the first mass loss of 9.81% (30–150 °C) accounts for 4.25 water molecules which probably corresponds to the 2.33 uncoordinated water molecules (O4W, O5W and O6W) and two coordinated water molecules (O1W and O2W). The second mass loss of 2.57% (150–220 °C) accounts for 1.03 water molecules and corresponds to the loss of the last remaining coordinated water molecule O3W which according to single crystal structure analysis is still present at 373 K. The structure of 1 at this temperature together with the single crystal structure determinations at 104 K, 298 K and 323 K, although not within the same temperature limits as the TG analysis, suggests that the order of water release for the modelled water molecules is O6W/O5W, O4W, O1W/O2W and O3W when subjected to TGA. DSC analysis shows two broad endotherms in the ranges 50–150 °C and 150–220 °C which corresponds to the mass losses from TG analyses attributed to water loss (Fig. S1†).
Fig. 7 shows the results of a separate experiment where a few crystals of 1 was subjected to TGA in the range 30–190 °C, cooled and then immediately reheated to 190 °C. This was followed by placing the sample in an open vial which was placed within a larger capped vial containing water. After one day, TGA performed on the sample showed an 11.2% mass loss which was greater than the original mass loss indicating that more water was absorbed than obtained from crystallization.
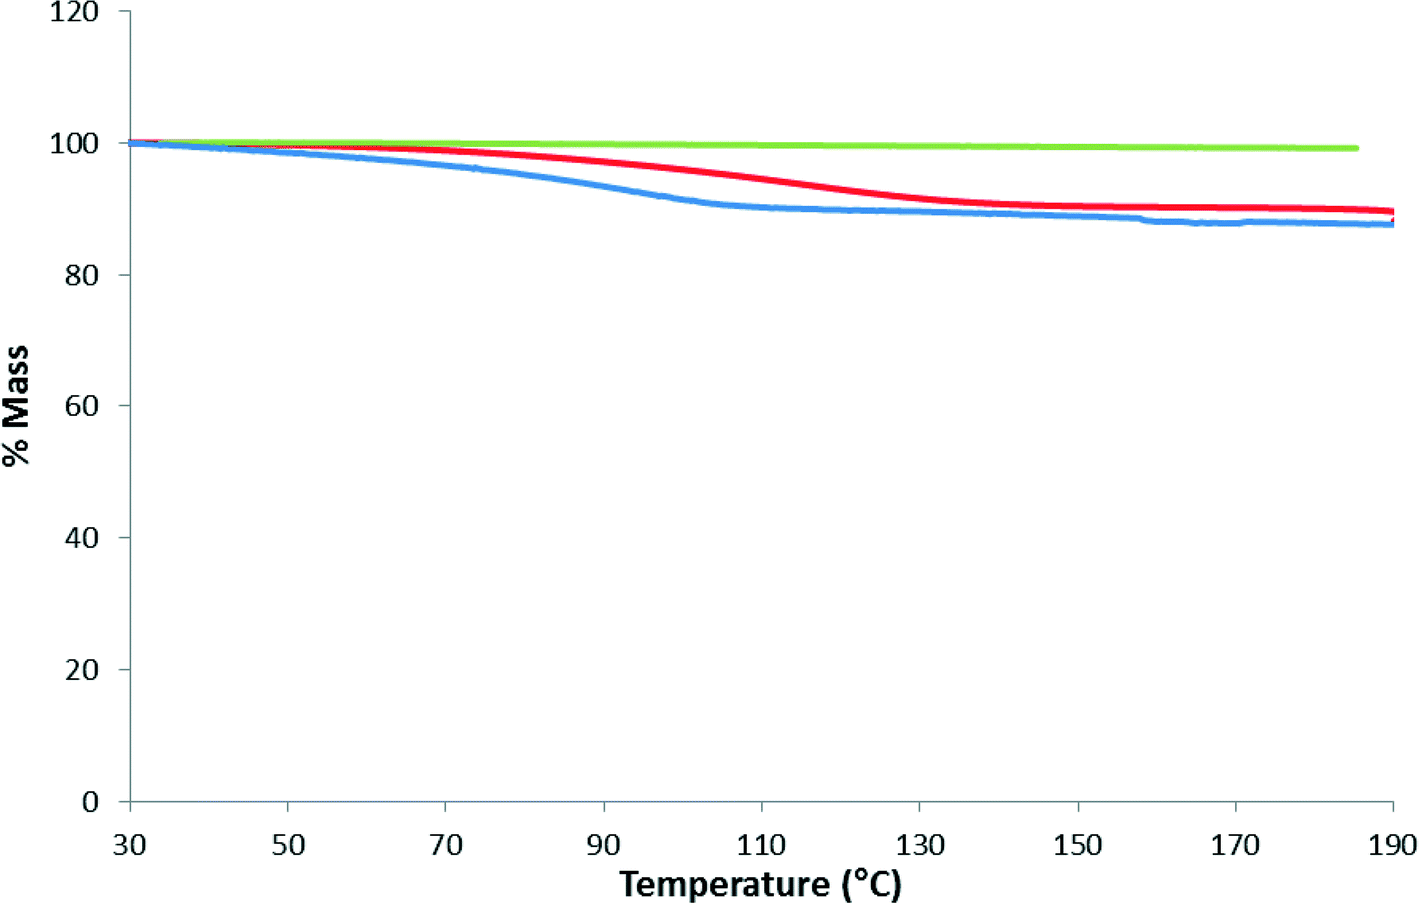 | ||
| Fig. 7 TGA thermograms of 1 for the as-synthesized MOF (red), the immediate reheat (green) and after 24 hours of being exposed to a humid atmosphere (blue). | ||
In another separate experiment, a second single crystal of 1 was subjected to VT-SCXRD with the first structure determined at 373 K. This was to confirm the absence of the uncoordinated water molecules (O4W, O5W and O6W) and coordinated water molecules (O1W and O2W) as well as the concomitant shortening of the Zn02⋯Zn03 distance. Subsequently, the same crystal was cooled to 298 K with the immediately determined crystal structure at this temperature being virtually the same as the 373 K structure (Fig. 8(a)). This crystal was then left on the diffractometer for 24 hours at room temperature (without the flow of dry air over the crystal). The re-determined crystal structure at 298 K showed that two water molecules (O1W and O2W) was reabsorbed from the atmosphere and coordinated to the Zn02 with the concomitant increase in the Zn02⋯Zn03 distance (Fig. 8). In addition, the uncoordinated water molecules O4W, O5W and O6W were partially reabsorbed with their sofs refining to 0.40, 0.27 and 0.31, respectively. This proves that SCSC dehydration behaviour of 1 is reversible. Examples are rare where the loss of coordinated water molecules in MOFs is reversible.20,32 Sun et al. suggested that that the loss of coordinated and uncoordinated water molecules in their cobalt 3D MOF was made possible due to the existence of open channels.32 In our structure the lack of open channels does not seem to prevent this reversible loss. Interestingly, the crystals that were subjected to the TGA up to 190 °C lost their monocrystallinity (by visual inspection), indicating that the presence of O3W is important for the dehydration of 1 to be a SCSC process. However, the PXRD pattern at 190 °C confirmed that the crystallinity of the bulk material is retained at this temperature (Fig. 5). Attempted exchange of the water (uncoordinated or coordinated) in 1 with organic solvents such as methanol, chloroform, 1,4-dioxane and tetrahydrofuran were unsuccessful, reaffirming the strong affinity of compound 1 for water.
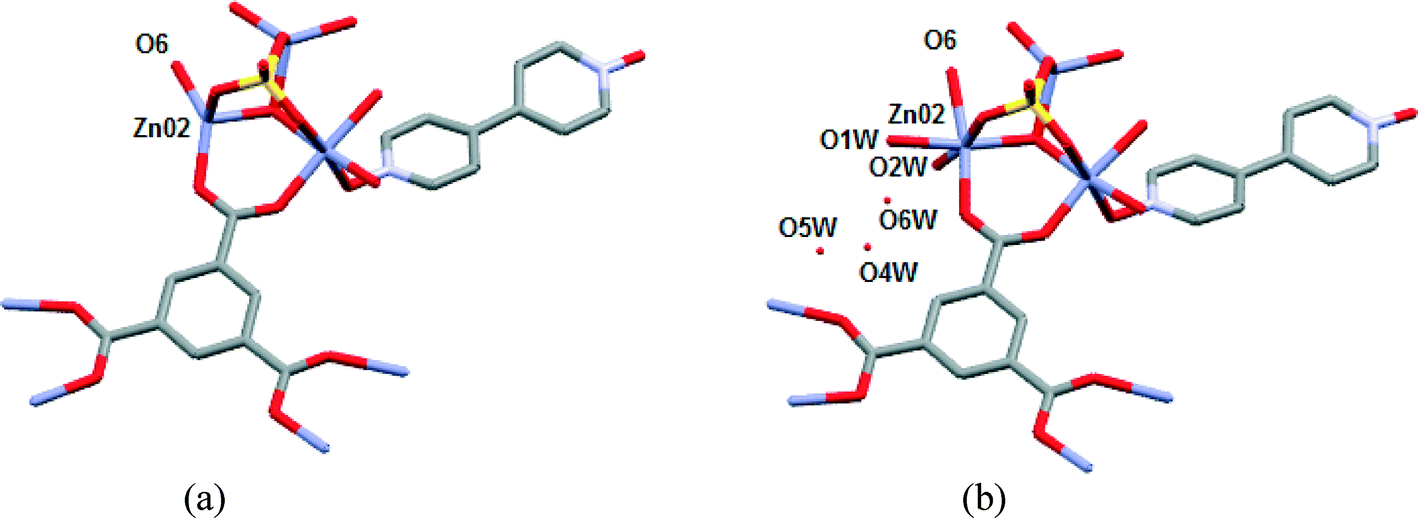 | ||
| Fig. 8 (a) Structure of 1 after a single crystal was heated to 373 K and cooled to 298 K. (b) Subsequent structure of 1 after the single crystal was left on diffractometer for 24 hours without the flow of dry air over the crystal. | ||
Water vapour sorption of 1 (Fig. 9) show that it readily adsorbs water vapour at low relative pressures and displays the typical Type I isotherm associated with microporous materials. The total water absorbed at a relative pressure P/P0 of 0.81 was 195.5 cm3 (STP) g−1. The BET surface area was calculated to be 477(6) m2 g−1, whilst negligible hysteresis was observed with the desorption isotherm. Nitrogen and carbon dioxide (not shown) sorption isotherms show a low sorption of 2.7 cm3 (STP) g−1 cm3 and 1.1 cm3 (STP) g−1, respectively.
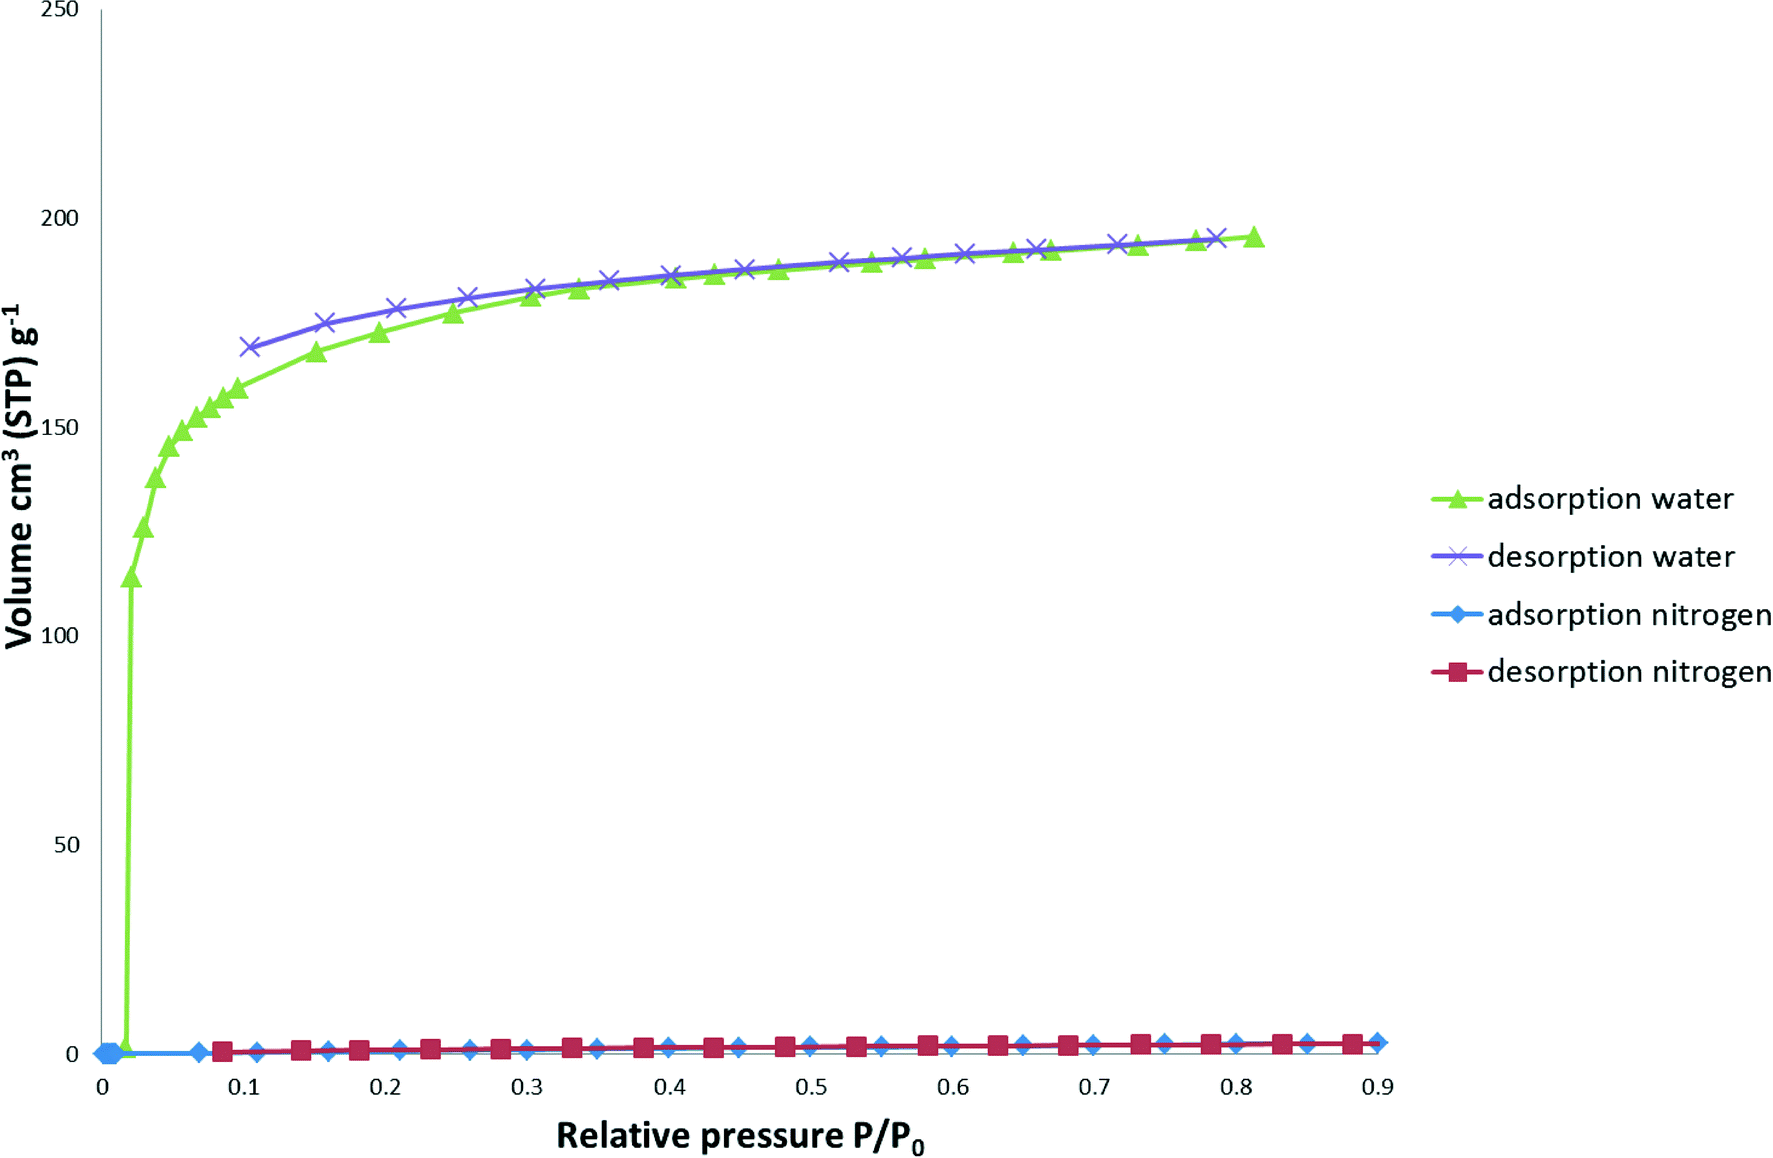 | ||
| Fig. 9 Water vapour and nitrogen gas adsorption and desorption isotherms of 1. | ||
FT-IR
Infrared spectroscopy data (Fig. S3†) confirm that trimesate is coordinated to zinc(II) by virtue of the presence of the asymmetric stretching vibrational mode, νasym(–COO−), appearing at 1622 cm−1 in the IR spectrum of 1 (1690 cm−1 in the free ligand). The peak associated with the symmetric stretching vibrational mode, νs(–COO−), appears at 1473 cm−1 with the value of Δ(νas(–COO−) − νs(–COO−)) being 149 cm−1. This is consistent with a carboxylate group binding to two zinc atoms in a bridging bidentate mode.33 The absence of a shoulder on the peak at 1622 cm−1 also (thus indicating the absence of a hydroxyl hydrogen atom) supports full deprotonation of the carboxylic acid groups.34 The peak at 1220 cm−1 represents the 4,4′-bpdo N–O coordination bond to zinc(II),33 whilst the broad peak at ~3260 cm−1 indicates the presence of hydrogen-bonded lattice water molecules.Conclusion
In conclusion, a new 2D MOF has been synthesized based on ZnSO4, trimesic acid and 4,4′-bypyridine-N,N′-dioxide where the 2D layers are arranged in a polar fashion. Single crystal structure analysis at successive temperatures of 104 K, 298 K, 323 K and 373 K on the same crystal, firstly confirms that this is a SCSC transformation and also indicates the probable order of water release when the as-synthesized compound is subjected to TG analysis. The dehydration occurs despite the lack of clear channels indicating that cooperative structural changes occur for water to be evacuated from the structure. It was ascertained that the dehydration process is reversible and that it occurs via a SCSC process, provided that the last coordinated water molecule is retained. The water vapour sorption/desorption isotherms of the activated MOF shows a typical Type I isotherm associated with microporous materials and also shows its high affinity for water.Acknowledgements
T. T. and C. L. O. thanks the South African National Research Foundation and the University of Cape Town for financial support.References
- M. Eddaoudi, H. L. Li and O. M. Yaghi, J. Am. Chem. Soc., 2000, 122, 1391–1397, DOI:10.1021/ja9933386.
- D. M. D'Alessandro, B. Smit and J. R. Long, Angew. Chem., Int. Ed., 2010, 49, 6058–6082, DOI:10.1002/anie.201000431.
- O. K. Farha, A. M. Spokoyny, B. G. Hauser, Y. Bae, S. E. Brown, R. Q. Snurr, C. A. Mirkin and J. T. Hupp, Chem. Mater., 2009, 21, 3033–3035, DOI:10.1021/cm901280w.
- H. Furukawa, N. Ko, Y. B. Go, N. Aratani, S. B. Choi, E. Choi, A. O. Yazaydin, R. Q. Snurr, M. O'Keeffe, J. Kim and O. M. Yaghi, Science, 2010, 329, 424–428, DOI:10.1126/science.1192160.
- M. Hirscher, Angew. Chem., Int. Ed., 2011, 50, 581–582, DOI:10.1002/anie.201006913.
- J. Li, R. J. Kuppler and H. Zhou, Chem. Soc. Rev., 2009, 38, 1477–1504, 10.1039/b802426j.
- X. Lin, I. Telepeni, A. J. Blake, A. Dailly, C. M. Brown, J. M. Simmons, M. Zoppi, G. S. Walker, K. M. Thomas, T. J. Mays, P. Hubberstey, N. R. Champness and M. Schroeder, J. Am. Chem. Soc., 2009, 131, 2159–2171, DOI:10.1021/ja806624j.
- S. Ma and H. Zhou, Chem. Commun., 2010, 46, 44–53, 10.1039/b916295j.
- L. J. Murray, M. Dinca and J. R. Long, Chem. Soc. Rev., 2009, 38, 1294–1314, 10.1039/b802256a.
- J. Sculley, D. Yuan and H. Zhou, Energy Environ. Sci., 2011, 4, 2721–2735, 10.1039/c1ee01240a.
- M. Du, C. Li, C. Liu and S. Fang, Coord. Chem. Rev., 2013, 257, 1282–1305, DOI:10.1016/j.ccr.2012.10.002.
- Z. Yin, Y. Zhou, M. Zeng and M. Kurmoo, Dalton Trans., 2015, 44, 5258–5275, 10.1039/c4dt04030a.
- M. Du, X. Jiang and X. Zhao, Inorg. Chem., 2007, 46, 3984–3995, DOI:10.1021/ic062098+.
- B. Q. Ma, K. L. Mulfort and J. T. Hupp, Inorg. Chem., 2005, 44, 4912–4914, DOI:10.1021/ic050452i.
- L. J. Barbour, Aust. J. Chem., 2006, 59, 595–596, DOI:10.1071/CH06355.
- J. P. Zhang, P. Q. Liao, H. L. Zhou, R. B. Lin and X. M. Chen, Chem. Soc. Rev., 2014, 43, 5789–5814, 10.1039/c4cs00129j.
- S. Furukawa, Y. Sakata and S. Kitagawa, Chem. Lett., 2013, 42, 570–576, DOI:10.1246/cl.130357.
- M. K. Sharma and P. K. Bharadwaj, Inorg. Chem., 2011, 50, 1889–1897, DOI:10.1021/ic102305v.
- P. K. Allan, B. Xiao, S. J. Teat, J. W. Knight and R. E. Morris, J. Am. Chem. Soc., 2010, 132, 3605–3611, DOI:10.1021/ja910600b.
- D. Sarma and S. Natarajan, Cryst. Growth Des., 2011, 11, 5415–5423, DOI:10.1021/cg201003d.
- G. Halder and C. Kepert, J. Am. Chem. Soc., 2005, 127, 7891–7900, DOI:10.1021/ja042420k.
- A. Husain, M. Ellwart, S. A. Bourne, L. Ohrstrom and C. L. Oliver, Cryst. Growth Des., 2013, 13, 1526–1534, DOI:10.1021/cg301760a.
- F. Allen, Acta Crystallogr., Sect. B: Struct. Sci., 2002, 58, 380–388, DOI:10.1107/S0108768102003890.
- K. Davies, S. A. Bourne, L. Ohrstrom and C. L. Oliver, Dalton Trans., 2010, 39, 2869–2874, 10.1039/b922690g.
- A. Husain and C. L. Oliver, CrystEngComm, 2015, 17, 3023–3030, 10.1039/c5ce00153f.
- Bruker(2007), Bruker AXS Inc., Madison, Wisconsin USA, 1, 2007.
- O. V. Dolomanov, L. J. Bourhis, R. J. Gildea, J. A. K. Howard and H. Puschmann, J. Appl. Crystallogr., 2009, 42, 339–341 CrossRef CAS.
- G. M. Sheldrick, Acta Crystallogr., Sect. A: Found. Crystallogr., 2008, 64, 112–122, DOI:10.1107/S0108767307043930.
- L. J. Barbour, J. Appl. Crystallogr., 1999, 32, 351–352, DOI:10.1107/S0021889898012667.
- R. Herbst-Irmer and G. M. Sheldrick, Acta Crystallogr., Sect. B: Struct. Sci., 2002, 58, 477–481, DOI:10.1107/S0108768102001039.
- A. L. Spek, Acta Crystallogr., Sect. D: Biol. Crystallogr., 2009, 65, 148–155, DOI:10.1107/S090744490804362X.
- Z. Su, M. Chen, T. Okamura, M. Chen, S. Chen and W. Sun, Inorg. Chem., 2011, 50, 985–991, DOI:10.1021/ic101618n.
- R. Sarma and J. B. Baruah, Solid State Sci., 2011, 13, 1692–1700, DOI:10.1016/j.solidstatesciences.2011.06.019.
- X. Wang, J. Li, H. Lin, H. Hu, B. Chen and B. Mu, Solid State Sci., 2009, 11, 2118–2124, DOI:10.1016/j.solidstatesciences.2009.08.017.
Footnote |
| † Electronic supplementary information (ESI) available: Crystal and geometrical data, TG and DSC curves and IR spectrum for 1. CCDC reference numbers 1405005–1405008 for variable temperature studies of 1 and 1405387–1405388 for rehydration studies of 1. For ESI and crystallographic data in CIF or other electronic format see DOI: 10.1039/c5ce01297j |
| This journal is © The Royal Society of Chemistry 2015 |