 Open Access Article
Creative Commons Attribution 3.0 Unported Licence
Co-crystallisation of cytosine with 1,10-phenanthroline: computational screening and experimental realisation†
Kreshnik
Hoxha
a,
David H.
Case
b,
Graeme M.
Day
 b and
Timothy J.
Prior
*a
aDepartment of Chemistry, University of Hull, Cottingham Road, Hull, HU6 7RX, UK. E-mail: t.prior@hull.ac.uk; Fax: +44 (0)1482 466511; Tel: +44 (0)1482 466389
bChemistry, Faculty of Natural & Environmental Sciences, University of Southampton, Highfield, Southampton, SO17 1BJ, UK
First published on 12th August 2015
Abstract
Attempts to co-crystallise the nucleobases adenine, thymine, guanine, and cytosine with 1,10-phenanthroline by ball milling and solvent evaporation methods are described. A 1![[thin space (1/6-em)]](https://www.rsc.org/images/entities/char_2009.gif) :
:![[thin space (1/6-em)]](https://www.rsc.org/images/entities/char_2009.gif) 1 co-crystal of cytosine and 1,10-phenanthroline can be obtained by grinding or by solvent evaporation. The structure contains two crystallographically independent cytosine and two independent 1,10-phenanthroline molecules (Z′ = 2). The cytosine molecules form two similar but crystallographically independent hydrogen-bonded chains, while the 1,10-phenanthroline molecules are arranged in π-stacks. Between the chains of cytosine and the π-stacks exist N–H⋯N and C–H⋯N interactions. Crystal structure prediction (CSP) calculations were applied to all four systems to assess their potential for co-crystallisation as well as the likely structures and intermolecular interactions that could result from co-crystallisation. Calculations on the cytosine system demonstrate that co-crystallisation results in a lower energy than the crystalline forms of the two starting materials, in line with the co-crystal formation observed. For the systems which did not form a co-crystal, CSP was used to explore potential packing arrangements, but found none which were lower in energy than that of the pure crystalline forms. In these cases there is significant disruption to the nucleobase hydrogen bonding between the pure compound and the hypothetical co-crystal. For pure adenine and guanine, the hydrogen-bonded ribbons form sheets which must be broken, whereas for thymine, the lack of hydrogen bond donors does not allow the hydrogen bonding present for pure thymine to be maintained while forming thymine-1,10-phenanthroline hydrogen bonds.
1 co-crystal of cytosine and 1,10-phenanthroline can be obtained by grinding or by solvent evaporation. The structure contains two crystallographically independent cytosine and two independent 1,10-phenanthroline molecules (Z′ = 2). The cytosine molecules form two similar but crystallographically independent hydrogen-bonded chains, while the 1,10-phenanthroline molecules are arranged in π-stacks. Between the chains of cytosine and the π-stacks exist N–H⋯N and C–H⋯N interactions. Crystal structure prediction (CSP) calculations were applied to all four systems to assess their potential for co-crystallisation as well as the likely structures and intermolecular interactions that could result from co-crystallisation. Calculations on the cytosine system demonstrate that co-crystallisation results in a lower energy than the crystalline forms of the two starting materials, in line with the co-crystal formation observed. For the systems which did not form a co-crystal, CSP was used to explore potential packing arrangements, but found none which were lower in energy than that of the pure crystalline forms. In these cases there is significant disruption to the nucleobase hydrogen bonding between the pure compound and the hypothetical co-crystal. For pure adenine and guanine, the hydrogen-bonded ribbons form sheets which must be broken, whereas for thymine, the lack of hydrogen bond donors does not allow the hydrogen bonding present for pure thymine to be maintained while forming thymine-1,10-phenanthroline hydrogen bonds.
Introduction
The physical properties of molecular solids are inextricably linked with the arrangements of individual molecules in the crystal.1 Any change in the overall crystal structure, such as the inclusion of a water molecule or proton migration, causes changes in the intermolecular interactions in the crystal. Such alteration in the intermolecular interactions and the crystal packing normally results in a change in physical properties.Crystal engineering2,3 may be defined as the rational design of crystalline solids through control of intermolecular interactions. A promising route to improving physical properties of a solid is co-crystallisation of a given compound with another neutral compound which is a solid at ambient conditions. Hence, co-crystals have gained attention within the crystal engineering field due to the interest in modifying the physical properties of a compound.4 For example, in the pharmaceutical industry co-crystallisation has shown potential to alter the solubility, bioavailability, dissolution, and physiochemical stability of active pharmaceutical ingredients (APIs).5 Drug candidates that display poor solubility present a major challenge in the pharmaceutical industry and hence many APIs are prepared as hydrates or salts. However, co-crystallisation is also an important area to explore for the improvement of properties.
A classic example is the case of sildenafil or Viagra, which was initially used for addressing angina, high blood pressure or pulmonary hypertension, but was subsequently targeted for treating erectile dysfunction. In the Viagra formulation, the active ingredient sildenafil is present as a citrate salt, which is only moderately soluble.6 However, a remarkable increase in the solubility was observed when sildenafil was co-crystallised with acetylsalicylic acid.7
Similarly, co-crystallisation of melamine with cyanuric acid has a profound effect on solubility. Toxicological studies of both melamine and cyanuric acid showed no effect on the kidney function of cats fed on melamine and cyanuric acid individually.8 However, intratubular precipitation of highly insoluble co-crystals of melamine:cyanuric acid causes acute renal failure in cats.
As part of a programme to explore the hydrogen bonding capability of DNA nucleobases, we investigated co-crystallisation of these with suitable co-formers. These are good candidates for co-crystallisation because of their versatile hydrogen bonding functionality.9–16 Co-crystallisation of DNA bases has been demonstrated for a wide range of commercially available co-formers including other DNA bases, carboxylic acids, or N-donor bases.12,17
A survey of the Cambridge Structural Database18 (CSD version 5.35, November 2013) shows that nucleobases can display a range of different hydrogen bonding motifs. A good example of this flexibility is the base pairing between DNA bases which can follow either the Watson–Crick19 or Hoogsteen20 modes of hydrogen bonding. However, structures involving cytosine frequently display hydrogen-bonded chains of molecules as shown Fig. 1.
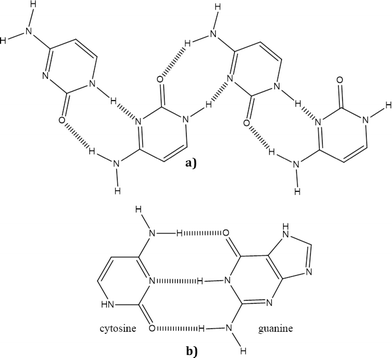 | ||
| Fig. 1 Comparison of synthons: a) synthon formation between two cytosine molecules; b) synthon formation between guanine and cytosine. Dashed lines represent hydrogen bonds. | ||
In this work we describe attempts to form co-crystals of the DNA bases (cytosine, adenine, thymine and guanine) with 1,10-phenanthroline (1,10-phen), to explore whether the hydrogen-bond acceptor properties of 1,10-phen would make it a suitable co-former. Experimental studies ran parallel to computational crystal structure prediction (CSP) studies, whose aim was to explore the potential crystal packing of co-crystals of 1,10-phen with the DNA bases, and to assess the potential of CSP to predict the outcome of co-crystallisation experiments. The results of crystal structure determinations and CSP calculations are presented.
Experimental
Reagents and purities
All chemicals were obtained from Alfa Aesar and used without further purification. Purity of reagents is as follows: 1,10-phenanthroline hydrate 99%, adenine 99%, guanine 98%, cytosine 98%, thymine 97%.Co-crystal screening
In order to explore the formation of co-crystals between DNA bases and the 1,10-phen, we employed solid-state neat grinding21 methods described in literature.22 Binary mixtures of 1,10-phenanthroline hydrate (0.1982 g, 1 mmol) with DNA bases [cytosine (0.111 g, 1 mmol), adenine (0.135 g, 1 mmol), thymine (0.126 g, 1 mmol), guanine (0.151 g, 1 mmol)] were prepared. These were transferred to a 12 mL jar and milled for 1 hour under neat condition in a Retsch PM 100 ball mill. Two stainless steel balls of 10 mm diameter were used for milling.Single crystal preparation
1,10-Phenanthroline hydrate (0.1982 g, 1 mmol) and the DNA base [cytosine (0.027 g, 0.25 mmol); adenine (0.034 g, 0.25 mmol); thymine (0.032 g, 0.25 mmol); guanine (0.038 g, 0.25 mmol)] were dissolved in 50% ethanol![[thin space (1/6-em)]](https://www.rsc.org/images/entities/char_2009.gif) :
:![[thin space (1/6-em)]](https://www.rsc.org/images/entities/char_2009.gif) water (20 mL) and stirred for 10 min with gentle heating. The solution was allowed to evaporate slowly at room temperature.
water (20 mL) and stirred for 10 min with gentle heating. The solution was allowed to evaporate slowly at room temperature.
Infra-red (IR) spectroscopy
FT-IR spectra were collected from samples prepared as KBr disks (1![[thin space (1/6-em)]](https://www.rsc.org/images/entities/char_2009.gif) :
:![[thin space (1/6-em)]](https://www.rsc.org/images/entities/char_2009.gif) 20 dilution) using a Perkin Elmer FT-IR Spectrometer Spectrum RX1.
20 dilution) using a Perkin Elmer FT-IR Spectrometer Spectrum RX1.
Single crystal X-ray diffraction measurements
Single crystal X-ray diffraction data were collected in series of ω-scans using a Stoe IPSD2 image plate diffractometer utilising monochromated Mo Kα radiation (λ = 0.71073 Å). Integration and processing of the data were performed using standard procedures in X-RED.23 Samples were coated in a thin film of perfluoropolyether oil and mounted on a goniometer. An Oxford Cryosystems nitrogen gas cryostream was used to control the temperature during the diffraction experiment, which was set to 100 K.The crystal structure was solved using routine automatic Direct Methods implemented within SHELXS-97.24 Completion of the structure was achieved by performing least squares refinement against all unique F2 values using SHELXL-97.24 All non-H atoms were refined with anisotropic displacement parameters. Location of hydrogen atoms was achieved by using difference Fourier maps.
X-ray powder diffraction
Relatively high resolution X-ray powder diffraction data were collected from intimately ground samples mounted on a PANAlytical Empyrean diffractometer operating with a Cu Kα1 radiation and a PIXCel detector. Rietveld25 refinement was carried out within the GSAS26 suite of programs. The background was fitted using a 6-term shifted Chebyshev function. The unit cell parameters and a zero point error were refined. A single Gaussian peak shape parameter was refined. No atoms positions were refined; a single isotropic displacement parameter was refined for all non-H atoms and Uiso(H) was set to 0.05 Å2.Computational methods
To characterise the potential energy surface of the four systems, and to assess the utility of CSP for co-crystal screening, CSP calculations were undertaken prior to having seen the experimental results. CSP is usually addressed as a lattice energy minimisation problem, whose process involves three general steps:27 calculation of the molecular geometry; generation of trial co-crystal structures and lattice energy minimisation of these co-crystal structures. The assumption is that the lowest energy computer-generated possibilities represent the most likely crystal structures. As an extension to this idea, prediction of whether a co-crystal will form in preference to pure phases of the constituent molecules is performed by comparing the calculated lattice energy of the most stable predicted co-crystal structures to the sum of the pure phase lattice energies.28 A lower co-crystal lattice energy than the pure components represents an energetic driving force for co-crystallisation.Gas-phase geometries of all molecules (1,10-phen and the four bases), were optimised at the B3LYP29,30/6-311G** level of Kohn–Sham theory, using the Gaussian09 program.31 Using these molecular structures, crystal structures were generated with one of each molecule per asymmetric unit in 12 common space groups (P1, P![[1 with combining macron]](https://www.rsc.org/images/entities/char_0031_0304.gif) , P21, C2, Cc, P21/c, C2/c, P212121, Pca21, Pna21, Pbcn, Pbca) with the Global Lattice Energy Explorer (GLEE)32,33 code. The method applies a quasi-random structure generation with rigid molecular geometries, using a Sobol sequence for the quasi-random numbers. Within each space group, lattice parameters are sampled with the constraint of giving a reasonable starting volume, then each molecule in the asymmetric unit is placed with a quasi-random position and orientation, with no constraints on relative positioning of the two components apart from rejection of trial structures with overlapping molecules. 10
, P21, C2, Cc, P21/c, C2/c, P212121, Pca21, Pna21, Pbcn, Pbca) with the Global Lattice Energy Explorer (GLEE)32,33 code. The method applies a quasi-random structure generation with rigid molecular geometries, using a Sobol sequence for the quasi-random numbers. Within each space group, lattice parameters are sampled with the constraint of giving a reasonable starting volume, then each molecule in the asymmetric unit is placed with a quasi-random position and orientation, with no constraints on relative positioning of the two components apart from rejection of trial structures with overlapping molecules. 10![[thin space (1/6-em)]](https://www.rsc.org/images/entities/char_2009.gif) 000 trial structures were generated for each system in each space group. These were relaxed to minimise their lattice energies using the DMACRYS34 crystal structure modelling program, followed by removal of duplicate structures using the COMPACK algorithm,35 comparing inter-atomic separations within 30 molecule clusters from each crystal structure. The unique structures were then ranked by stability according to their final calculated lattice energy. The intermolecular force-field comprised an exp-6 repulsion–dispersion function, using a revised version36 of Williams' empirically parameterised W99 potential,37 and an electrostatic model derived using a distributed multipole analysis38 of the B3LYP/6-311G** electron density, including atomic multipoles up to the rank of hexadecapole on each atom. Charge–charge, charge–dipole and dipole–dipole interactions were summed using Ewald summation, which all other interactions were summed to a cut-off of 15 Å. Space group symmetry was constrained during lattice energy minimisation. The resulting 100 lowest energy predicted structures, for each of the four co-crystal combinations, are available in CIF format as ESI.†
000 trial structures were generated for each system in each space group. These were relaxed to minimise their lattice energies using the DMACRYS34 crystal structure modelling program, followed by removal of duplicate structures using the COMPACK algorithm,35 comparing inter-atomic separations within 30 molecule clusters from each crystal structure. The unique structures were then ranked by stability according to their final calculated lattice energy. The intermolecular force-field comprised an exp-6 repulsion–dispersion function, using a revised version36 of Williams' empirically parameterised W99 potential,37 and an electrostatic model derived using a distributed multipole analysis38 of the B3LYP/6-311G** electron density, including atomic multipoles up to the rank of hexadecapole on each atom. Charge–charge, charge–dipole and dipole–dipole interactions were summed using Ewald summation, which all other interactions were summed to a cut-off of 15 Å. Space group symmetry was constrained during lattice energy minimisation. The resulting 100 lowest energy predicted structures, for each of the four co-crystal combinations, are available in CIF format as ESI.†
For the experimentally observed co-crystal structure of 1,10-phen and cytosine, and for all structures of pure systems, the procedure of minimising the gas-phase molecular structure and then the crystal structure was again followed, all at the same level of theory as used in the prediction calculations, in order to make comparisons between the experimentally observed and theoretical structures. The relevant structures of the pure crystals, with the following reference codes in parentheses, were taken from the CSD: 1,10-phen (OPENAN),39 adenine (KOBFUD),40 cytosine (CYTSIN),41 guanine (KEMDOW)42 and thymine (THYMIN).43 In the case of guanine all calculations were performed using the tautomer which appears in the pure guanine crystal structure.
Results and discussion
Energetic prediction of co-crystallisation
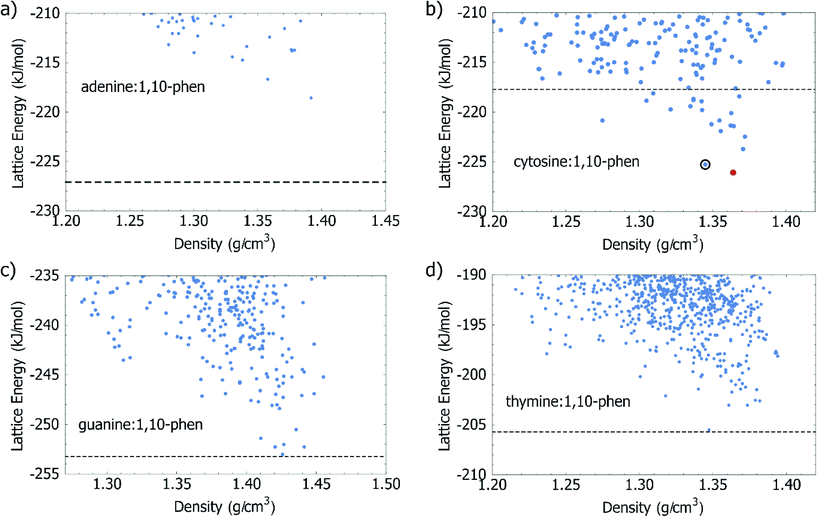
A primary goal of the calculations in this study was to assess the energetic driving force for co-crystallisation of 1,10-phen with each of the four DNA bases. The approach, proposed in a study of the urea:acetic acid complex,28 has since been validated on larger sets of multicomponent crystals44–46 and recently used to guide the experimental realisation of previously unobtainable co-crystal of caffeine with benzoic acid.47 The results of computational global lattice energy searches can be particularly informative in cases where an experimental crystal has not yet been observed, or even prior to performing any experiments, as CSP explores and characterises the structures which could potentially form. These calculations describe the underlying potential energy surface of the crystal in a way which is not dependent on experimental conditions such as solvent or temperature, and so can give an estimation of the fundamental energetic driving force for co-crystal formation.The results presented on this set of systems helps to further assess the approach, which could be used for computational co-crystal screening. The energies and densities of the lowest energy structures from our Z′ = 1 CSP study for the co-crystal systems are summarised in Fig. 2. Calculated energies are also summarised in Table 1.
| Energies in kJ mol−1 | Adenine | Cytosine | Guanine | Thymine |
|---|---|---|---|---|
| E(latt) pure expt. | −135.13 | −124.56 | −161.30 | −113.76 |
| Base + 1,10-phenanthroline | −227.08 | −217.72 | −253.25 | −205.71 |
| Lowest (Z′ = 1) CSP | −218.59 | −225.26 | −253.02 | −205.52 |
| Expt. co-crystal | Not observed | −226.06 | Not observed | Not observed |
With regards to the energetics of forming a co-crystal, we calculate that only one of the DNA bases, cytosine, benefits energetically by co-crystallisation with 1,10-phen (Fig. 2b). We predict 19 distinct 1![[thin space (1/6-em)]](https://www.rsc.org/images/entities/char_2009.gif) :
:![[thin space (1/6-em)]](https://www.rsc.org/images/entities/char_2009.gif) 1 co-crystal structures of cytosine with 1,10-phen with a more favourable lattice energy than the sum of the lattice energies of the cytosine and 1,10-phen single component structures. Any of these structures represents an energetic benefit of co-crystallisation over crystallisation of the pure components. With the usual assumptions of crystal structure prediction, the lowest energy of these predicted co-crystals is judged as the most likely observable co-crystal. The predicted structure is described in more detail below and all predicted structures are available in CIF format as ESI.† Starting from their known crystal structures, we calculate the lattice energy of cytosine to be −125.77 kJ mol−1, and 1,10-phen to be −91.95 kJ mol−1; their sum (−217.72 kJ mol−1) is shown as a dashed line in Fig. 2b. The predicted co-crystal global minimum lies 7.54 kJ mol−1 lower in energy than the separate pure phases. None of the predicted co-crystal structures of adenine, guanine or thymine with 1,10-phen had a lattice energy which was below the sum of the pure crystals of the individual components of the co-crystal. In the case of adenine, the best predicted co-crystal is 8.49 kJ mol−1 above the separate pure phases, which is a strong indication that adenine:1,10-phen would not be observed, at least in the 1
1 co-crystal structures of cytosine with 1,10-phen with a more favourable lattice energy than the sum of the lattice energies of the cytosine and 1,10-phen single component structures. Any of these structures represents an energetic benefit of co-crystallisation over crystallisation of the pure components. With the usual assumptions of crystal structure prediction, the lowest energy of these predicted co-crystals is judged as the most likely observable co-crystal. The predicted structure is described in more detail below and all predicted structures are available in CIF format as ESI.† Starting from their known crystal structures, we calculate the lattice energy of cytosine to be −125.77 kJ mol−1, and 1,10-phen to be −91.95 kJ mol−1; their sum (−217.72 kJ mol−1) is shown as a dashed line in Fig. 2b. The predicted co-crystal global minimum lies 7.54 kJ mol−1 lower in energy than the separate pure phases. None of the predicted co-crystal structures of adenine, guanine or thymine with 1,10-phen had a lattice energy which was below the sum of the pure crystals of the individual components of the co-crystal. In the case of adenine, the best predicted co-crystal is 8.49 kJ mol−1 above the separate pure phases, which is a strong indication that adenine:1,10-phen would not be observed, at least in the 1![[thin space (1/6-em)]](https://www.rsc.org/images/entities/char_2009.gif) :
:![[thin space (1/6-em)]](https://www.rsc.org/images/entities/char_2009.gif) 1 stoichiometry investigated in the computational study. In the cases of guanine and thymine, co-crystal formation is associated with a very small loss in lattice energy of 0.23 and 0.20 kJ mol−1 respectively. Although we would not predict the formation of co-crystals of either base with 1,10-phen, these values are within any reasonable estimation of the error associated with lattice energy calculations.
1 stoichiometry investigated in the computational study. In the cases of guanine and thymine, co-crystal formation is associated with a very small loss in lattice energy of 0.23 and 0.20 kJ mol−1 respectively. Although we would not predict the formation of co-crystals of either base with 1,10-phen, these values are within any reasonable estimation of the error associated with lattice energy calculations.
Co-crystal screening and PXRD analysis
In terms of potential hydrogen bonding, all four DNA bases: adenine; cytosine; thymine and guanine might be predicted to form co-crystals with 1,10-phen. This hypothesis was based on the hydrogen bond donor sites present in all these bases that would enable them to interact with the basic nitrogens of 1,10-phen, forming N–H⋯N(pyridyl) interactions. However, the results of the screening experiments suggest that not all DNA bases do form co-crystals with 1,10-phen. Powder X-ray diffraction data (PXRD) collected from the product of milling cytosine with 1,10-phen are shown in Fig. 3. It is clear that characteristic peaks of cytosine and 1,10-phen hydrate are no longer present in the pattern. For example, no major feature exists in the region around 2θ = 20° in the product unlike patterns of each starting material. We were not able to identify any other known phase in the powder diffraction pattern.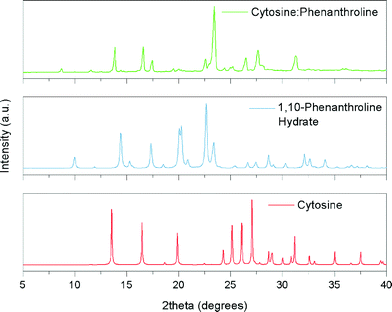 | ||
| Fig. 3 Simulated X-ray powder diffraction patterns of cytosine and 1,10-phenanthroline hydrate, and experimental pattern obtained after milling their mixture. | ||
For the other DNA bases, evidence that co-crystallisation has occurred with 1,10-phen during milling is much weaker. Little evidence of partial phase transformation was observed in the co-crystallisation experiment between adenine and 1,10-phen (Fig. S1†). These findings suggest that the PXRD pattern of the product of grinding is simply a mixture of the two starting materials. Fig. S2† shows the X-ray powder diffraction pattern collected from the solid product of milling thymine with 1,10-phen. The diffraction pattern closely resembles a mixture of thymine and 1,10-phen hydrate. Although the emergence of small features in the region 8 ≤ 2θ/° ≤ 12 suggest a new phase may be emerging, protracted grinding of this mixture (4 hours) did not lead to further changes in the powder diffraction pattern of the product. Finally, the results of the co-crystallisation between guanine and 1,10-phen are shown in Fig. S3†. The pattern of the milled product bears a close resemblance to that of 1,10-phen hydrate, but there are extra features that do not appear to be consistent with pure guanine such as the broad peak at 2θ = 27°, shoulder at 2θ = 14° and disappearance of guanine peaks at 2θ = 13,13.8 and 16.2°. Similar to the case of thymine, protracted grinding did not yield further changes in the diffraction pattern suggesting co-crystal formation was not occurring.
Evaluation of the results from co-crystal screening and solution crystallisation
The initial screening reactions by milling demonstrated a new phase had formed from the milling of cytosine and 1,10-phen. For brevity, hereafter we designate this phase cyt:phen. We were able to use solution methods to grow crystals from a mixture of cytosine and 1,10-phen hydrate. It proved possible to solve the structure by routine single-crystal X-ray methods.Screening experiments of 1,10-phen hydrate with adenine, thymine and guanine, respectively suggested that co-crystallisation has been unsuccessful. Remarkably, the only reaction which afforded single crystals is the reaction of cytosine with 1,10-phen hydrate, which is consistent with the formation of a new phase upon milling these two starting materials together.
Structure of cyt:phen
Colourless crystals were obtained by simple solvent evaporation and were determined to be a 1![[thin space (1/6-em)]](https://www.rsc.org/images/entities/char_2009.gif) :
:![[thin space (1/6-em)]](https://www.rsc.org/images/entities/char_2009.gif) 1 co-crystal with composition (C4H5N3O)2·(C12H8N2)2.‡ This phase cyt:phen crystallises in the monoclinic space group P21/c with a unit cell volume = 2722.99(5) Å3. The asymmetric unit contains two crystallographically independent cytosine molecules and two crystallographically independent 1,10-phen molecules (i.e. Z′ = 2) as depicted in Fig. 4.
1 co-crystal with composition (C4H5N3O)2·(C12H8N2)2.‡ This phase cyt:phen crystallises in the monoclinic space group P21/c with a unit cell volume = 2722.99(5) Å3. The asymmetric unit contains two crystallographically independent cytosine molecules and two crystallographically independent 1,10-phen molecules (i.e. Z′ = 2) as depicted in Fig. 4.
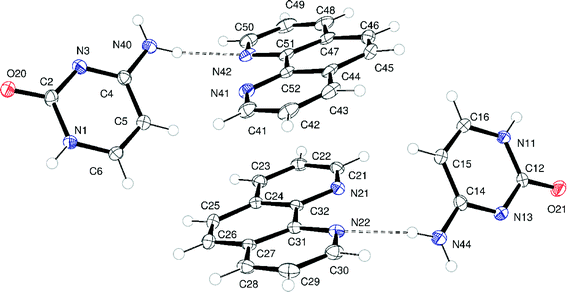 | ||
| Fig. 4 Asymmetric unit of cyt:phen. Atoms are drawn as 50% probability ellipsoids. Dashed lines represent N–H⋯N hydrogen bonds. | ||
Chemically sensible criteria were imposed while analysing and identifying the hydrogen bond patterns in the structure. These include: all donors should have a covalent bond with a hydrogen atom, the hydrogen bond acceptors should possess a lone pair of electrons capable of forming hydrogen bonds, and the D–H⋯A angle >90°, as classified by Jeffrey.48
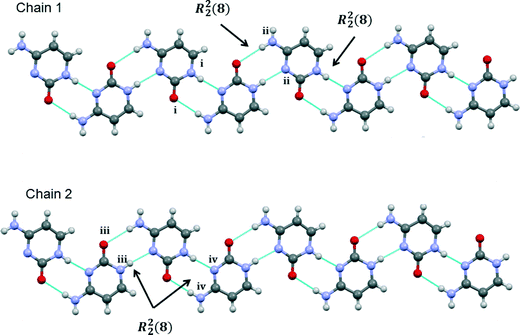
Each of the two independent cytosine molecules forms a zigzag hydrogen-bonded chain that extends parallel to the crystallographic b-axis. Chain 1 is composed only of the first cytosine molecule and likewise the second crystallographically-independent cytosine is only found in chain 2. The chains are very similar and are sustained by pairs of R22(8) embraces between symmetry-related cytosine molecules (Fig. 5).
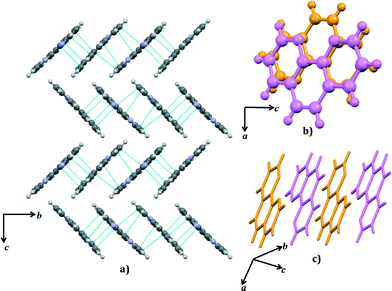
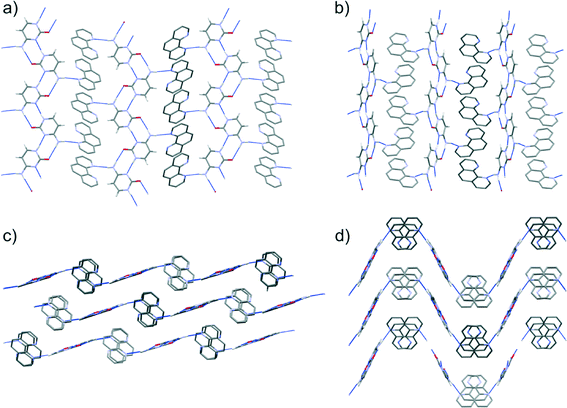
The two symmetry-independent 1,10-phen molecules are arranged approximately parallel. The 1,10-phen molecules are stacked along the crystallographic b-axis but they are inclined at an angle 46.2 (15)° to b. Within this π-stack the distances between π-systems alternate between 3.38 (7) Å and 3.28 (8) Å. These separations are suggestive of a moderately strong interactions between the two π-systems. This pair of 1,10-phen molecules are part of an extended π-stack that is parallel to b-axis. The structure is thus divided into two structural elements: the hydrophilic part comprising hydrogen-bonded chains and the hydrophobic part comprising π-stacked aromatic molecules (Fig. 6 and 7).
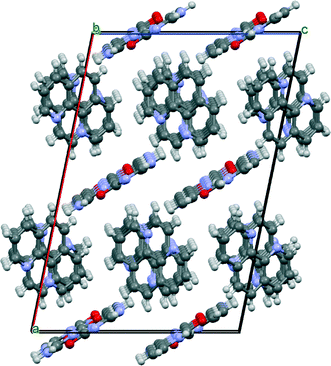 | ||
| Fig. 6 View of cyt:phen just off [010] direction illustrating infinite chains of cytosine and stacking of phenanthroline molecules. | ||
There are strong N–H⋯N and weaker C–H⋯N hydrogen bonds between the chains and the 1,10-phen π-stacks. As shown in Fig. 4, each 1,10-phen acts as a hydrogen bond acceptor to a cytosine molecule. The assembly of hydrophobic and hydrophilic parts of the structure by hydrogen bonds is illustrated in Fig. 9a.
Close examination of the structure reveals the presence of a weak hydrogen bond between cytosine and 1,10-phen molecule in the asymmetric unit. The interaction arises between C50—H50(aromatic)⋯N3(endocyclic). The donor acceptor distance and the angle of this interaction are in compliance with the classification provided by Jeffrey.48 The distance was recorded as 3.511(4) Å and the angle was observed to be 150.5°. Full details of the hydrogen bonding present are shown in Table 2.
| D–H | A | d(D–H)/(Å) | d(H⋯A) (Å) | d(D⋯A) (Å) | <D–H···A (°) |
|---|---|---|---|---|---|
| Symmetry equivalent atoms are generated by the following symmetry operations: i = (−x + 1, y − 0.5, −z + 1.5); ii = (−x, y + 0.5, −z + 1.5); iii = (−x + 1, y − 0.5, −z + 0.5); iv = (−x + 1, y + 0.5, −z + 0.5); v = (−x, −y + 2, −z + 1). | |||||
| N1–H1 | N3i | 0.86 | 1.94 | 2.792(3) | 171.9 |
| N40–H40A | O20ii | 0.86 | 2.24 | 3.094(3) | 170.4 |
| N40–H40B | N42 | 0.86 | 2.16 | 3.012(3) | 169.4 |
| C5–H5 | N41 | 0.93 | 2.66 | 3.206(3) | 118.1 |
| N44–H44A | O21iii | 0.86 | 2.26 | 3.116(3) | 174.7 |
| N44–H44B | N22 | 0.86 | 2.22 | 3.072(3) | 168.9 |
| C15–H15 | N21 | 0.93 | 2.63 | 3.147(3) | 115.4 |
| N11–H11 | N13iv | 0.86 | 1.94 | 2.798(3) | 173.5 |
| C50–H50 | N3v | 0.93 | 2.67 | 3.511(4) | 150.5 |
Phase purity and Rietveld fitting
X-ray powder diffraction was used to determine whether the single crystal examined was representative of the phase obtained by ball milling. Data were collected from a 1![[thin space (1/6-em)]](https://www.rsc.org/images/entities/char_2009.gif) :
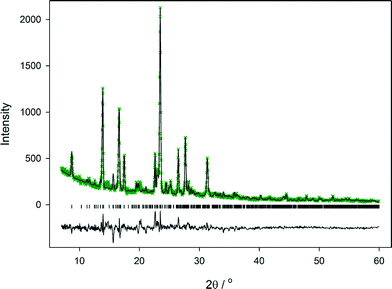
:![[thin space (1/6-em)]](https://www.rsc.org/images/entities/char_2009.gif) 1 mixture of cyt:phen that had been milled for 1 hour. A partial Rietveld fit to this is shown in Fig. 8. The initial model employed to fit the observed data was the structure determined from the single crystal at 100 K. Following refinement of the model, it is clear that the quality of fit to the observed data is good, as shown by Rp of 0.0918 for all data. There is no evidence for other crystalline phases present. It would be possible to improve the fit further by imposing appropriate restraints on the model and refining atom positions, but this would be very time-consuming given the complexity of the model. The fit shown in Fig. 8 demonstrates clearly that the cyt:phen co-crystal can be obtained pure by ball-milling of the two components and demonstrates the solution and ball-milling techniques produce the same co-crystal.§
1 mixture of cyt:phen that had been milled for 1 hour. A partial Rietveld fit to this is shown in Fig. 8. The initial model employed to fit the observed data was the structure determined from the single crystal at 100 K. Following refinement of the model, it is clear that the quality of fit to the observed data is good, as shown by Rp of 0.0918 for all data. There is no evidence for other crystalline phases present. It would be possible to improve the fit further by imposing appropriate restraints on the model and refining atom positions, but this would be very time-consuming given the complexity of the model. The fit shown in Fig. 8 demonstrates clearly that the cyt:phen co-crystal can be obtained pure by ball-milling of the two components and demonstrates the solution and ball-milling techniques produce the same co-crystal.§
The synthesis of cyt:phen by ball-milling was entirely reproducible. Experiments to prove the extent of reaction as a function of milling time were undertaken. After 30 minutes grinding there is little evidence of a transformation to the co-crystal, but 60 minutes grinding is sufficient to effect a full transformation (Fig. S5†). It is also possible to generate pure cyt:phen by hand grinding within an agate pestle and mortar for a period of 60 minutes (Fig. S6†).
Cyt:phen melted in the range 224–226 °C with some darkening. A small portion was melted between glass slides (at around 250 °C) and the product was examined by X-ray diffraction (see ESI† Fig. S7 and S8). X-ray diffraction data suggest the co-crystal decomposes on melting to give cytosine and 1,10-phen phases.
To explore whether the observed structure for cyt:phen would undergo a phase change upon heating, single-crystal X-ray diffraction data sets were collected at 293 K and 393 K. In each case the data unambiguously showed the presence of the same cell as that observed for cyt:phen at 100 K. It was possible to refine structures at each temperature and despite thermal expansion of the unit cell there are no major structural changes between 100 K and 393 K. The ESI† contains refined structures for 293 K and 393 K data.
Packing of the predicted co-crystal structures
The predictions from CSP are in good agreement with what has been observed in the co-crystallisation studies. Cytosine:1,10-phen is the only co-crystal predicted to benefit significantly in lattice energy relative to the pure components and is the only system that unambiguously forms a co-crystal. In addition to this basic energetic evaluation, further analysis of the predicted crystal structures of all four systems provides additional insight into the interactions driving co-crystallisation.While the prediction of co-crystal formation agrees with experiment, none of the predicted co-crystals of cytosine with 1,10-phen completely reproduces the packing of the observed structure, since CSP was restricted to Z′ = 1 and the observed structure contains two formula units in the asymmetric unit. Lattice energy minimisation of the observed crystal structure shows that the observed Z′ = 2 packing is slightly (0.8 kJ mol−1) more stable than the best Z′ = 1 predicted co-crystal structure (Table 1 and Fig. 2). Given that several predicted co-crystal structures lie close in energy to the observed co-crystal, and lower in energy than the pure components, polymorphism of this co-crystal could be possible under different crystallisation conditions such as different solvent, temperature or additives.
Cytosine molecules show a clear preference to form planar, hydrogen bonded chains in the predicted co-crystal structures. The chains that are found in the observed co-crystal structure (Fig. 5) occur in 39 of the 42 computer generated structures that lie within 10 kJ mol−1 of the lowest energy Z′ = 1 calculated co-crystal structure. Co-crystal formation is stabilised by the ability of the remaining amine hydrogen to interact with the nitrogen atom of 1,10-phen, which lies at a variety of orientations relative to the cytosine chains in the predicted structures. While all molecules in the resulting cytosine:1,10-phen chains are co-planar in some of the low energy predicted structures, this is not the case in the Pbca Z′ = 1 global energy minimum. In this lowest energy structure, the 1,10-phen molecules are tilted out of the plane of the cytosine ribbons, allowing π-stacking in the direction of the cytosine–cytosine hydrogen bonds (see Fig. 9b and d). The observed Z′ = 2 co-crystal structure (Fig. 9a and c) has the same hydrogen bonding as seen in the lowest energy predicted structure. However, a different arrangement of the 1,10-phen molecules along the π-stacking direction leads to more buckled hydrogen bonded layers (Fig. 9d) in the predicted structure. A pseudo-screw axis in the observed structure alternates the orientation of 1,10-phen molecules along their π-stacking direction; a similar arrangement is seen in the lowest energy Z′ = 1 structure in the P21/c space group, although the overall packing of this structure is less dense than others of comparable lattice energy.
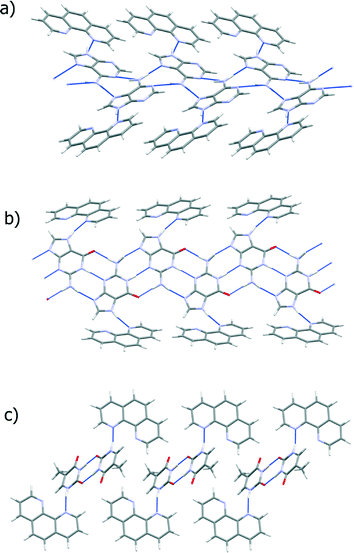
Our understanding of why cytosine is the only base to co-crystallise with 1,10-phen is enhanced by consideration of the packing motifs of the known pure component crystal structures versus those suggested as potential co-crystals in the CSP. Hydrogen-bonded ribbons formed by the bases along a true or approximate 21 screw are seen throughout the known crystal structures of all four nucleobases, as well as the predictions for all four co-crystal systems, including in the lowest structure of all sets apart from thymine:1,10-phen (Fig. 10). Interactions with 1,10-phen replace the connection between the ribbons in the pure nucleobases, which depend on the remaining hydrogen-bond donor and acceptors of the base. The 1,10-phen molecule is observed at various angles to the nucleobase chains in the predicted co-crystal structures. In pure cytosine (CSD refcode CYTSIN), the ribbons are not co-planar and there is only one hydrogen bond cross-connection per molecule between ribbons; this can be favourably replaced by the cytosine-1,10-phen hydrogen bonding to form a co-crystal. Cytosine maintains its hydrogen bond count in the co-crystal, while 1,10-phen gains relative to its pure phase.
Hydrogen bond ribbons of the bases with two rings, adenine and guanine, align to form sheets in their pure crystal structures (KOBFUD and KEMDOW, respectively). In both cases, their pure phases satisfy all possible hydrogen bond donors and acceptors, but two inter-ribbon hydrogen bonds in the pure nucleobase crystal structures are replaced by a single base-1,10-phen hydrogen bond in the best possible co-crystal structure. This loss of hydrogen bonding is compensated by the gain by 1,10-phen of a hydrogen bond compared to its pure form. The predicted co-crystals of these two systems form buckled hydrogen bond sheets, in which π-stacking is poor. Overall, the energetics balance out for guanine, with the best co-crystal being nearly equi-energetic with the pure phases. Adenine loses out more dramatically in its hypothetical co-crystal, leaving one of its nitrogen atoms uninvolved in any hydrogen bonding. The resulting energy loss (Table 1) makes co-crystallisation in this system very unlikely.
Thymine, on the other hand, has an excess of hydrogen bond acceptors and the ribbons in the pure structure (THYMIN) do not have hydrogen bonds between them which would have to be broken in order to form the co-crystal. However, 1,10-phen, as a hydrogen bond acceptor, cannot interact favourably with the unused acceptor on thymine. Instead, the ribbons are replaced by thymine dimers in the predicted co-crystal, which hydrogen bond to 1,10-phen. Again, hydrogen bonding of the base is poorer in the hypothetical co-crystal than the pure phase, while 1,10-phen gains a hydrogen bond in the co-crystal; these effects balance, so that the predicted co-crystal represents neither an energetic gain nor a loss relative to the pure phases.
These results give useful insight into the balance of interactions that influence whether a co-crystal is formed. Whilst we believe that we have characterised the important interactions in these co-crystal systems, the observed Z′ = 2 structure of the cyt:phen co-crystal reminds us that not all possibilities have been sampled in the CSP studies. Symmetry lowering between the experimentally observed Z′ = 2 P21/c cyt:phen, and the lowest energy Z′ = 1 Pbca may be worth around 0.8 kJ mol−1. In the gua:phen and thy:phen cases the lattice energy penalty of co-crystal formation was less than this; it is possible that more stable co-crystal structures exist in high Z′ or space groups that were not considered. However, for CSP to be a useful tool in screening candidates, it must be fast, and so we restricted our search to Z′ = 1 crystals. The implications of possible low symmetry structures provide a source of error, but also food for consideration when optimising a search in phase space. On the other hand, the stabilisation of the lowest Z′ = 1 prediction of cyt:phen compared to its pure crystals, was roughly an order of magnitude larger than the energy of relaxing to the Z′ = 2 structure, and so we would be reasonably confident extending this methodology to making further blind predictions of co-crystallisation for systems such as these.
Relationship of cyt:phen to other cytosine-containing compounds
Evaluation of the cyt:phen structure and other cytosine-containing structures in the CSD sheds light on the rather flexible and versatile hydrogen bonding displayed by this compound. Hydrogen bond patterns were firstly compared with those observed in organic salts of cytosine.It is evident from Fig. 11 that in cytosinium dihydroxybenzoate the cytosinium cations interact with each other via only one hydrogen bond and the neighbouring molecules are tilted.49 In cytosinum maleate, the cytosinium cations form pairs of hydrogen bonds which generate a R22(8) homosynthon.50 In this case, the cytosinium ribbon is interrupted by the maleate anion, which forms a R22(8) heterosynthon with cytosinium on one side, and a single hydrogen bond on the other. Interestingly, the cytosinium ribbons in cytosinium isophthalate are held together via two distinct hydrogen bonding patterns. The first one is a R22(12) homosynthon and the second pattern is R22(8) homosynthon.51 The latter is akin to the interaction observed in the cyt:phen structure.
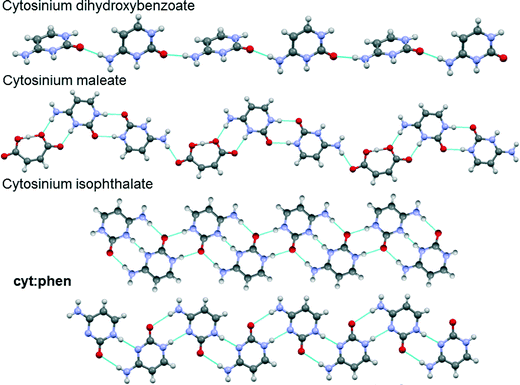 | ||
| Fig. 11 Representations of portions of crystal structures of cytosine and cytosinium compounds. Blue dashed lines between molecules represent hydrogen bonds. | ||
Hydrogen bond patterns of cyt:phen were also compared to co-crystals of cytosine (or its derivatives) reported in literature and retrieved from the CSD. It was noticed that there are fewer co-crystals of cytosine or its derivatives compared to salt forms. Fig. 12 depicts the hydrogen bonding between the reported 5-fluorocytosine:terephthalic acid and cyt:phen. The findings on cytosine hydrogen bonding from the present study are in agreement with the findings of da Silva and co-workers.52
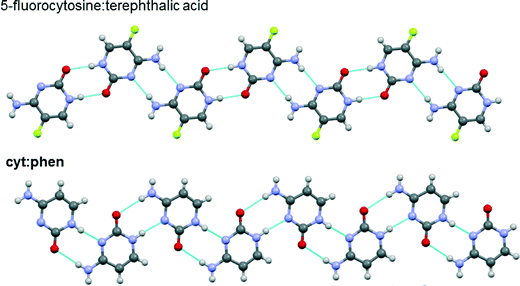 | ||
| Fig. 12 Representations of portions of crystal structures of the co-crystals 5-fluorocytosine:terephthalic acid and cyt:phen. Blue dashed lines between molecules represent hydrogen bonds. | ||
However, contrary to the cytosine ribbon obtained in the cyt:phen co-crystal, co-crystals of cytosine:5-isopropyl-6-methylisocytosine (herein referred to as co-former) display a different hydrogen bonding motif. In the structure reported by Radhakrishnan et al.53 in 2014, cytosine is hydrogen bonded to the co-former via a similar motif to its base pairing with guanine in the DNA. It should also be noted that the G:C-like hydrogen bond between cytosine and its co-former is stabilised by hydrogen bonding to the adjacent molecules which generate a R24(8) heterosynthon.
Conclusion
Although each of the nucleobases examined has the potential to form N–H⋯N hydrogen bonds to 1,10-phen, it has only proved possible to obtain the co-crystal of 1,10-phen with cytosine. CSP studies have estimated the change in internal energy of a mixed system undergoing co-crystallization, and only predict a favourable thermodynamic driving force in this case. Qualitative analysis of theoretically generated structures, and comparison with other known cytosine co-crystals has identified structural motifs which we believe to be important in these systems. In pure cytosine, R22(8) embraces assemble the cytosine molecules into chains, or ribbons, and co-crystallisation with 1,10-phen does not disrupt this hydrogen-bonded chain significantly. It seems likely that it is the similarity in portions of the structures that explains the ease with which co-crystallisation occurs upon grinding. It is notable that this hydrogen-bonded chain of cytosine occurs in almost all of the lowest energy Z′ = 1 predicted structures. The observed structure contains this chain but the ABAB stacking of 1,10-phen has denser packing and a lower energy.For the other nucleobases, though, the computational study suggests that there is a more significant disruption to the nucleobase hydrogen bonding between the pure compound and the hypothetical co-crystal. In the cases of pure adenine and guanine, the ribbons form sheets which must be broken, whereas in that of thymine, the lack of hydrogen donors does not allow the hydrogen bonding present for pure thymine to be maintained while forming thymine-1,10-phen hydrogen bonds.
It is clear that there must be a shift in the energetic balance of hydrogen bond breaking and making, and 1,10-phen stacking, for co-crystallization to occur in some cases compared to others. These experimental studies, comparisons to similar systems, and CSP predictions qualify and quantify the most favourable interactions in the set of nucleobases with this potential partner. The combination of these has helped to rationalize the observed results, and provides information which can guide future candidates for co-crystallization.
This study illustrates the insight that can be gained through combining computational methods of structure prediction with experimental solid form screening and characterisation. In the longer term, a goal for crystal structure prediction is to be used reliably in advance of experimental efforts, to guide the best choice of experiments. The complexity of the newly discovered co-crystal of cytosine with 1,10-phen, with four independent molecules in the crystallographic asymmetric unit, highlights one of the challenges for prediction methodologies. While the computational effort required to screen all crystal packing possibilities, including all reasonable space group and Z′ combinations, is not unachievable, the timescales required using typical computational resources would currently be longer than would useful for screening sets of co-former possibilities. Nevertheless, the results of the present study show that even limited structure prediction can help understand the success or failure of attempted co-crystallisation experiments
Acknowledgements
DHC and GMD thank the European Research Council for funding under the European Union's Seventh Framework Programme (FP/2007-2013)/ERC Grant Agreement no. 307358 (ERC-stG-2012-ANGLE) and acknowledge the use of the IRIDIS High Performance Computing Facility at the University of Southampton. KH thanks the University of Hull for the award of a Studentship.References
- N. Schultheiss and A. Newman, Cryst. Growth Des., 2009, 9, 2950 CAS.
- G. M. J. Schmidt, Pure Appl. Chem., 1971, 27, 647 CrossRef CAS.
- R. Pepinsky, Phys. Rev., 1955, 100, 971 CAS.
- P. Vishweshwar, J. A. McMahon, J. A. Bis and M. J. Zaworotko, J. Pharm. Sci., 2006, 95, 499 CrossRef CAS.
- N. Qiao, M. Li, W. Schlindwein, N. Malek, A. Davies and G. Trappitt, Int. J. Pharm., 2011, 419, 1 CrossRef CAS PubMed.
- N. Shan and M. J. Zaworotko, Drug Discovery Today, 2008, 13, 440 CrossRef CAS PubMed.
- M. Zegarac, E. Leksic, P. Sket, J. Plavec, M. Devcic Bogdanovic, D.-K. Bucar, M. Dumic and E. Mestrovic, CrystEngComm, 2014, 16, 32 RSC.
- B. Puschner, R. H. Poppenga, L. J. Lowenstine, M. S. Filigenzi and P. A. Pesavento, J. Vet. Diagn. Invest., 2007, 19, 616 CrossRef PubMed.
- A. Cherouana, R. Bousboua, L. Bendjeddou, S. Dahaoui and C. Lecomte, Acta Crystallogr., Sect. E: Struct. Rep. Online, 2009, 65, o2285 CAS.
- E.-E. Bendeif, S. Dahaoui, N. Benali-Cherif and C. Lecomte, Acta Crystallogr., Sect. B: Struct. Sci., 2007, 63, 448 CAS.
- A. Cherouana, N. Benali-Cherif and L. Bendjeddou, Acta Crystallogr., Sect. E: Struct. Rep. Online, 2003, 59, o180 CAS.
- M. Byres, P. J. Cox, G. Kay and E. Nixon, CrystEngComm, 2009, 11, 135 RSC.
- S. Verma, A. K. Mishra and J. Kumar, Acc. Chem. Res., 2009, 43, 79 CrossRef PubMed.
- B. Das and J. B. Baruah, Cryst. Growth Des., 2010, 10, 3242 CAS.
- C. B. Aakeroy and K. R. Seddon, Chem. Soc. Rev., 1993, 22, 397 RSC.
- Y. Aoyama, H. Onishi and Y. Tanaka, Tetrahedron Lett., 1990, 31, 1177 CrossRef CAS.
- T. Lee and P. Y. Wang, Cryst. Growth Des., 2010, 10, 1419 CAS.
- F. Allen, Acta Crystallogr., Sect. B: Struct. Sci., 2002, 58, 380 CrossRef.
- J. D. Watson and F. H. C. Crick, Nature, 1953, 171, 737 CrossRef CAS PubMed.
- K. Hoogsteen, Acta Crystallogr., 1959, 12, 822 CrossRef CAS.
- A. V. Trask, W. D. S. Motherwell and W. Jones, Cryst. Growth Des., 2005, 5, 1013 CAS.
- T. Friščić and W. Jones, Cryst. Growth Des., 2009, 9, 1621 Search PubMed.
- X-Area, STOE & Cie GmbH, Darmstadt, 2012 Search PubMed.
- G. Sheldrick, Acta Crystallogr., Sect. A: Found. Crystallogr., 2008, 64, 112 CrossRef CAS PubMed.
- H. Rietveld, J. Appl. Crystallogr., 1969, 2, 65 CrossRef CAS.
- A. C. Larson and R. B. Von Dreele, General Structure Analysis System (GSAS), Los Alamos National Laboratory Report LAUR, 2000, pp. 86–748 Search PubMed.
- G. M. Day, Crystallogr. Rev., 2011, 17, 3 CrossRef PubMed.
- A. J. Cruz-Cabeza, G. M. Day and W. Jones, Chem. – Eur. J., 2008, 14, 8830 CrossRef CAS PubMed.
- A. D. Becke, J. Chem. Phys, 1993, 98, 5648 CrossRef CAS PubMed.
- P. J. Stephens, F. J. Devlin, C. F. Chabalowski and M. J. Frisch, J. Phys. Chem., 1994, 98, 11623 CrossRef CAS.
- M. J. Frisch, G. W. Trucks, H. B. Schlegel, G. E. Scuseria, M. A. Robb, J. R. Cheeseman, G. Scalmani, V. Barone, B. Mennucci, G. A. Petersson, H. Nakatsuji, M. Caricato, X. Li, H. P. Hratchian, A. F. Izmaylov, J. Bloino, G. Zheng, J. L. Sonnenberg, M. Hada, M. Ehara, K. Toyota, R. Fukuda, J. Hasegawa, M. Ishida, T. Nakajima, Y. Honda, O. Kitao, H. Nakai, T. Vreven, J. A. Montgomery Jr., J. E. Peralta, F. Ogliaro, M. J. Bearpark, J. Heyd, E. N. Brothers, K. N. Kudin, V. N. Staroverov, R. Kobayashi, J. Normand, K. Raghavachari, A. P. Rendell, J. C. Burant, S. S. Iyengar, J. Tomasi, M. Cossi, N. Rega, N. J. Millam, M. Klene, J. E. Knox, J. B. Cross, V. Bakken, C. Adamo, J. Jaramillo, R. Gomperts, R. E. Stratmann, O. Yazyev, A. J. Austin, R. Cammi, C. Pomelli, J. W. Ochterski, R. L. Martin, K. Morokuma, V. G. Zakrzewski, G. A. Voth, P. Salvador, J. J. Dannenberg, S. Dapprich, A. D. Daniels, Ö. Farkas, J. B. Foresman, J. V. Ortiz, J. Cioslowski and D. J. Fox, Gaussian 09, Gaussian, Inc., Wallingford, CT, USA, 2009 Search PubMed.
- P. J. Bygrave, D. H. Case and G. M. Day, Faraday Discuss., 2014, 170, 41 RSC.
- D. H. Case, J. E. Campbell and G. M. Day, in preparation.
- S. L. Price, M. Leslie, G. W. A. Welch, M. Habgood, L. S. Price, P. G. Karamertzanis and G. M. Day, Phys. Chem. Chem. Phys., 2010, 12, 8478 RSC.
- J. A. Chisholm and S. Motherwell, J. Appl. Crystallogr., 2005, 38, 228 CrossRef.
- H. P. G. Thompson, E. O. Pyzer-Knapp and G. M. Day, in preparation.
- D. E. Williams, J. Comput. Chem., 2001, 22, 1154 CrossRef CAS PubMed.
- A. J. Stone, J. Chem. Theory Comput., 2005, 1, 1128 CrossRef CAS.
- S. Nishigaki, H. Yoshioka and K. Nakatsu, Acta Crystallogr., Sect. B: Struct. Crystallogr. Cryst. Chem., 1978, 34, 875 CrossRef.
- S. Mahapatra, S. K. Nayak, S. J. Prathapa and T. N. Guru Row, Cryst. Growth Des., 2008, 8, 1223 CAS.
- D. L. Barker and R. E. Marsh, Acta Crystallogr., 1964, 17, 1581 CrossRef CAS.
- K. Guille and W. Clegg, Acta Crystallogr., Sect. C: Cryst. Struct. Commun., 2006, 62, o515 Search PubMed.
- K. Ozeki, N. Sakabe and J. Tanaka, Acta Crystallogr., Sect. B: Struct. Crystallogr. Cryst. Chem., 1969, 25, 1038 CrossRef CAS.
- A. J. Cruz-Cabeza, S. Karki, L. Fabian, T. Friscic, G. M. Day and W. Jones, Chem. Commun., 2010, 46, 2224 RSC.
- N. Issa, P. G. Karamertzanis, G. W. A. Welch and S. L. Price, Cryst. Growth Des., 2009, 9, 442 CAS.
- H. C. S. Chan, J. Kendrick, M. A. Neumann and F. J. J. Leusen, CrystEngComm, 2013, 15, 3799 RSC.
- D.-K. Bucar, G. M. Day, I. Halasz, G. G. Z. Zhang, J. R. G. Sander, D. G. Reid, L. R. MacGillivray, M. J. Duer and W. Jones, Chem. Sci., 2013, 4, 4417 RSC.
- G. A. Jeffrey, An Introduction to Hydrogen Bonding, Oxford University Press, 1997 Search PubMed.
- B. Sridhar, J. B. Nanubolu and K. Ravikumar, CrystEngComm, 2012, 14, 7065 RSC.
- T. Balasubramanian, P. T. Muthiah and W. T. Robinson, Bull. Chem. Soc. Jpn., 1996, 69, 2919 CrossRef CAS.
- S. R. Perumalla, E. Suresh and V. R. Pedireddi, Angew. Chem., Int. Ed., 2005, 44, 7752 CrossRef CAS PubMed.
- C. C. P. da Silva, R. de Oliveira, J. C. Tenorio, S. B. Honorato, A. P. Ayala and J. Ellena, Cryst. Growth Des., 2013, 13, 4315 CAS.
- K. Radhakrishnan, N. Sharma and L. M. Kundu, RSC Adv., 2014, 4, 15087 RSC.
Footnotes |
| † Electronic supplementary information (ESI) available: The ESI contains X-ray powder diffraction data relating to the co-crystallisation trials, and details of the 100 lowest-energy structures found from the CSP calculations. Crystal structures of cyt:phen collected at 293 K and 393 K. CCDC 1048496 contains the supplementary crystallographic data for this paper. For ESI and crystallographic data in CIF or other electronic format see DOI: 10.1039/c5ce01286d |
| ‡ Crystal structure information for cyt:phen: cytosine:phenanthroline co-crystal (Z′ = 2), Mo Kα (λ = 0.71073 Å), 5269 independent reflections (Rint = 0.0993), T = 100 K, monoclinic, space group P21/c, a = 20.765(2) b = 9.4741(5) c = 14.1307(13) β = 101.612(8)°, V = 2723.0(4) Å3, ρ = 1.421 g cm−3, F(000) = 1216, GooF = 0.867, R1 (I > 2σI) = 0.0646, wRF2 (I > 2σI) = 0.1527. |
| § Rietveld refinement information for cyt:phen: cytosine:phenanthroline co-crystal (Z′ = 2), Cu Kα1 (λ = 1.54056 Å), 2039 points, T = 293 K, monoclinic, space group P21/c, a = 20.694(4) b = 9.4591(13) c = 14.381(3) Å β = 100.867(8) °, V = 2764.6(11) Å3. Uiso(non-H) = 0.038(5) Å2 Uiso(H) = 0.05 Å2. Rwp = 0.1296, Rp = 0.0918. |
| This journal is © The Royal Society of Chemistry 2015 |

