
 Open Access Article
 This Open Access Article is licensed under a
 Creative Commons Attribution 3.0 Unported Licence
A furosemide–isonicotinamide cocrystal: an investigation of properties and extensive structural disorder†
Hannah E.
Kerr
a,
Lorna K.
Softley
a,
Kuthuru
Suresh
c,
Ashwini
Nangia
*c,
Paul
Hodgkinson
*a and
Ivana Radosavljevic
Evans
*ab
aDepartment of Chemistry, Durham University, Science Site, Durham DH1 3LE, UK. E-mail: paul.hodgkinson@durham.ac.uk; ivana.radosavljevic@durham.ac.uk
bBragg Institute, Australian Nuclear Science and Technology Organisation, New Illawarra Road, Lucas Heights, NSW, Australia
cSchool of Chemistry, University of Hyderabad, Central University P.O., Prof. C. R. Rao Road, Hyderabad 500 046, India. E-mail: ashwini.nangia@gmail.com
First published on 30th July 2015
Abstract
Furosemide is a loop diuretic drug marketed in solid form which suffers from low solubility and low permeability. The pharmaceutically relevant properties of a recently described furosemide–isonicotinamide 2![[thin space (1/6-em)]](https://www.rsc.org/images/entities/char_2009.gif) :1 cocrystal (2FS–INA) were investigated and compared with those of other known furosemide cocrystals. The intrinsic dissolution rate of 2FS–INA was found to be very similar to that of commercial FS, while its equilibrium solubility was 5.6 times higher than that of pure FS. The extensive structural disorder in 2FS–INA observed by diffraction methods was also investigated by variable-temperature solid-state NMR in conjunction with first principles calculations. 15N NMR confirmed the absence of proton disorder in the short OH⋯N hydrogen bond. The disordered sulphonamide group was found to be dynamic by variable temperature 2H experiments, involving fast exchange of the sulphonamide NH2 protons combined with a rotation of the whole sulphonamide group about the C–S bond. The disorder of the furan rings of both the unique furosemide molecules was also found to be dynamic by 13C experiments, with approximately the same activation barrier for both rings.
:1 cocrystal (2FS–INA) were investigated and compared with those of other known furosemide cocrystals. The intrinsic dissolution rate of 2FS–INA was found to be very similar to that of commercial FS, while its equilibrium solubility was 5.6 times higher than that of pure FS. The extensive structural disorder in 2FS–INA observed by diffraction methods was also investigated by variable-temperature solid-state NMR in conjunction with first principles calculations. 15N NMR confirmed the absence of proton disorder in the short OH⋯N hydrogen bond. The disordered sulphonamide group was found to be dynamic by variable temperature 2H experiments, involving fast exchange of the sulphonamide NH2 protons combined with a rotation of the whole sulphonamide group about the C–S bond. The disorder of the furan rings of both the unique furosemide molecules was also found to be dynamic by 13C experiments, with approximately the same activation barrier for both rings.
Introduction
Furosemide (Fig. 1) is a loop diuretic used to treat edema and hypertension linked to congestive heart failure, cirrhosis of the liver and renal disease, by preventing reabsorption of unneeded water back into the body.1 The drug is available in solid tablet form to be taken orally, or as a solution to be injected into the body.2 The orally administered form of FS is a BCS class IV drug, having low aqueous solubility (6 mg L−1 in water) and low permeability.3 The absorption of FS is site-specific to the stomach and small intestine where it has lowest solubility, thus bioavailability of the drug is limited, as well as being widely variable between individuals. High doses or prolonged use of the drug can lead to fluid and electrolyte imbalance which can provoke headaches, cramping, thirst and weakness.4 Therefore development of this drug to improve its solubility is important to be able to minimise the dose size in order to reduce side effects. The poor solubility of FS is reportedly linked to strong intra- and inter- molecular hydrogen bonding in the pure crystal, resisting facile solvation, and its weakly acidic nature.5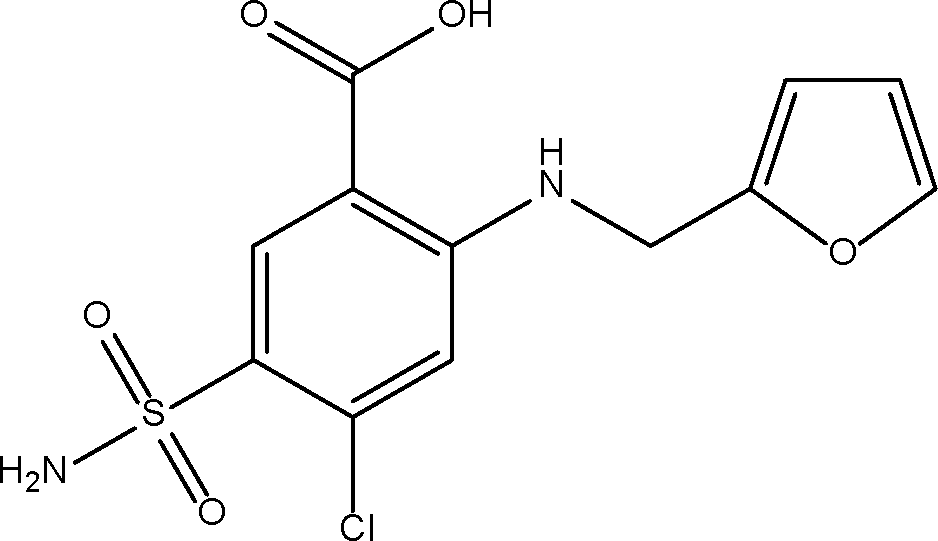 | ||
| Fig. 1 The molecular structure of furosemide. | ||
There have been numerous successful attempts to improve the properties of FS. Mesoporous materials, such as SBA-15 containing silica walls with large pores, have been used as drug delivery systems to improve the release of FS in site-specific areas. The large surface area resulting from the pores allow facile adsorption of FS onto its surface via weak interactions (allowing rapid drug release), while the silanol groups provide hydrophilic character to carry and deliver the drug in aqueous media.5 Alternatively, surfactant-based methods have been used in self-(micro)emulsifying formulations which contain a mixture of oil, surfactant and hydrophilic cofactant. The formulation is able to form an oil/water emulsion in the stomach or intestine. A solid form of the formulation, loaded with FS, has been seen to improve both permeability and solubility of the drug.6 Most recently, improved solubility has been achieved in Na and K salts of FS.7 Finally, numerous cocrystals of FS with a range of coformers, as well as cocrystal polymorphs, hydrates and solvates have been reported.3,8–12
The FS molecule contains potential hydrogen bond donor and acceptor groups: COOH, NH and SO2NH2, and additional potential for halogen bonding from chlorine. The groups COOH and SO2NH2 are known to give robust heterosynthons via O–H⋯O and N–H⋯O hydrogen bonds, forming a wide range of stable supramolecular structures. The propensity for hydrogen bonding enables FS to exist in different polymorphic forms, of which three have been reported.13 Polymorphism is a result of the combination of functional groups to form different synthons, as well as the conformational flexibility about the sulphonamide and furan torsion angles. Higher dissolution rates were observed with the metastable polymorphs, but their use as a marketable drug is limited by their tendency to convert to the stable polymorph during experiments or storage.13
To date, six FS cocrystals (not including hydrates or solvates) with a range of coformers have been prepared and fully structurally characterised.3,8,12 In all cases studied, solubility was improved over pure FS. The only crystal form for which the pharmacologically relevant properties have not been reported is the 2FS–INA cocrystal, which is reported here.
The coformers and synthons relevant to the FS cocrystal structures are summarised in Fig. 2 and Table 1. FS–CAF and FS–CYT crystallise in the triclinic space group P![[1 with combining macron]](https://www.rsc.org/images/entities/char_0031_0304.gif) . FS–CYT is distinct from the other structures due to the occurrence of proton transfer in synthon N to form the strong, electrostatic hydrogen bond COO−⋯+HN, and so is more appropriately described as a salt. There is no proton transfer in FS–CAF; hierarchical hydrogen bonding means that synthon E is the strongest interaction. The three pyridine carboxamide-based cocrystals (FS–NA, FS–INA and 2FS–INA) all crystallise in the monoclinic space group P21/n, but have distinctly different structures, despite sharing the same functional groups for potential hydrogen bonding. Synthon E is common to all three cocrystals, but the remaining synthons differ as a result of isomeric change of the coformer or stoichiometry. The molecules in FS–PABA form homodimers via synthon A, which are connected by a weak interaction via synthon K.
. FS–CYT is distinct from the other structures due to the occurrence of proton transfer in synthon N to form the strong, electrostatic hydrogen bond COO−⋯+HN, and so is more appropriately described as a salt. There is no proton transfer in FS–CAF; hierarchical hydrogen bonding means that synthon E is the strongest interaction. The three pyridine carboxamide-based cocrystals (FS–NA, FS–INA and 2FS–INA) all crystallise in the monoclinic space group P21/n, but have distinctly different structures, despite sharing the same functional groups for potential hydrogen bonding. Synthon E is common to all three cocrystals, but the remaining synthons differ as a result of isomeric change of the coformer or stoichiometry. The molecules in FS–PABA form homodimers via synthon A, which are connected by a weak interaction via synthon K.
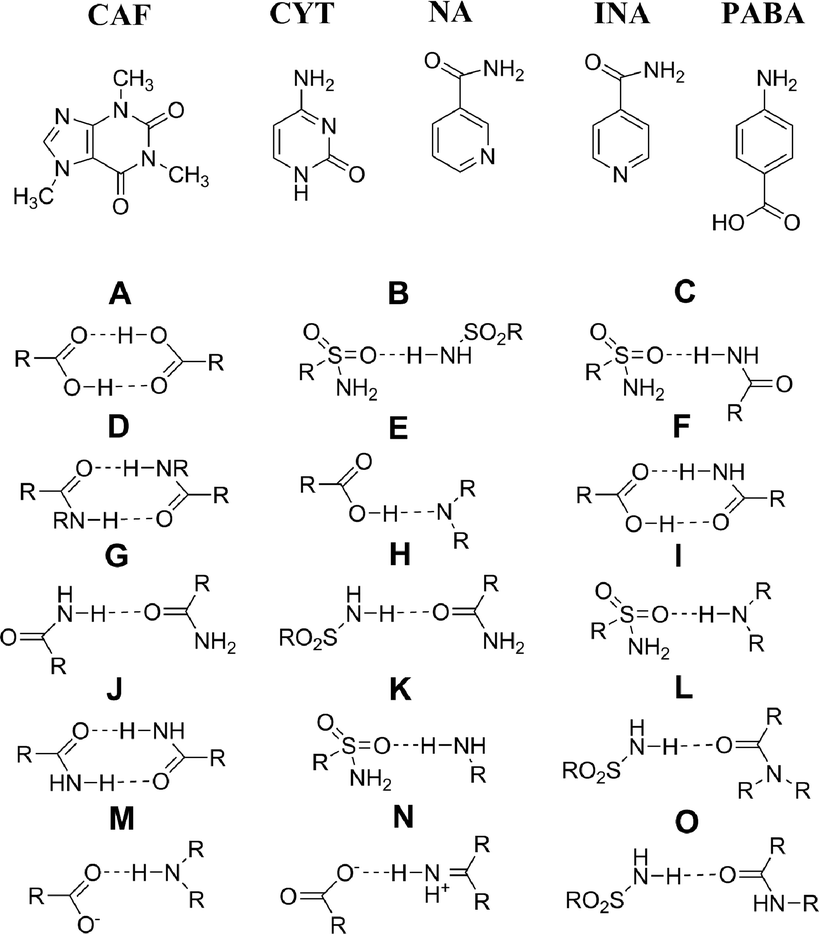 | ||
| Fig. 2 The coformers in structurally characterised FS cocrystals and the synthons present in FS cocrystals. | ||
The structural flexibility to which FS owes its rich supramolecular chemistry can also manifest itself as crystallographic disorder, as evidenced in a number of the known solid forms. The crystal structure of FS form II possesses one unique FS molecule with the furan ring disordered over two positions (differing by an angle of 172° between the ring planes) with 0.75:0.25 occupancies at 298 K. The structure of form I was initially solved with similar disorder, but further analysis revealed the true structure to have a doubled unit cell containing two FS molecules that differed only in the furan ring orientation.13 Several cocrystals of FS also show ring disorder.14–16 For example, the structure of FS–CAF was solved at 100 K with the ring disordered over two positions (differing by an angle of 175° between the ring planes) with equal occupancy.15 Disorder of the whole SO2NH2 sulphonamide group is not commonly observed in FS crystal forms, presumably because this group is usually involved in hydrogen bonding networks, as evidenced by a systematic study of aromatic primary sulphonamide pyridine-N-oxides synthons.14 It has been noted, however, that the NH2 of the sulphonamide can adopt different orientations through rotations about the S–N bond in FS13 and FS-containing cocrystals,9 indicating that there is conformational flexibility.
The recently reported 2FS–INA cocrystal exhibits a particularly complex disorder, which affects both crystallographically unique FS molecules (FS1 and FS2, see Fig. 3), both the sulphonamide group and the furan ring, and potentially a short strong hydrogen bond.8 This single crystal X-ray diffraction study was carried out at 120 K. The sulphonamide group on FS1 is disordered over two positions with 0.51(1):0.49(1) occupancies, differing by a 32° rotation about the C–S bond. The furan ring on FS2 was modelled using split atomic sites, as disordered over two positions with 0.67(2):0.33(2) occupancies. The furan ring on FS1 could be modelled satisfactorily using single atomic sites, albeit with the anisotropic atomic displacement parameters somewhat elongated in a direction perpendicular to the ring. A further interesting feature of the 2FS–INA structure is the presence of a short strong hydrogen bond (SSHB) between the COOH on FS1 and the ring nitrogen of INA (donor acceptor distance, rOH–N = 2.546 Å), similar in length to the NH⋯O SSHB found in 3,5-pyridinedicarboxylic acid, which showed temperature-dependent proton migration across the SSHB,17,18 demonstrating the potential for proton dynamics in 2FS–INA.
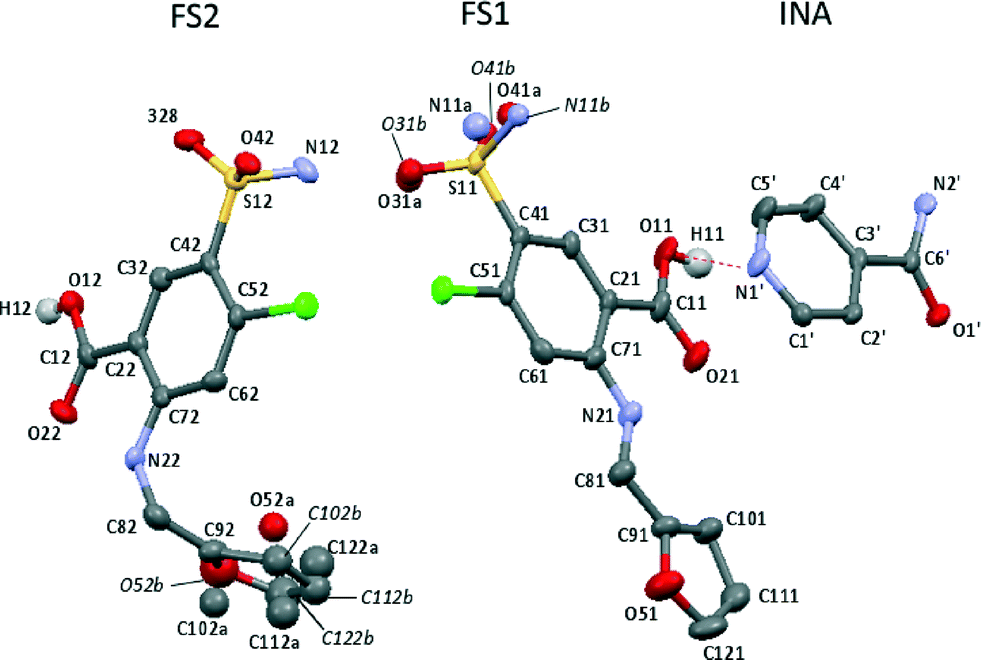 | ||
| Fig. 3 The asymmetric unit of 2FS–INA with the major occupied furan ring and sulphonamide positions drawn as free atoms. The SSHB is shown by the dashed red line and with hydrogen atoms are removed for clarity except for those on the carboxylic acids. Thermal ellipsoids are shown at the 50% probability level. FS site numbering follows that of ref. 13 with labels followed by 1 or 2 to distinguish FS1 and FS2. A trailing apostrophe identifies INA sites. | ||
Previous X-ray diffraction studies provided an average structural picture for 2FS–INA at a single temperature. Solid-state NMR is highly complementary to X-ray diffraction, particularly for characterising polymorphic behaviour and disorder in pharmaceutically relevant materials.19–21 In particular, NMR relaxation times and 2H NMR spectra are very sensitive to dynamic processes.22,23 Here we use 13C, 2H and 15N solid-state NMR, supported by DFT calculations, to elucidate the nature of three different aspects of structural disorder in this furosemide crystal form.
Experimental
Synthesis
The polycrystalline sample of the 2FS–INA cocrystal was prepared by a solvent-assisted mechanochemical route. Stoichiometric quantities of FS (264 mg, 0.800 mmol) and INA (48.8 mg, 0.400 mmol) were weighed out and ground in a mortar and pestle, with dropwise addition of a total of 2.5 mL of acetone over 30 minutes of grinding. The phase purity of the material prepared was confirmed by powder X-ray diffraction (PXRD). XRD data were collected on a Bruker D8 ADVANCE diffractometer (Cu Kα1,2 radiation) and a LynxEye detector, in a 2θ range between 2° and 60° and using a step size of 0.014°. Data analysis was carried out using Topas-Academic software.24 An extensive characterisation (including PXRD, solid-state 13C NMR spectra of the individual components and the product, as well as differential scanning calorimetry data), showing that this method produces a single phase 2FS–INA cocrystal, has been reported previously.8Dissolution and solubility experiments
Intrinsic dissolution rate (IDR) and solubility tests were carried out on the 2FS–INA cocrystal. Due to the low solubility of FS in aqueous media, the tests were carried out in 10% ethanol–water. The absorbance of known amounts of 2FS–INA dissolved in a 10% v/v ethanol–water medium were measured at the given λmax 329 nm on a Thermo Scientific Evolution 300 UV-vis spectrometer (Thermo Scientific, Waltham, MA), and these absorbance values used to obtain the molar extinction coefficient for 2FS–INA in solution. The IDR experiments were carried out using a United States Pharmacopeia (USP) certified Electrolab TDT-08L dissolution tester (Electrolab, Mumbai, MH). Dissolution experiments were performed for 6 hours in 10% ethanol–water medium at 37 °C. For IDR measurements, 100 mg of the compound was taken in the intrinsic attachment and compressed to a 0.5 cm2 disc using a hydraulic press at pressure of 4.0 ton inch−2 for 5 min. The intrinsic attachment was placed in a jar of 500 mL 10% ethanol–water medium preheated to 37 °C and rotated at 150 rpm. 5 mL aliquots were collected at specific time intervals and concentration of the aliquots were determined with appropriate dilutions from the predetermined standard curves of the respective compounds. The effective IDR (mass dissolved per unit area and time) was calculated for each interval between measurement points and averaged. The equilibrium solubility 2FS–INA was measured using the Higuchi and Connor method.25 An excess amount of the sample was added to 5 mL of 10% ethanol–water medium. The supersaturated solution was stirred at 300 rpm using a magnetic stirrer at 30 °C. After 24 h, the suspension was filtered through Whatmann 0.45 μm syringe filter. The identity of the undissolved material after the dissolution and equilibrium solubility experiments was ascertained by PXRD.Solid-state NMR
High-resolution solid-state NMR spectra were obtained using a Bruker Avance III HD spectrometer operating at 125.67 MHz for 13C and 76.71 MHz for 2H with a 4 mm (rotor o.d.) magic angle spinning (MAS) probe and 50.64 MHz for 15N with a 5 mm (rotor o.d.) probe. 15N spectra were recorded at ambient probe temperature, while 13C and 2H spectra were recorded at temperatures between 80 °C and −70 °C. Note that these were set temperatures and, unless stated otherwise, do not include sample heating under MAS, which was estimated to be +10 °C, +15 °C, and +5 °C for the 13C, 2H, and 15N experiments respectively.13C spectra were obtained using either direct excitation or cross polarization (CP) with sideband suppression26 at 8 kHz MAS (5 kHz MAS for spectra recorded below −20 °C), with a recycle delay of 1 second in the direct excitation experiment and 10–35 s in the CP experiments, depending on temperature. The contact time was 4 ms, acquiring over 48–180 transients. SPINAL64 with 78 kHz 1H nutation rate was used for heteronuclear decoupling. Spectra were referenced by setting the carbonyl resonance of replacement sample of α-glycine to 176.5 ppm. Dipolar dephasing spectra were acquired with a dephasing delay of 80 μs. T1 relaxation times were measured using a saturation-recovery scheme with 20 saturation pulses separated by a delay of 10 ms at 8 kHz MAS, where the τ delay was varied between 0.05–3 s in 25 steps. The peak heights were picked using the Topspin T1/T2 module and fitted to a single decaying exponential function in QtiPlot.27
1H-13C heteronuclear correlation spectra were recorded using Lee–Goldburg CP with 109 kHz 1H nutation frequency at 9.5 kHz MAS under the following conditions: recycle delay 10 s, contact times of 0.2 ms and 1 ms over 64t1 increments using 128 transients. An FSLG pulse train was used for homonuclear decoupling, while SPINAL64 was used for heteronuclear decoupling during acquisition.
The 15N spectrum was recorded using CP and 8 kHz MAS with the following conditions: 30 s recycle delay and 4 ms contact time acquiring over 8640 transients. SPINAL64 with 55.6 kHz 1H nutation rate was used for heteronuclear decoupling and the spectrum was referenced by setting the signal from an external sample of 15N-labelled α-glycine to −346.8 ppm. An apodization function corresponding to 60 Hz Lorentzian line broadening was applied prior to Fourier transformation.
Selective deuteration of the most labile protons was achieved by storage in a D2O atmosphere for two weeks. The samples were then kept sealed in a rotor to minimise exchange with H2O in air. 2H spectra were recorded using a simple pulse-acquire scheme without decoupling at 10 kHz MAS, with a 1 s recycle delay and acquiring over 100 transients. T1 relaxation times were measured using a saturation-recovery scheme with 20 saturation pulses separated by a delay of 0.2 ms at 10 kHz MAS without decoupling, where the τ delay was varied between 0.0001–2 s in 30 steps. The peak heights were picked and fitted using the Topspin T1/T2 module. Band shape analysis of the spinning sideband manifolds was performed in GSim28/pNMRsim29 by simultaneously fitting the peak linewidths (using a Lorentzian shape function) and quadrupolar parameters for each resolved site. Flat baselines, necessary for fitting, were achieved using the spline baseline correction in Topspin. Spectra were also acquired from a sample that had been deuterated by shaking in D2O for ten minutes followed by storage in a D2O atmosphere, but the cocrystal was unstable in slurry in D2O and the results were not reproducible (Fig. S6 of the ESI†).
Computational methods
First principles computations were carried out using the GIPAW method implemented in CASTEP v6.0.30–32 In order to carry out calculations on the disordered cocrystal, the previously reported crystal structure8 was split into four in which one of each of the disordered groups' orientations (r1/r2 for the disordered ring and s1/s2 for the disordered sulphonamide) was deleted, resulting in the four structures r1s1, r1s2, r2s1 and r2s2. All calculations were performed using the PBE functional33 using on-the-fly generated ultra-soft pseudopotentials. Geometry optimisations were carried out with the centre of mass fixed and a cut-off energy of 500 eV, with integrals taken over the Brillouin zone using a Monkhorst–Pack grid with a k-point sample spacing of 0.1 Å−1 (1 k-point). All 316 atom positions were optimised with the unit cell parameters fixed to the values determined by single crystal XRD. The behaviour of the SSHB in 2FS–INA was problematic in the geometry optimisations, with the proton being transferred in some of the calculations. Similar issues have been found with other GGA functionals.34,35 To avoid this, the proton was also fixed in position in the two problematic optimisations: r1s2-f and r2s2-f. Hydrogen atom-only optimisation was also carried out, but the maximum forces on the heavy atoms were two orders of magnitude larger than optimisation involving all atom positions and the ordering of predicted carbon chemical shift assignments was also found to match poorly with experimental data. NMR calculations used slightly tighter conditions with a cut-off energy of 600 eV and k-point sample spacing of 0.05 Å−1 (4 k-points) with an offset of (0.25, 0.25, 0.25) to avoid sampling the gamma point.Results and discussion
IDR and solubility of 2FS–INA cocrystals
The Intrinsic Dissolution Rate (IDR) is a time-dependent kinetic measurement of the rate of drug dissolution. The IDR of the 2FS–INA cocrystal is 44 × 10−3 mg cm−2 min−1, indistinguishable within experimental uncertainty from that of commercial FS (44 × 10−3 mg cm−2 min−1) over the 6 hour period of the measurement. The dissolution curves for pure FS and the 2FS–INA cocrystal, recorded over 6 hours, are shown in Fig. S1 in the ESI.† PXRD of the undissolved material after the IDR measurement confirmed cocrystal stability under these conditions. The apparent equilibrium solubility of 2FS–INA was found to be 5.6 times higher than that of pure FS. Note, however, that the cocrystal undergoes partial conversion into its components on the time-scale of the measurement (24 h), as demonstrated by PXRD, and so this figure is best regarded as an apparent solubility rather than true equilibrium solubility. The results of the dissolution and solubility tests on 2FS–INA and other previously characterised FS cocrystals are summarised in Table S1 in the ESI.†Disorder in the 2FS–INA cocrystal
The 13C spectrum shown in Fig. 4 reflects the fact that there are two FS molecules and one INA molecule in the asymmetric unit. Most of the carbon atoms are in aromatic environments causing the peaks to overlap; nevertheless, all the resolved peaks could be assigned. A combination of experiments were used to accomplish this: 13C dipolar dephasing to identify the quaternary carbon atoms, 1H-13C heteronuclear correlation spectra with both long and short contact times, and also predicted chemical shieldings from CASTEP calculations (details in the ESI†). No small peaks are observed in the 13C spectrum that could be assigned to the minor-occupied ring orientation. The broadening observed at 140–143 ppm is most likely to be due to the proximity of C51 and C52 to the quadrupolar chlorine atom.36–38 Minor reversible changes are seen in the 13C spectrum over the temperature range 70 °C to −50 °C (Fig. S6 in the ESI†), indicative of some dynamics, but the changes are subtle and hard to link to specific processes. Dynamic phenyl ring flipping of the INA conformer is not observed; C1′ and C5′ are observed as distinct peaks at all temperatures with no evidence of coalescence.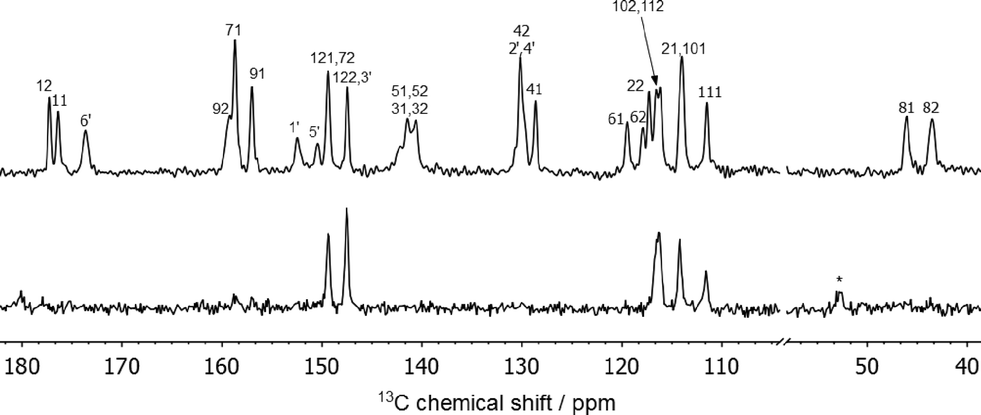 | ||
| Fig. 4 13C CPTOSS spectrum (top) and direct-excitation spectrum (bottom) of 2FS–INA at 8 kHz MAS with carbon atoms labelled as in Fig. 3. | ||
Fig. 5 shows the 15N spectrum and a comparison with calculated 15N chemical shifts for the structures in which the CASTEP geometry optimisation transferred H11 across the SSHB to the INA molecule (red) and where H11 was constrained to the position obtained from single crystal X-ray diffraction (green). The calculated shieldings were converted to chemical shifts using δiso = σref − σiso, where σiso is the CASTEP-calculated shielding value and σref was calculated to equate the average calculated shift and average experimental shift39 (σref was −161.7 ppm when H11 was transferred to INA and −169.0 ppm when H11 was fixed). The experimental shifts of the four overlapped peaks were estimated by spectral deconvolution. The experimental shift of N1′ (−116.0 ppm) is a much better match with the predicted shift range when H11 is associated with the FS1 molecule and not when proton transfer had occurred. This shows that H11 is associated with only FS1 and not the INA (supporting the XRD data), nor is the position averaged over fast transfer. The CASTEP-calculated difference in chemical shift upon protonation of the INA molecule is 36.3 ppm. This is within the experimental range found for a cocrystal/salt transition. For example, protonation of INA in a salt with 2,4,6-hydroxybenzoic acid compared to a cocrystal with 4-hydroxy-3-nitrobenzoic acid results in a change in chemical shift of −68.8 ppm, while the 15N shift in a 3,5-dinitrobenzoic acid salt compared to a cocrystal with 4-aminobenzoic acid is 18 ppm.40 Such changes in chemical shift would be expected to be observed in the experimental spectrum.
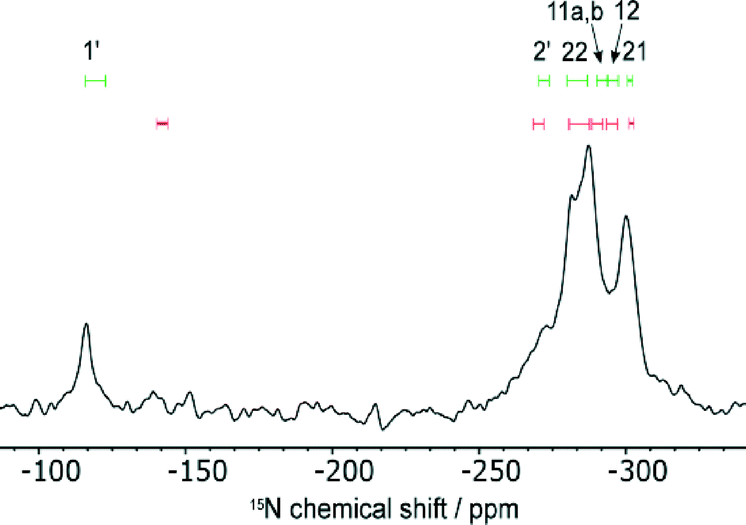 | ||
| Fig. 5 15N spectrum of 2FS–INA at 8 kHz MAS. Overlaid are the calculated 15N shieldings for H11 associated with FS1 (green, top) and transfer of H11 to INA (red, bottom) where the length of the line represents the spread of calculated chemical shifts for the different disorder structures. | ||
The 15N spectrum is too heavily overlapped to draw conclusions about the disorder. On the other hand, the deuterium spectrum is less crowded and the disordered sulphonamide group can be investigated explicitly. As shown in Fig. 6, the shape of the deuterium spectra clearly change with temperature, with the bands broadening as the temperature is lowered to −60 °C. The change in linewidth of the disordered sulphonamide peak was particularly notable and indicative of the freezing out of a dynamic process at low temperature (see Fig. S9 of the ESI† for further discussion). The loss in signal intensity on cooling is due to the noted broadening and all changes are reversible. A representative example of the fitting of the spectra to obtain the quadrupolar parameters is given in Fig. S8 of the ESI.†
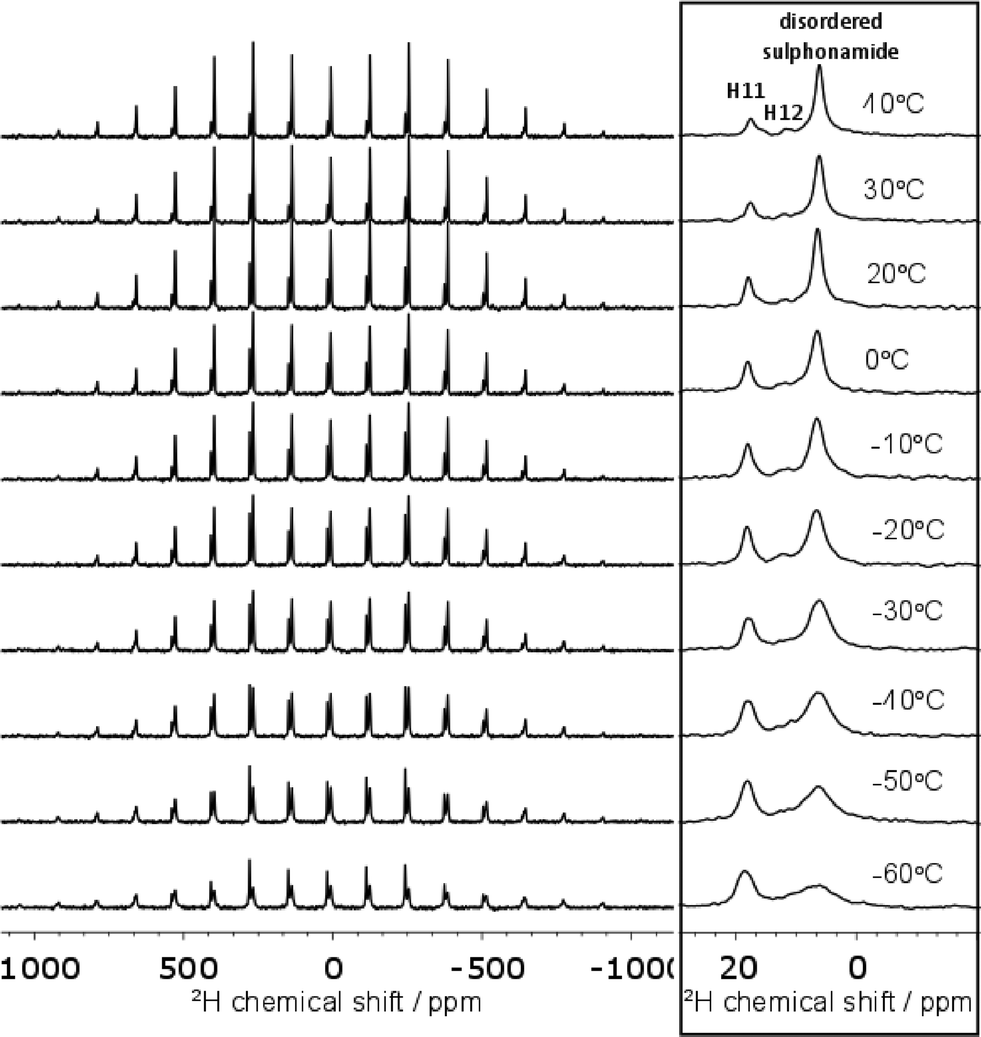 | ||
| Fig. 6 Variable temperature 2H spectra at 10 kHz MAS. The centre-band of each spectrum is shown on the right. Baselines were corrected for this figure using the Whittaker Smoother in MestReNova. | ||
Table 2 shows that H12 and H11 are fit with rather different CQ values, with the H11 value being markedly low. Chiba, and others, have reported that reducing the donor–acceptor distance (rD–A) in a hydrogen bond lowers the CQ parameter,41–44 which correlates with the finding that CQ(H11) < CQ(H12); rD–A(H11) is 2.546 Å while rD–A(H12) is 2.619 Å by single crystal XRD. Most studies of HBs in molecular solids typically include a variety of types of hydrogen bonds with different strengths, which limits the use of the data in determining quantitative trends in CQ with structural parameters.43 While quadrupolar parameters have been quantitatively correlated with hydrogen bond geometry individual cases, such as an isolated molecule containing a C![[double bond, length as m-dash]](https://www.rsc.org/images/entities/char_e001.gif) O⋯HO hydrogen bond, in which η was shown to be more sensitive to bond angles than rD–A,45 these are not directly relevant to H11 which is in an N⋯HO hydrogen bond.
O⋯HO hydrogen bond, in which η was shown to be more sensitive to bond angles than rD–A,45 these are not directly relevant to H11 which is in an N⋯HO hydrogen bond.
| Deuterium site | −50 °C | 20 °C | 40 °C | CASTEP averageb | ||||
|---|---|---|---|---|---|---|---|---|
| C Q/kHz | η | C Q/kHz | η | C Q/kHz | η | C Q/kHz | η | |
| a One-standard deviation uncertainties are given in parentheses, although these are likely to be underestimated. The −60 °C spectrum could not be fitted satisfactorily due to the broadening of the sulphonamide and H12 peaks. b Full details of CASTEP-calculated values are given in Table S4 in the ESI. c Structures showing proton transfer of H11 are not included in the CASTEP average. | ||||||||
| Sulphonamide | 88.4(6) | 0.51(2) | 87.1(2) | 0.417(6) | 87.8(2) | 0.421(7) | 222 | 0.16 |
| H12 | 170(2) | 0.22(5) | 161(2) | 0.34(4) | 168(2) | 0.26(5) | 138 | 0.16 |
| H11c | 68.8(5) | 0.39(3) | 78.9(5) | 0.34(3) | 81.0(9) | 0.32(5) | 48 | 0.52 |
The CASTEP-calculated CQ and η values for H12 and H11 are comparable with the experimental fits. However, the calculated CQ of the disordered sulphonamide site is around 2.5 times larger than the values determined from the −50 °C data. This can only be explained in terms of extensive dynamics. NH2 dynamics have previously been studied in pure FS by monitoring 1H relaxation times and were described in terms of hindered NH2 jumps that were rapid at ambient temperature.46 Estimating the underlying quadrupolar parameters from the average of the CASTEP-calculated parameters, i.e. CQ = 222 kHz, η = 0.16, and averaging the tensor over a 112° jump (corresponding to exchange of the two hydrogens of the NH2) gives values which are still too high, CQ = 112 kHz, η = 0.66. Values that are more consistent with the experimental results are obtained if the tensor is averaged successively over two jump motions. As an illustrative example, jumps of both 112° and 40° give CQ = 89 kHz, η = 0.57 and jumps of both 112° and 30° give CQ = 100 kHz, η = 0.61. This is consistent with the magnitude of the angle measured crystallographically between the two disordered sulphonamide positions. The quadrupolar parameters are also affected by high frequency librational motions,47 and the actual atomic motion at ambient temperature will be more complex than instantaneous jumps between discrete sites. We can still conclude that the observed deuterium quadrupolar parameters are consistent with rapid rotations between the two orientations of the sulphonamide observed by XRD plus exchange of the hydrogen sites on the NH2, both at a relatively high frequency (at least 100 s kHz at ambient temperature). It should also be noted that the dynamic sulphonamide groups are relatively close to each other (rNH2−NH2 between sulphonamide groups in two orientations of FS1 = 2.452 Å), and so the motion may be further complicated by correlation between the orientations.
Complementary information is provided from the temperature dependence of the 2H T1 relaxation times. The relaxation data was fitted (see Fig. 7) to direct calculations of the 2H relaxation rate under MAS using a simple two-site jump model48 and the CASTEP-calculated CQ of 222 kHz. Using an Arrhenius-type model for the temperature dependence of the jump correlation time with temperature, τc = τ0exp(Ea/kT), the fit shown corresponds to log10(τ0/s) = −12.0 ± 0.1, Ea = 16.7 ± 0.7 kJ mol−1 and a jump angle of 26.5 ± 0.5°. The one standard deviation errors bars are based on an averaged uncertainty of the fitted T1 values of 0.7 ms. Note that including a correction for sample heating due to MAS results in a slight increase in the fitted Ea (from 14.9 kJ mol−1) and only marginal effect on the other fitting parameters. These values should, however, be treated with caution since the actual molecular motion is likely to be more complex. The non-zero asymmetry of the 2H site was not accounted for since the expressions of Torchia and Szabo49 assume η = 0, but this will not have a significant impact. This fitting corresponds to a τc at 298 K of 86 × 10−11 s, and so an effective jump rate, 1/τc, of 1.2 GHz, consistent with observing an averaged CQ in the 2H spectrum. The fitted activation barrier is somewhat smaller than the activation energy of the hindered NH2 jumps measured in pure FS (31 kJ mol−1),46 but is consistent with essentially the same basic process being involved. The estimated jump rate at −60 °C is 80 MHz and it is likely that the broadening of the 2H spectrum in Fig. 6 at low temperature is associated with freezing out some aspect of the sulphonamide dynamics.
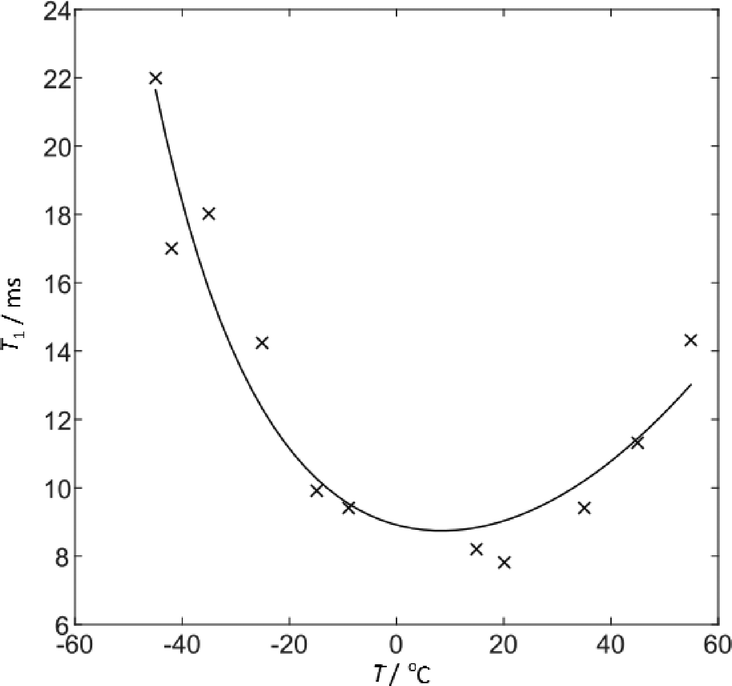 | ||
| Fig. 7 Sulphonamide 2H T1 relaxation time constant as a function of temperature fit to a two-site jump model with an Arrhenius-type temperature dependence of the jump rate. Temperatures include a correction of +15 °C for sample heating due to MAS. | ||
The 13C CPTOSS spectrum in Fig. 4 is too strongly overlapped to provide clear conclusions about the ring disorder, and 2D 1H-13C HETCOR and 1H DQ/SQ experiments were also inconclusive (see ESI† for more details). However, in a direct excitation experiment with a short recycle delay to select only dynamic carbon sites only the carbon atoms of both furan rings are observed (bottom of Fig. 4). This indicates that both furan rings are dynamically disordered.
As anticipated from the direct excitation spectrum, the 13C T1 relaxation times for the furan ring carbon atoms are significantly shorter than those of the other carbon sites (see Table S5 of the ESI† for the full data). Since T1 relaxation of is driven by motion on the order of the NMR frequency of the spins involved, this implies that these carbon sites are dynamic at rates of the order of 125 MHz at ambient temperature. The magnitude and the temperature dependence of the 13C T1 times, Fig. 8, is similar between the two furan rings, suggesting that similar processes are involved. The variable temperature data can be fitted using expressions for dipolar relaxation in solid sample due to rotational diffusion on a cone49 to yield the parameters given in Table 3.
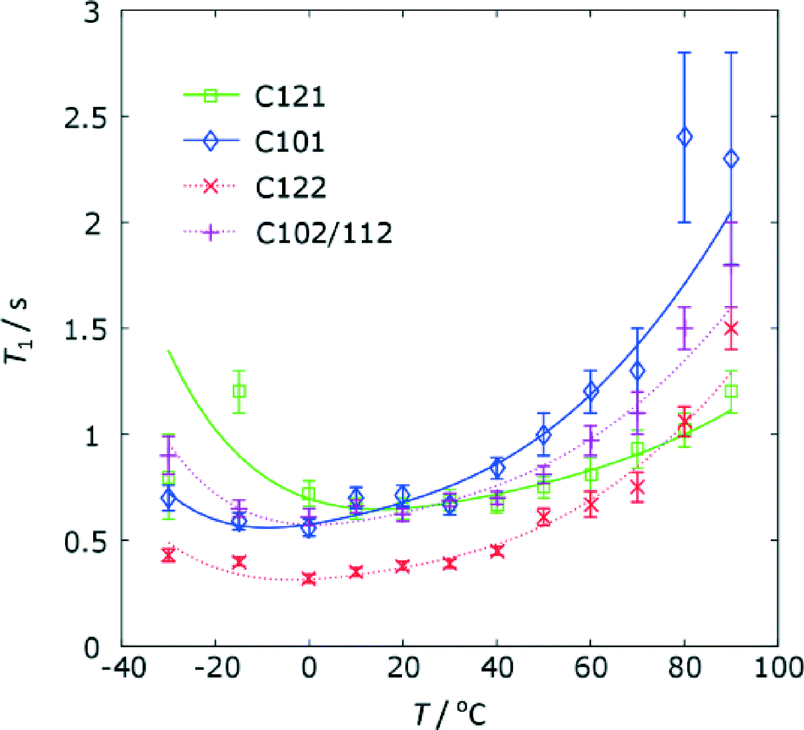 | ||
| Fig. 8 The temperature dependence of the 13C T1 relaxation times for the furan rings on FS1 and FS2. Temperatures include a correction of +10 °C for sample heating due to MAS. | ||
| E a/kJ mol−1 | logτ0 |
Cone angle/degrees | ||
|---|---|---|---|---|
| a 13C T1 data for C111 could not be satisfactorily fit due to the low signal intensity. | ||||
| FS1 | C121 | 20(2) | −12.7(3) | 19.8(5) |
| C101 | 22(1) | −13.3(2) | 21.6(4) | |
| FS2 | C122 | 25(1) | −13.7(2) | 31.9(9) |
| C102/C112 | 22(1) | −13.2(2) | 21.3(4) | |
Given the simple model used, the agreement between motional parameters for the carbon atoms of the same ring is quite satisfactory. The differences in parameters between the rings are generally not statistically significant, although the cone angle for C12 is arguably larger (corresponding to a greater motional amplitude) in FS2 compared to FS1.
In the structure determination from single crystal X-ray diffraction, resolved electron density in the difference Fourier map prompted the modelling of the FS2 ring using split atomic sites and isotropic thermal parameters, while the FS1 furan ring was modelled with single atomic sites and anisotropic atomic displacement parameters (ADPs). As seen in Fig. 3, the resulting ADPs are slightly elongated along one axis, suggesting the presence of small amplitude dynamics. It is important to note, however, that an essentially equally good fit to the experimental XRD data can be obtained using single sites and anisotropic ADPs to describe both furan rings, as shown in Fig. S11.† In this fit, the ring disorder on FS1 and FS2 appears very similar, with only a subtle difference in amplitude. In other words, in this case a single-temperature XRD experiment was unable to distinguish between small and large amplitude re-orientations of the ring. As discussed above, the calculated 13C chemical shifts are also not particularly sensitive to the orientation of the ring, and it is the relaxation data that strongly suggests that both FS1 and FS2 are likely to be undergoing similar small amplitude motion.
Conclusions
The pharmaceutically relevant properties of the furosemide–isonicotinamide 2:1 cocrystal, 2FS–INA, have been investigated. The intrinsic dissolution rate of 2FS–INA was the same as that of commercial FS, and its apparent equilibrium solubility was 5.6 times higher. Like most other characterised furosemide cocrystals, however, 2FS–INA underwent a partial conversion into its components over 24 hours of the solubility measurement. All reported FS cocrystals, and in this paper 2FS–INA cocrystal, have much higher apparent solubility than FS.
Three specific questions concerning the extensive structural disorder in the 2FS–INA cocrystal, posed by the previous single crystal low-temperature X-ray diffraction study, have been investigated using variable-temperature solid-state nuclear magnetic resonance spectroscopy supported by first principles calculations: the nature of the disorder of the sulphonamide group, the furan ring, and the potential proton disorder in a short strong hydrogen bond.
No evidence for dynamic proton transfer in the short OH⋯N hydrogen bond was found. The disorder on the sulphonamide group could be readily probed using variable temperature 2H experiments and was found to be consistent with fast exchange of the NH2 protons as well as a rotation of the whole sulphonamide group about the C–S bond. The empirical activation energy for this process is estimated to be 17 kJ mol−1, although the motion is expected to be more complex than a simple two-site jump. A direct excitation 13C spectrum showed that the carbon atoms on the furan rings of both unique FS molecules had short relaxation times, and 13C spin–lattice relaxation times measured as a function of temperature provided estimates for the energy barriers to rotation of the two furan rings, which were found to be the same within experimental uncertainty.
In general terms, this work illustrates the complementarity of diffraction and NMR in studying structural disorder. While disorder can be readily observed by diffraction methods and in certain cases some insight into its nature can be gained from careful variable-temperature experiments analysed using the translation-libration-screw (TLS) formalism,50 the quality of diffraction data generally deteriorates as the temperature is raised. In contrast, dynamic disorder at ambient temperatures often simplifies NMR spectra by sharpening lines and shortening relaxation times. Hence NMR aided by DFT calculations provides a straightforward way to establish the nature of disorder and provide quantitative information on the relevant processes.
Acknowledgements
H. E. K. is supported by an EPSRC Doctoral Training Grant studentship. K. S. thanks UGC for a fellowship and DST (IRPHA and PURSE) and UGC (UPE grant) are thanked for providing instrumentation and infrastructure facilities at University of Hyderabad (UOH). I. R. E. thanks ANSTO for the visiting researcher post support.References
- http://www.drugbank.ca/drugs/DB00695, last accessed, 2015.
- http://www.nhs.uk/medicine-guides, last accessed, 2015.
- N. R. Goud, S. Gangavaram, K. Suresh, S. Pal, S. G. Manjunatha, S. Nambiar and A. Nangia, J. Pharm. Sci., 2012, 101, 664 CrossRef CAS PubMed.
- G. E. Granero, M. R. Longhi, M. J. Mora, H. E. Junginger, K. K. Midha, V. P. Shah, S. Stavchansky, J. B. Dressman and D. M. Barends, J. Pharm. Sci., 2010, 99, 2544 CrossRef CAS PubMed.
- V. Ambrogi, L. Perioli, C. Pagano, F. Marmottini, M. Ricci, A. Sagnella and C. Rossi, Eur. J. Pharm. Sci., 2012, 46, 43 CrossRef CAS PubMed.
- A. Zvonar, K. Berginc, A. Kristl and M. Gasperlin, Int. J. Pharm., 2010, 388, 151 CrossRef CAS PubMed.
- U. B. R. Khandavilli, S. Gangavaram, N. R. Goud, S. Cherukuvada, S. Raghavender, A. Nangia, S. G. Manjunatha, S. Nambiar and S. Pal, CrystEngComm, 2014, 16, 4842 RSC.
- B. I. Harriss, L. Vella-Zarb, C. Wilson and I. R. Evans, Cryst. Growth Des., 2014, 14, 783 CAS.
- V. S. Minkov, A. A. Beloborodova, V. A. Drebushchak and E. V. Boldyreva, Cryst. Growth Des., 2014, 14, 513 CAS.
- V. K. Srirambhatla, A. Kraft, S. Watt and A. V. Powell, CrystEngComm, 2014, 16, 9979 RSC.
- D. Stepanovs and A. Mishnev, Acta Crystallogr., Sect. C: Cryst. Struct. Commun., 2012, 68, o488 CAS.
- T. Ueto, N. Takata, N. Muroyama, A. Nedu, A. Sasaki, S. Tanida and K. Terada, Cryst. Growth Des., 2012, 12, 485 CAS.
- N. J. Babu, S. Cherukuvada, R. Thakuria and A. Nangia, Cryst. Growth Des., 2010, 10, 1979 CAS.
- N. R. Goud, N. J. Babu and A. Nangia, Cryst. Growth Des., 2011, 11, 1930 CAS.
- N. R. Goud, S. Gangavaram, K. Suresh, S. Pal, S. G. Manjunatha, S. Nambiar and A. Nangia, J. Pharm. Sci., 2012, 101, 664 CrossRef CAS PubMed.
- T. Ueto, N. Takata, N. Muroyama, A. Nedu, A. Sasaki, S. Tanida and K. Terada, Cryst. Growth Des., 2012, 12, 485 CAS.
- S. J. Ford, O. J. Delamore, J. S. O. Evans, G. J. McIntyre, M. R. Johnson and I. R. Evans, Chem. – Eur. J., 2011, 17 Search PubMed.
- I. Frantsuzov, S. J. Ford, I. R. Evans, A. J. Horsewill, H. P. Trommsdorff and M. R. Johnson, Phys. Rev. Lett., 2014, 113 Search PubMed.
- D. C. Apperley, R. K. Harris and P. Hodgkinson, Solid State NMR Basic Principles and Practise, Momentum Press: LLC, New York, US, 2012 Search PubMed.
- R. K. Harris, R. E. Wasylishen and M. J. Duer, NMR Crystallography, John Wiley & Sons Ltd: John Wiley & Sons Ltd, West Sussex, UK, 2009 Search PubMed.
- M. Geppi, G. Mollica, S. Borsacchi and C. A. Veracini, Appl. Spectrosc. Rev., 2008, 43, 202 CrossRef CAS PubMed.
- R. Tycko, Nuclear Magnetic Resonance Probes of Molecular Dynamics, Kluwer Academic Publishers, Dordrecht, Boston, US, 1994 Search PubMed.
- M. Chan-Huot, S. Wimperis, C. Gervais, G. Bodenhausen and L. Duma, ChemPhysChem, 2015, 16, 204 CrossRef CAS PubMed.
- A. A. Coelho, J. S. O. Evans, I. R. Evans, A. Kern and S. Parsons, Powder Diffr., 2011, 26, S22 CrossRef CAS.
- T. Higuchi and K. A. Connors, Adv. Anal. Chem. Instrum., 1965, 4, 117 CAS.
- W. T. Dixon, J. Schaefer, M. D. Sefcik, E. O. Stejskal and R. A. Mckay, J. Magn. Reson., 1982, 49, 341 CAS.
- I. Vasilef, QTIPLOT, Data Analysis and Scientific Visualisation, Universiteit Utrecht, Utrecht, Netherlands, 2013 Search PubMed.
- V. Zorin, A Visualisation and Processing Program for Solid State NMR, available from http://sourceforge.net/projects/gsim/, last accessed, 2015 Search PubMed.
- P. Hodgkinson, pNMRsim: a general simulation program for large problems in solid-state NMR, available from http://www.dur.ac.uk/paul.hodgkinson/pNMRsim, last accessed, 2015 Search PubMed.
- C. J. Pickard and F. Mauri, Phys. Rev. B: Condens. Matter Mater. Phys., 2001, 63 Search PubMed.
- S. J. Clark, M. D. Segall, C. J. Pickard, P. J. Hasnip, M. J. Probert, K. Refson and M. C. Payne, Z. Kristallogr., 2005, 220, 567 CrossRef CAS.
- J. Yates, C. Pickard and F. Mauri, Phys. Rev. B: Condens. Matter Mater. Phys., 2007, 76 Search PubMed.
- J. P. Perdew, K. Burke and M. Ernzerhof, Phys. Rev. Lett., 1996, 77, 3865 CrossRef CAS.
- A. D. Boese, ChemPhysChem, 2015, 16, 978 CrossRef CAS PubMed.
- J. Binns, M. R. Healy, S. Parsons and C. A. Morrison, Acta Crystallogr., Sect. B: Struct. Sci., 2014, 70, 259 CAS.
- R. K. Harris and A. C. Olivieri, Prog. Nucl. Magn. Reson. Spectrosc., 1992, 24, 435 CrossRef CAS.
- S. H. Alarcón, A. C. Olivieri and R. K. Harris, Solid State Nucl. Magn. Reson., 1993, 2, 325 CrossRef.
- R. K. Harris, M. M. Sünnetçioglu, K. S. Cameron and F. G. Riddell, Magn. Reson. Chem., 1993, 31, 963 CrossRef CAS PubMed.
- R. K. Harris, P. Hodgkinson, C. J. Pickard, J. R. Yates and V. Zorin, Magn. Reson. Chem., 2007, 45, S174 CrossRef CAS PubMed.
- J. S. Stevens, S. J. Byard, C. C. Seaton, G. Sadiq, R. J. Davey and S. L. Schroeder, Phys. Chem. Chem. Phys., 2014, 16, 1150 RSC.
- T. Chiba, J. Chem. Phys., 1964, 41, 1352 CrossRef CAS PubMed.
- T. Chiba, J. Chem. Phys., 1963, 39, 947 CrossRef CAS PubMed.
- R. Webber and G. H. Penner, Solid State Nucl. Magn. Reson., 2012, 47–48, 10 CrossRef CAS PubMed.
- R. Blinc and D. Hadži, Nature, 1966, 212, 1307 CrossRef CAS PubMed.
- G. W. Turner, R. L. Johnston and K. D. M. Harris, Chem. Phys., 2000, 256, 159 CrossRef CAS.
- J. N. Latosińska, M. Latosińska, W. Medycki and J. Osuchowicz, Chem. Phys. Lett., 2006, 430, 127 CrossRef PubMed.
- M. Dračínský and P. Hodgkinson, CrystEngComm, 2013, 15, 8705 RSC.
- D. C. Apperley, A. F. Markwell, I. Frantsuzov, A. J. Ilott, R. K. Harris and P. Hodgkinson, Phys. Chem. Chem. Phys., 2013, 15, 6422 RSC.
- D. A. Torchia and A. Szabo, J. Magn. Reson., 1982, 49, 107 CAS.
- V. Schomaker and K. N. Trueblood, Acta Crystallogr., Sect. B: Struct. Sci., 1968, 24, 63 CrossRef CAS.
Footnote |
| † Electronic supplementary information (ESI) available: Containing supporting ssNMR experiments as detailed in the text. Details of the raw data and fitting codes are available, see DOI: 10.15128/br86b3677. See DOI: 10.1039/c5ce01183c |
| This journal is © The Royal Society of Chemistry 2015 |