
 Open Access Article
 This Open Access Article is licensed under a
 Creative Commons Attribution 3.0 Unported Licence
Hydrogels formed from Fmoc amino acids†
Emily R.
Draper
a,
Kyle L.
Morris
b,
Marc A.
Little
a,
Jaclyn
Raeburn
a,
Catherine
Colquhoun
a,
Emily R.
Cross
a,
Tom. O.
McDonald
a,
Louise C.
Serpell
b and
Dave J.
Adams
*a
aDepartment of Chemistry, University of Liverpool, Crown Street, Liverpool, L69 7AZ, UK. E-mail: d.j.adams@liverpool.ac.uk
bSchool of Life Sciences, University of Sussex, Falmer, Brighton, BN1 9QG, UK
First published on 11th June 2015
Abstract
A number of Fmoc amino acids can be effective low molecular weight hydrogelators. The type of gel formed depends on the amino acid used and, in the case of FmocF, the final pH of the system. The single crystal structure of two of the gelators (FmocF and FmocY) have been determined and the data compared to the fibre X-ray diffraction data. FmocF, which forms metastable gels, crystallises easily and the data for the fibre phase and crystal phase are relatively similar. For FmocF, the fibre axis in b is consistent with the hydrogen bonding repeat distances and the diffraction pattern calculated from the single crystal structure is a good match with the experimental fibre X-ray diffraction data. On the other hand, there are significant differences between the crystalline phase determined and the fibre phase for FmocY. The packing of FmocY within the crystal structure is created by interactions between the planar Fmoc groups, whilst it is clear that hydrogen bonding drives the self-assembly into fibrillar structures within the gels. This shows that understanding the packing in gel phase by analogy to isolated crystal structures has the potential to lead to erroneous conclusions.
Introduction
Protected amino acids and dipeptides are now widely used as low molecular weight hydrogelators.1–4 The resulting gels have applications in cell culturing,2,5,6 sensing,7 encapsulation,8–10 and electronic materials.11 Even within this sub-class of gelator, a significant variety of structures have been examined, where typically the N-terminus of the amino acid or dipeptide is protected with a large aromatic group, for example, fluorenylmethoxycarbonyl (Fmoc), naphthalene, cinnamoyl, anthracene, carbazole, or pyrene. The gels that result from the self-assembly of the gelator are usually the result of the formation of an entangled network of fibres, which are typically a few tens of nanometres in diameter and can be microns in length.Despite the recent interest in these materials, it is not clear how the gelators pack within these self-assembled fibres. A model has been suggested for Fmoc-diphenylalanine,12 but it is unclear if this is applicable to all such gelators. An understanding of the packing is usually determined from a range of techniques, most often circular dichroism (which often reports that the aromatic protecting groups are in a chiral environment on self-assembly), fluorescence (which shows that significant packing of the aromatic protecting groups occurs) and microscopy. From these data, it is possible to compare between gelators. However, a definitive understanding of the packing is not possible. Another key question is why some molecules form gels, but structurally similar molecules do not, for example why Fmoc-phenylalanine-glycine forms a gel phase whilst Fmoc-glycine-phenylalanine does not.6
One approach to investigate this further is to examine single crystal phases of the gelators that are accessible. In many cases, this is done by determining the structure of crystals grown from solvents where no gel is formed.13 It is not clear that this is informative as presumably gelation occurs from a specific packing, which is directed by many non-covalent interactions. Moving to a different solvent will strongly perturb the balance of forces, and the observation that crystallisation as opposed to gelation occurs shows that the assembly is different. Another approach used to determine the structure of the gel phase is powder X-ray diffraction (pXRD), WAXS, or electron diffraction. For these techniques the gels can either be dried12,14–16 or, alternatively, the amorphous solvent background can be removed, in some cases leading to detectable diffraction.17 However, here it is not clear if the diffraction is from the gel phase, or from a minority crystalline phase (which will scatter significantly more intensely than an amorphous fibre phase). It has also been shown that in some cases how the gel is dried can affect the resulting diffraction pattern.14 Finally, in rare cases, crystals can form directly from the gel phase.18–23 Since the molecules were at one point in a fibre phase, it can be hypothesized that the packing in the resulting crystals might at the very least be related to the packing in the fibrous gel phase. However, it has been highlighted that this hypothesis should be treated with caution.24 For naphthalene-dipeptides for example, we have shown however that there is little similarity in scattering from diffraction from the resulting crystals as compared to data obtained from fibre X-ray diffraction.18,19
In an effort to investigate this further, we examine here perhaps the most structurally simple of this family of gelators, Fmoc-amino acids. These are commercially available, and a small subset have been previously described as low molecular weight gelators, either alone, or a part of a mixture with a second Fmoc-amino acid.25–29 Gelation has been achieved by a small number of methods. The enzymatic30–33 (or otherwise catalytic34) dephosphorylation of a precursor to Fmoc-tyrosine (FmocY) can be used to form FmocY in situ, which can form gels. FmocY can also form gels when the pH is lowered from a solution initially at high pH.8,32,35 This pH switch approach has also been shown to be successful for Fmoc-phenylalanine (FmocF),8,36 although FmocF has also been described as a non-gelling control system using a pH switch approach.12 FmocF can also form gels by heating and cooling a suspension in PBS buffer at a pH of 7.4.37,38 Nilsson's group have also described gelation for Fmoc-protected non-natural amino acids, here using a solvent-switch approach, where water is added to a solution of the amino acid in DMSO, resulting in the formation of a gel.25,26 For all of these examples, some models have been suggested, but there are no available crystal structures of the Fmoc-amino acids available.
Results and discussion
We used a pH-switch approach to form gels from a number of Fmoc-amino acids. The Fmoc-amino acids were dispersed in deionised water and sodium hydroxide used to adjust the pH. Of course, the Fmoc group is used as a base-sensitive protecting group39 and great care needs to be taken here to avoid removing the Fmoc group from the amino acid. We have found that the most effective method is to use an excess of the Fmoc-amino acid, which we then remove by filtration.8 The solution is used immediately after formation to minimise deprotection. It has been reported that removal of the Fmoc group does not occur for the more hydrophobic amino acids due to micelle formation.40,41 However, we find that even the most hydrophobic amino acids are easily deprotected if care is not taken at the concentrations used here. Stock solutions become turbid over short periods of time as deprotection occurs. This difference in observation may be due to operating at a lower concentration than the previous studies, as turbid solutions were also reported below the critical micelle concentrations.40,41To test for gelation, we then lowered the pH. To do this, we used the hydrolysis of glucono-δ-lactone (GdL) as we have reported elsewhere for FmocF, FmocY and a range of dipeptide-based gelators.8,42,43 This method allows a uniform pH change, with the final pH being controlled by the amount of GdL added. Based on our previous data,8 we used a concentration of 10 mg mL−1 for the Fmoc-amino acids. We then added different amounts of GdL to the stock solutions. Using this approach, we found that a number of Fmoc-amino acids do not form gels. These include Fmoc-alanine, Fmoc-valine, and Fmoc-leucine.
However, self-supporting gels could be formed from FmocF, FmocY, Fmoc-tryptophan (FmocW), Fmoc-methionine (FmocM), Fmoc-glycine (FmocG), and Fmoc-isoleucine (FmocI), Fig. 1 and 2. We have previously shown that FmocF and FmocY form gels by this approach, and that the gels display very different mechanical properties.8 To the best of our knowledge, the ability of FmocW, FmocM, FmocG, and FmocI to form gels has not been previously reported.
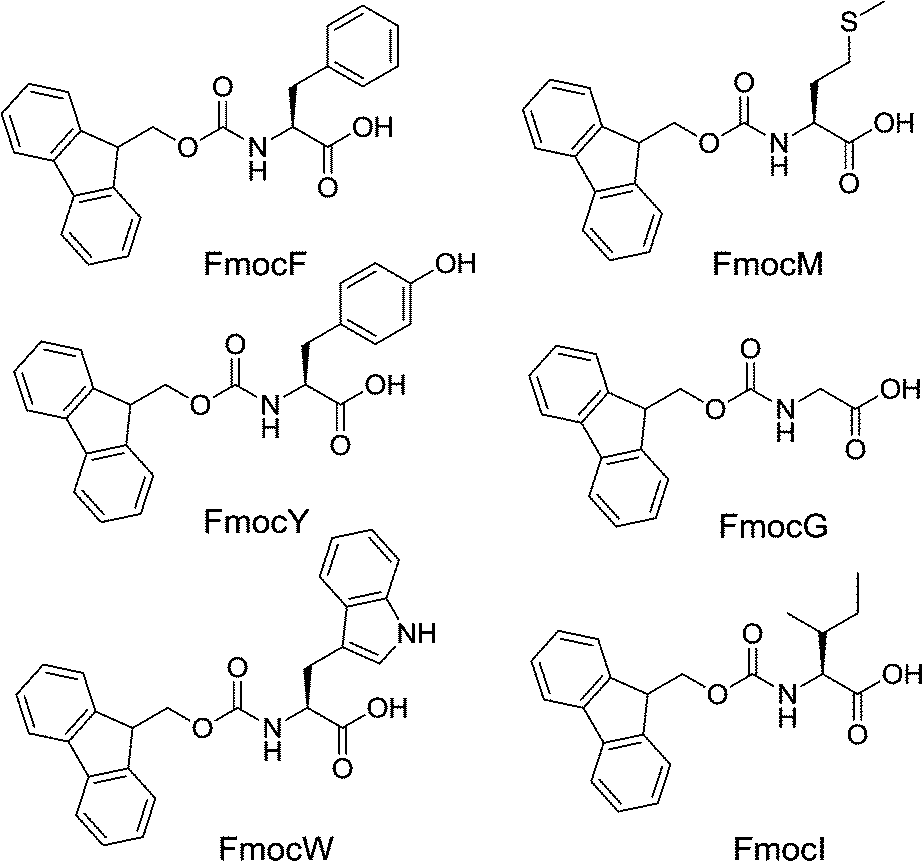 | ||
| Fig. 1 Structures of the Fmoc amino acid LMWG. | ||
 | ||
| Fig. 2 Photographs of gelation tests for (a) FmocF; (b) FmocY; (c) FmocW; (d) FmocM; (e) FmocG; (f) FmocI. In all cases, a concentration of Fmoc-amino acid of 10 mg mL−1 was used and the samples shown are with a GdL concentration (from left to right) of 1, 2, 3, 4, and 5 mg mL−1. All photographs were taken 24 hours after gel formation. | ||
For FmocF, self-supporting transparent gels form at low amounts of GdL (i.e. here, a relatively high pH of 6.1). These gels appear to be the result of the entanglement of worm-like micelles.8 At higher amounts of GdL (and hence a lower pH), white spherulites appear that ‘jam’ together, such that the sample is still self-supporting (Fig. 1a). However, prior to these spherulites appearing, transparent gels are formed. The spherulites appear over time, normally nucleated around one region in the gel (this effect is also more pronounced as the pH drops, hence the amount of spherulites increases from left to right in Fig. 1a). The spherulites are formed from bundles of needle shaped crystals (Fig. S2, ESI†). Rheologically, this sample is very different to that formed with less GdL (Fig. 3a, see also Fig. S1, ESI† for time sweep data). FmocY, FmocW, FmocM, FmocG and FmocI instead form gels below a specific pH (typically <5.2). Gels formed from FmocY, FmocW, and FmocM are translucent, although the FmocM gels shows some evidence of slight phase separation (Fig. 2d). The gels formed from FmocG and FmocI are turbid and, like the FmocF gels formed at lower pH appear to be formed from jammed spherulites. Rheologically, the gels formed from FmocY, FmocW and FmocM are typical of low molecular weight gels, breaking at relatively low strain (Fig. 3). For FmocF, the gel formed at 1 mg mL−1 of GdL breaks at higher strain and is consistent with an entangled worm-like micelle solution.8 At lower pH, the FmocF gel shows a gradual decrease in the storage modulus (G′) with increasing strain (and is similar to previously reported data44), as opposed to the sharp decrease observed for FmocY, FmocW and FmocM. This behaviour is consistent with a different type of network being formed as compared to FmocY, FmocW and FmocM. The data for the other white, turbid gels formed from FmocG and FmocI is similar to this FmocF gel. Hence, although all samples are self-supporting gels, there is a clear difference in the rheological behaviour for the transparent and the turbid gels.
 | ||
| Fig. 3 Strain sweeps for gels formed from (a) FmocF; (b) FmocY; (c) FmocW; (d) FmocM; (e) FmocG; (f) FmocI. In all cases, a concentration of Fmoc-amino acid of 10 mg mL−1 was used and the samples shown are with a GdL concentration of 5 mg mL−1. In (a), a gel formed using a GdL concentration of 1 mg mL−1 is used (blue data). In all cases, the closed symbols represent G′, the open symbols G′′. | ||
The minimum gelator concentrations (mgc) for these gelators were found to a first approximation to depend on the type of gel formed. For the turbid gels formed from spherulites, the mgc was relatively high, being 8 mg mL−1 and 7 mg mL−1 for FmocG, and FmocI respectively. For the transparent gels, significantly lower mgcs were found, at <0.5 mg mL−1, 1 mg mL−1, and <0.5 mg mL−1 for FmocY, FmocW and FmocM respectively (due to the need to scale the amount of GdL with the concentration of gelator, there is a lower limit on the concentration that can be investigated accurately). For FmocF, the mgcs were 2 mg mL−1 and 3.75 mg mL−1 at the higher and lower concentration of GdL respectively.
For these gels G′ is typically significantly greater than G′′, indicative of a viscoelastic gel. Tan![[thin space (1/6-em)]](https://www.rsc.org/images/entities/char_2009.gif) δ (G′′/G′) for all the gels are typically between 0.07 and 0.26 at 1% strain. The transparent and turbid gels were found to have similar values, for example the gel for FmocY had a tanδ of 0.27, with FmocG having a tanδ of 0.26. To further probe the systems, we heated the gels in the rheometer (Fig. 4).
δ (G′′/G′) for all the gels are typically between 0.07 and 0.26 at 1% strain. The transparent and turbid gels were found to have similar values, for example the gel for FmocY had a tanδ of 0.27, with FmocG having a tanδ of 0.26. To further probe the systems, we heated the gels in the rheometer (Fig. 4).
 | ||
| Fig. 4 Temperature sweeps for gels formed from (a) FmocF; (b) FmocY; (c) FmocW; (d) FmocM; (e) FmocG; (f) FmocI. In all cases, a concentration of Fmoc-amino acid of 10 mg mL−1 was used and the samples shown are with a GdL concentration of 5 mg mL−1. In all cases, the black data shows the heating cycle (at a rate of 2 °C min−1 and the red data shows the cooling cycle at a rate of 5 °C min−1. The closed symbols represent G′, the open symbols G′′. | ||
These gels again fall into two different behaviours, depending on whether the gels are white, turbid gels, or transparent gels. The white turbid gels do not show well-defined melting temperatures where there is a gel-to-sol transition. Instead, there is a slow decrease in both G′ and G′′, with the values returning to close to the original data on re-cooling. For the transparent FmocY and FmocW gels however, a slow decrease in G′ is seen before a well-defined melting, with both G′ and G′′ decreasing precipitously at a certain temperature (approximately 80 and 75 °C respectively). However, these gels behave differently on cooling. FmocY reforms a gel on cooling with G′ and G′′ being similar to the original values. However, FmocW does not re-form a gel on cooling. This again shows how the process by which the self-assembly is carried out it critical.45 FmocM shows a different behavior again, with the gel apparently getting stronger before melting, with no gel being formed on cooling. However, on removing from the rheometer, it is clear that this behaviour is due to gel syneresis as opposed to melting. As a result of this complex behaviour, we did not attempt to carry out simple inverted vial tests for the temperatures at which the gel-to-sol transition occurs.
The gels formed from FmocF, FmocY, FmocW and FmocM are all a result of the formation of a network of fibrous structures, as shown by microscopy on the corresponding xerogels formed by drying the gels in air (Fig. 5). Significantly larger tape-like structures with higher persistence length were found in the xerogels of FmocG and FmocI, consistent with the more highly scattering turbid gels. For FmocF at higher pH, the fibres tend to align on drying, which is consistent with a system of worm-like micelles as opposed to a truly cross-linked fibrillar network as we have shown elsewhere.8,46 At lower pH, the xerogel formed from FmocF contains larger structures with an increased persistence length. We note that spherical structures have been reported to be the structures leading to a FmocF gel by Shi et al.44 We suggest that the propensity for FmocF to undergo a structural re-arrangement at lower pH means that it is easy for such transformations to occur on drying.
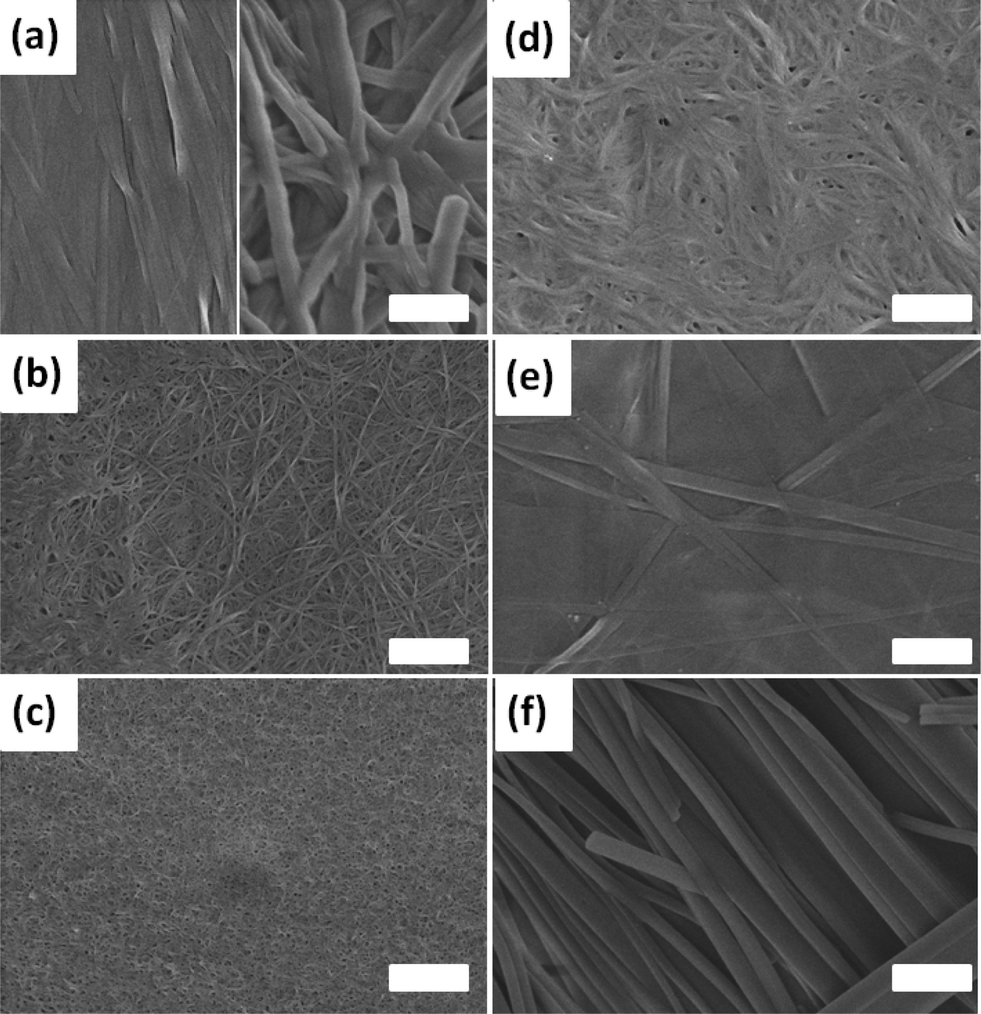 | ||
| Fig. 5 SEM images of xerogels formed from (a) FmocF; (b) FmocY; (c) FmocW; (d) FmocM; (e) FmocG; (f) FmocI. In all cases, a concentration of Fmoc-amino acid of 10 mg mL−1 was used. For (a), the left hand side is for a sample prepared using 1 mg mL−1 of GdL, and the right hand side for gels prepared at 5 mg mL−1 of GdL. For (b)–(f), the samples shown are with a GdL concentration of 5 mg mL−1. Gels were air-dried 24 hours after addition of GdL. In all cases, the scale bar represents 1 μm. | ||
With this in mind, we collected pXRD data for all of the xerogels. The xerogels for FmocY, FmocW, FmocM and FmocF (at 1 mg mL−1 GdL) all show low intensity scattering. The data for FmocY is dominated by a broad peak at 4.55 Å. FmocW and FmocM show similar broad peaks at 4.61 and 4.56 Å respectively. Both also contain additional broad peaks at 6.55 and 3.93 Å (FmocW) and 8.35 and 4.15 Å (FmocM). FmocF (at 1 mg mL−1 GdL) exhibits broad peaks at 4.71 and 4.27 Å. In comparison, the xerogels of FmocI, FmocG and FmocF (at 5 mg mL−1 GdL) all show greater scattering, implying significant crystallinity (Fig. 6). Interestingly, there are differences between the peak positions for the FmocF xerogels at 1 mg mL−1 and 5 mg mL−1, rather than the data simply implying a more crystalline sample is formed at lower pH. There is a small shift from 4.71 to 4.73 Å, and there is no corresponding peak at 4.27 Å at lower pH (see Fig. S3, ESI† for an expansion of this region of the data).
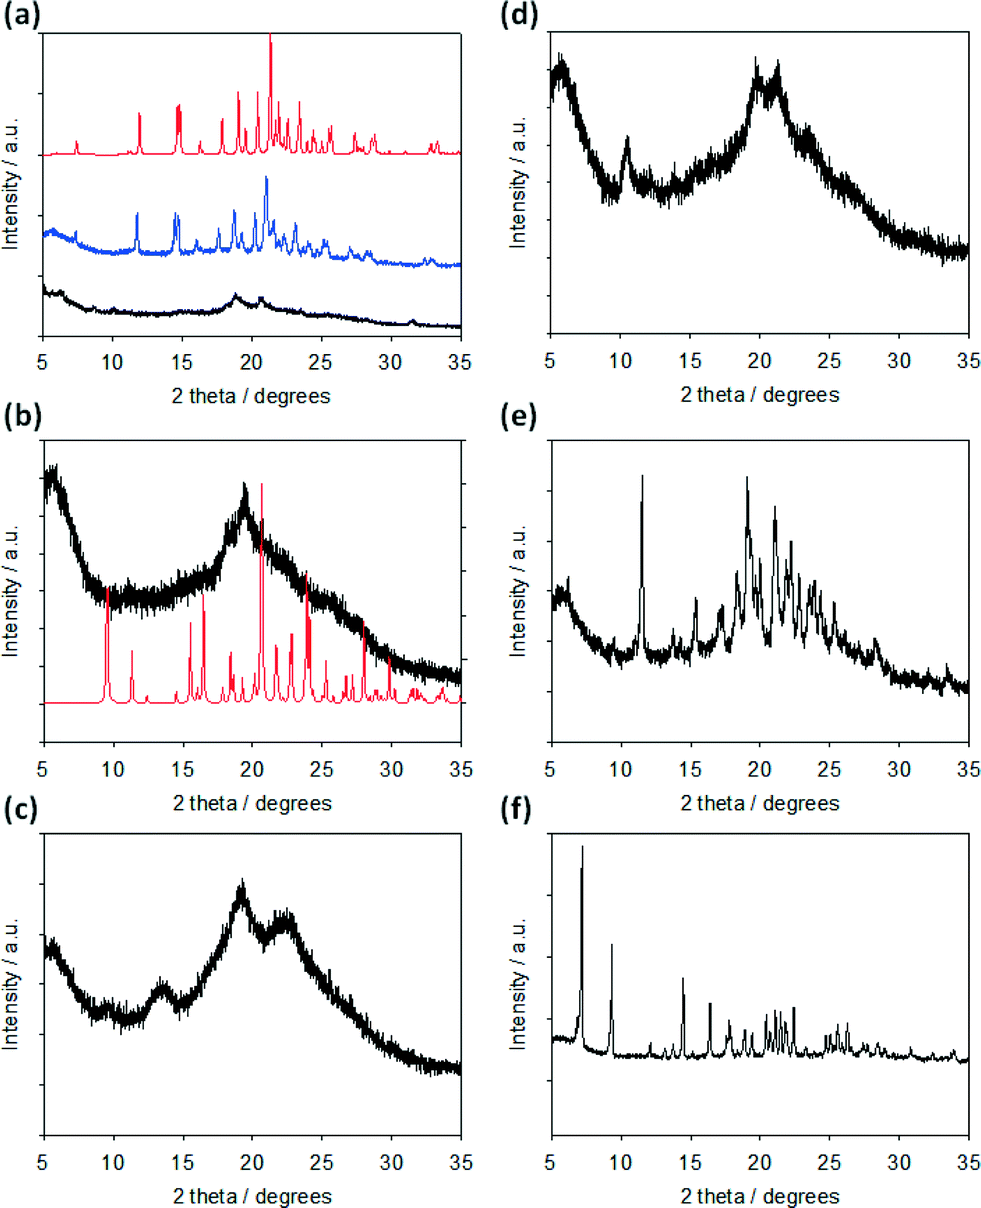 | ||
| Fig. 6 pXRD data for xerogels prepared by air-drying gels formed from (a) FmocF; (b) FmocY; (c) FmocW; (d) FmocM; (e) FmocG; (f) FmocI. In all cases, a concentration of Fmoc-amino acid of 10 mg mL−1 was used and the samples shown are with a GdL concentration (for (b)–(f)) of 5 mg mL−1. In (a), data for a gel formed using a GdL concentration of 1 mg mL−1 (black data) and 5 mg mL−1 (blue data) are shown. Gels were air-dried 24 hours after addition of GdL. For (a) and (b), the red data is the predicted data calculated from the single crystal structures (see below). | ||
As mentioned earlier, in rare examples crystals suitable for single crystal X-ray diffraction can be grown directly from the gel phase. During the course of this work, a number of crystals of FmocF were grown. In addition, crystals of FmocY were grown from a single sample. The relative ease of crystal growth for these two gelators correlates with the observations in Fig. 2; gels prepared using FmocF are clearly metastable, whilst those from FmocY are significantly more stable. In general, gels formed from FmocY are stable for at least a few weeks, so we highlight that the crystals grown are a highly unusual observation for this gelator.
FmocF crystallised as thin needle shaped crystals from an aqueous gel phase in the chiral monoclinic space group P21. The structure was refined with one complete Fmoc-F molecule in the asymmetric unit, Fig. 7a. In the crystal packing, an intermolecular hydrogen bonding interaction is evident between FmocF molecules stacked along the crystallographic b axis via N1–H1⋯O2, Table 1, Fig. 7b. The separation distance between these hydrogen bonded FmocF molecules is one b unit cell edge, or 4.9 Å. Additional intermolecular hydrogen bonding interactions are evident between the carboxylic acid groups of adjacent 1D stacks of FmocF molecules via O3–H3⋯O4, Table 1, Fig. 7c. The hydrogen bonded networks of FmocF molecules, via these carboxylic acid groups, extend along twofold screw axes parallel to the crystallographic b axis, Fig. 7d. Importantly, the predicted pXRD for FmocF from the single crystal data closely matches that found for the xerogel formed at 5 mg mL−1 (Fig. 6a and S4, ESI†), showing that the spherulitic structures formed in the FmocF gel at this point are microcrystals with the same crystallographic structures.
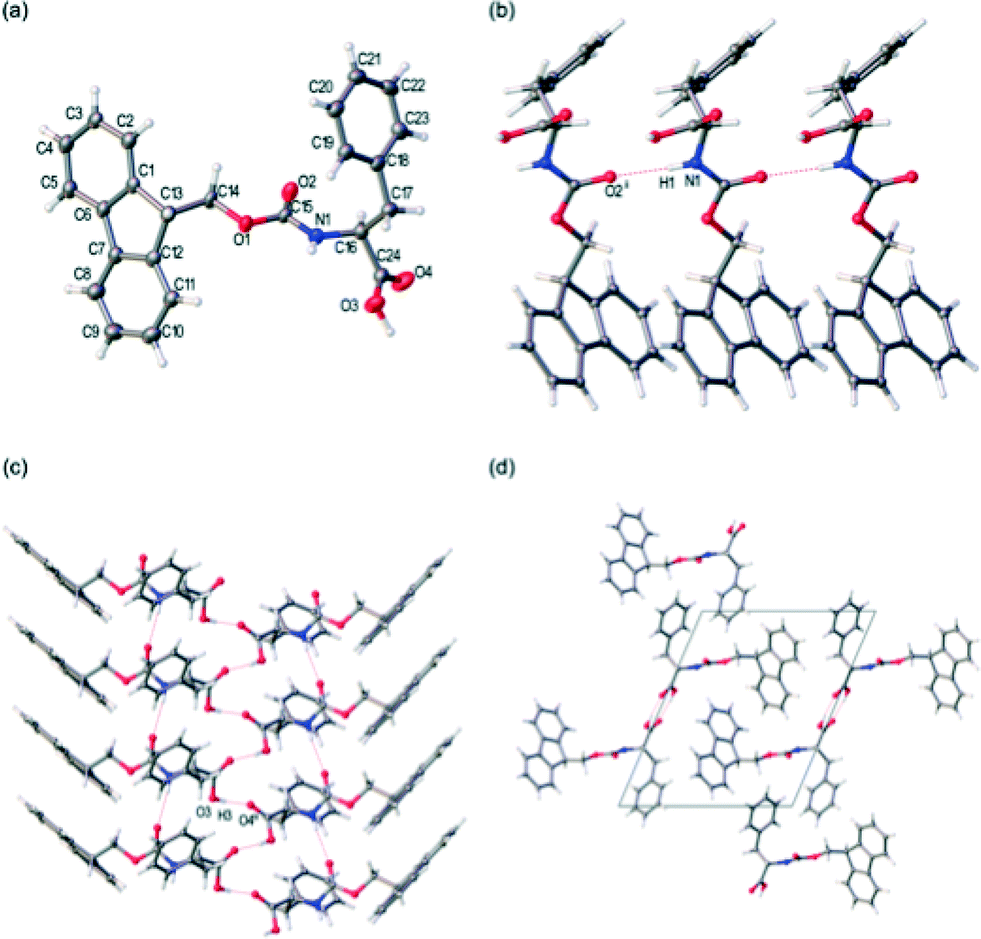 | ||
| Fig. 7 (a) Labelled displacement ellipsoid plot of the asymmetric unit from the single crystal structure of FmocF, ellipsoids displayed at 50% probability level. (b) Intermolecular hydrogen bonding of FmocF molecules via N1–H1⋯O2, perspective view [001]. (c) Intermolecular hydrogen bonding of Fmoc-F molecules via carboxylic acid groups, perspective view [101]. (d) Extended crystal packing of FmocF molecules, perspective view [010], unit cell shown. Symmetry element, i: (x, y − 1, z), ii: (−x, −1/2 + y, 1 − z). | ||
| H–A [Å] | D–A [Å] | D–H–A angle [°] | |
|---|---|---|---|
| Symmetry operations, i: (x, y − 1, z), ii: (−x, y − 1/2, 1 − z). | |||
| N1–H1⋯O2i | 2.08(4) | 2.904(4) | 167(3) |
| O3–H3⋯O4ii | 1.80 | 2.634(4) | 173.5 |
For comparison, needle shaped solvated single crystals of FmocF, crystallised from a MeOH solution, were isolated as FmocF·(MeOH)2. The crystals were weakly diffracting and poorly ordered. However, accurate structure solution was possible in the monoclinic space group P21, Fig. 8. Comparable to the crystal structure of FmocF, isolated from the aqueous gel phase, is a hydrogen bonded network of FmocF molecules along the crystallographic b axis via N1–H1⋯O2, Fig. 8b, Table 2. The separation distance between these 1D stacked FmocF molecules is comparable – that is, one b unit cell edge, or 4.9 Å. Unlike the FmocF crystal structure isolated from the aqueous gel phase, there are two MeOH solvent molecules that hydrogen bond to the carboxylic acid terminus of FmocF, Fig. 8a and c, Table 2. This prevents a comparable crystal packing mode of adjacent 1D stacks of FmocF molecules, as can be seen on comparing Fig. 8dversusFig. 7d, where a notable difference between the two structures is apparent. This highlights that crystallising from a solvent where no gel is formed can result in different final packing of the molecules and hence care should be taken (at least for this class of gelator) in extrapolating structures from such crystals to the gel phase.
 | ||
| Fig. 8 (a) Labelled displacement ellipsoid plot of the asymmetric unit from the single crystal structure of FmocF·(MeOH)2, ellipsoids displayed at 50% probability level, hydrogen bonded interactions to MeOH shown. (b) Intermolecular hydrogen bonding of FmocF molecules via N1–H1⋯O2. (c) Hydrogen bonding interaction between FmocF carboxylic acid terminus and MeOH. (d) Extended crystal packing of FmocF molecules, perspective view [010], unit cell shown. Symmetry operations, i: (x, −1 + y, z), ii: (1 − x, −1/2 + y, 1 − z). | ||
| H–A [Å] | D–A [Å] | D–H–A angle [°] | |
|---|---|---|---|
| Symmetry operations, i: (x, y − 1, z), ii: (x, 1 + y, z), iii: (1 − x, −1/2 + y, 1 − z). | |||
| N1–H1⋯O2i | 2.05 | 2.855(17) | 152 |
| O6–H6⋯O4ii | 1.98 | 2.789(19) | 162 |
| O5–H5A⋯O6 | 1.94 | 2.711(19) | 152 |
| O3–H3⋯O5iii | 1.71 | 2.539(18) | 170 |
FmocY crystallised as thin plate shaped crystals from an aqueous gel phase in the chiral monoclinic space C2. The structure was determined via single crystal X-ray diffraction using synchrotron radiation. For this crystalline phase, the asymmetric unit comprises one complete FmocY and one well-ordered H2O molecule, Fig. 9a. Hydrogen atoms were located in the difference map and refined isotopically. A hydrogen bonding interaction is evident between FmocY and the well-ordered H2O molecule via O2⋯H6B–O6, Table 3. In the crystal packing, the H2O molecule hydrogen bonds to three distinct FmocY molecules, Fig. 9b. This packing arrangement of FmocY molecules via H2O is repeated along the crystallographic a axis, Fig. 9c. In the extended crystal packing, intermolecular hydrogen bonding interactions are evident between the phenyl–OH and the carbonyl C![[double bond, length as m-dash]](https://www.rsc.org/images/entities/char_e001.gif) O. This is repeated such that these two FmocY molecules hydrogen bond to one another through two equivalent hydrogen bonding interactions, Fig. 9d. The combination of these intermolecular hydrogen bonding interactions between FmocY molecules and to H2O results in the formation of a 2D hydrogen bonded network which grows along the crystallographic a and b axes. The hydrogen bonded core of this 2D network is essentially shielded by the bulky Fmoc protecting groups. The crystal packing of FmocY is unlike both structures for FmocF, where the dipeptide residues have an alternating orientation with respect to the Fmoc groups, see Fig. 9c compared to Fig. 7c and 8c.
O. This is repeated such that these two FmocY molecules hydrogen bond to one another through two equivalent hydrogen bonding interactions, Fig. 9d. The combination of these intermolecular hydrogen bonding interactions between FmocY molecules and to H2O results in the formation of a 2D hydrogen bonded network which grows along the crystallographic a and b axes. The hydrogen bonded core of this 2D network is essentially shielded by the bulky Fmoc protecting groups. The crystal packing of FmocY is unlike both structures for FmocF, where the dipeptide residues have an alternating orientation with respect to the Fmoc groups, see Fig. 9c compared to Fig. 7c and 8c.
 | ||
| Fig. 9 (a) Displacement ellipsoid plot of the asymmetric unit from the single crystal structure FmocY·H2O, ellipsoids displayed at 50% probably level. (b) Hydrogen bonded interaction evident between H2O and three distinct FmocY molecules. (c) Extension of the hydrogen bonded network of FmocY molecules via H2O along crystallographic a axis. (d) Intermolecular hydrogen bonding interactions between two FmocY molecules. Symmetry elements, i: (−1/2 + x, 1/2 + y, +z), ii: (1/2 − x, −1/2 + y, −z), iii: (1 − x, 1 + y, −z). | ||
| H–A [Å] | D–A [Å] | D–H–A angle [°] | |
|---|---|---|---|
| Symmetry operations, i: (1/2 + x, y − 1/2, z), ii: (1 − x, y, −z), iii: (1/2 − x, y − 1/2, −z). | |||
| O4–H4⋯O6i | 1.60(3) | 2.577(3) | 174(3) |
| O5–H5⋯O3ii | 1.86(3) | 2.708(3) | 155(3) |
| O6–H6A⋯O5iii | 1.85(5) | 2.759(3) | 173(4) |
| O6–H6B⋯O2 | 1.89(4) | 2.820(3) | 166(3) |
Interestingly, unlike for FmocF, there is clearly no similarity in the pXRD of the dried xerogel for FmocY and the predicted pattern from the crystal structure. Instead, the xerogel implies that there is little or no crystalline material present. This correlates with the difficulty in growing a single crystal for FmocY from the gel phase. Previously, we have used fibre X-ray diffraction to interrogate the structures of dipeptide-based low molecular weight gelators in the fibre phase.18,47,48
As mentioned above, an approach to understanding the packing in supramolecular gels is to examine crystal structures of the gelators. We have previously shown however that there can be little similarity in scattering from diffraction from crystals and data obtained from fibre X-ray diffraction from the gel phase for dipeptide-based gelators.18,19 Following this approach, in order to gain directional information about the fibrillar structures within the gels to compare to the above single crystal data, FmocF and FmocY gels were prepared and then immediately aligned to form a partially oriented fibre sample. The X-ray fibre diffraction data revealed highly oriented patterns and both samples gave a strong meridional diffraction signal at 4.8 Å consistent with hydrogen bonding distances between β-sheets (Fig. 10).49,50 The positions of diffraction signals are shown in Table 4. The observation of the off-meridional reflections, particularly obvious for FmocY suggests a helical twist in the structures. The off-meridional reflection at 4.55 Å correlates with the position of the broad reflection observed in the pXRD for FmocY (Fig. 6b).
 | ||
| Fig. 10 X-ray fibre diffraction patterns from partially aligned hydrogels formed by a) FmocF and b) FmocY. The X-ray fibre axis is vertical and the major meridional reflections are highlighted by the white arrows. Diffraction signal positions are shown in Table 4. | ||
| FmocF | FmocY | |
|---|---|---|
| Equatorials | 23.6 Å | 28 Å * |
| 17.4 Å | ||
| 13.8 Å | 13.1 Å | |
| 9.95 Å | ||
| 8.6 Å | 8.9 Å | |
| 7.97 Å | ||
| 6.83 Å | ||
| 5.97 Å | 6.0 Å | |
| 5.04 Å | 4.4 Å | |
| Meridionals | 4.88 Å | 4.83 Å |
| 4.67 Å | ||
| Off-meridionals | 4.55 Å | |
| 4.29 Å | 4.3 Å | |
| 3.78 Å | 3.8 Å |
We calculated the diffraction pattern from each crystal structure in their crystal packing environment in order to establish whether crystal structures solved for FmocF and FmocY are representative of the organisation within the fibrillar networks. For FmocF, calculation of the fibrillar structure from the crystal structure shows that the fibre axis in b is consistent with the hydrogen bonding repeat distances and the calculated pattern is a good match with the experimental fibre X-ray diffraction data at resolutions <6 Å (Fig. 11). Importantly, the X-ray fibre diffraction data for FmocF show sharp reflections consistent with crystallinity. This again correlates with the observations above where FmocF crystallises easily. It is therefore likely that this fibre sample contains fibrous crystals and perhaps also long filaments (as observed by optical microscopy Fig. S2, ESI†). The largest cell dimension of the crystal structure is 13 Å whilst the observed equatorial diffraction signals extend up to 23 Å indicating that the fibres exhibit order on length scales greater than those described by the crystal structure alone. The experimental equatorial signals (observed at 23.6, 17.4, 13.8 and 8.60 Å) are not reproduced in the calculated pattern. This indicates that these arise from long range structural order found only in the fibrous gel phase and not the crystalline phase.
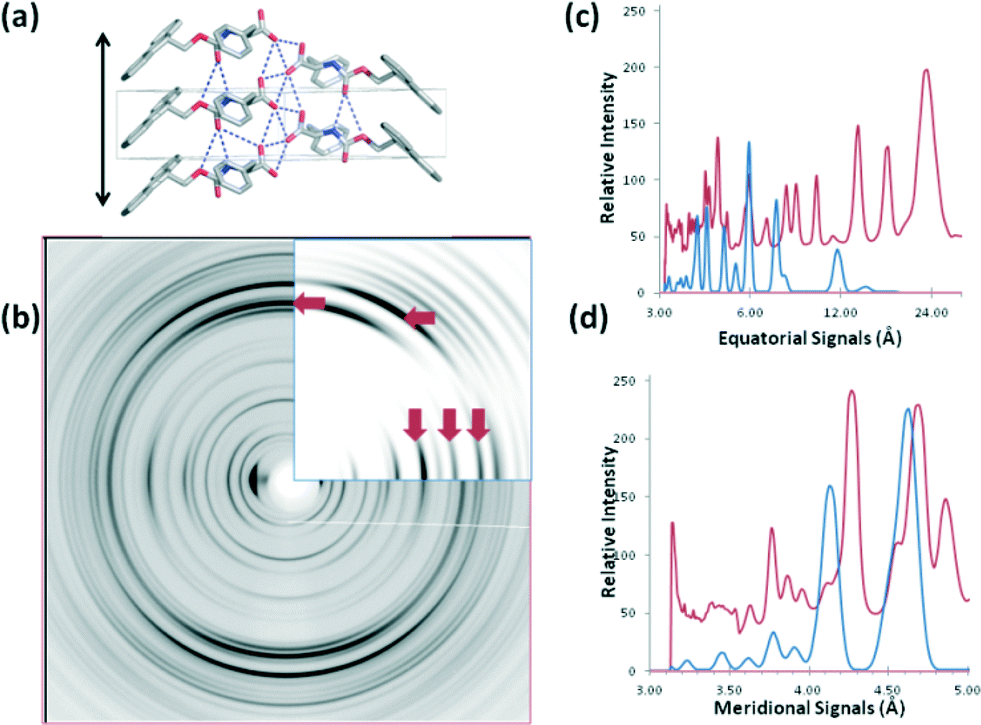 | ||
| Fig. 11 a) The X-ray crystal structure of FmocF oriented to align the hydrogen bonding direction with a possible fibre axis (denoted by black double head arrow). b) Comparison between calculated (insert) and experimental diffraction data for FMOC-F. The red arrows denote signals in agreement between experimental and calculated data. c) Graphical trace comparing equatorial signals for calculated (blue) and experimental data (red). d) Graphical trace comparing meridional signals for calculated (blue) and experimental data (red). | ||
FmocY forms crystals in a monoclinic space group. This means that the hydrogen bonding repeat distance is not obvious in the cell and none of the unit cell dimensions run parallel to the hydrogen bonding direction therefore calculations of the diffraction pattern from this structure are more challenging due to difficulty in assigning a fibre axis. The smallest distance between the stacked molecules that could represent anisotropic stacking is 6 Å and the “fibre” axis was assigned in this direction for the purposes of diffraction pattern calculation from the crystal structure. Consequently, the major meridional reflection in the calculated pattern is at 6 Å, commensurate with the expected repeat distance. We can conclude that the FmocY molecules in the fibrillar hydrogels are organised very differently from in the crystals (Fig. 12). Experimental data for FmocY gives a very strong equatorial signal at around 28 Å, which would correlate with around twice the length of the molecule (approximately 14 Å). In addition, the diffraction signals are relatively diffuse and this is more consistent with fibre packing rather than highly crystalline packing. The experimental data indicates that the FmocY molecules hydrogen bond together with a distance of 4.8 Å along the fibre axis and in a similar arrangement to FmocF. The packing of FmocY within the crystal structure is created by interactions between the planar Fmoc groups, whilst it is clear that hydrogen bonding drives the self-assembly into fibrillar structures within the gels.
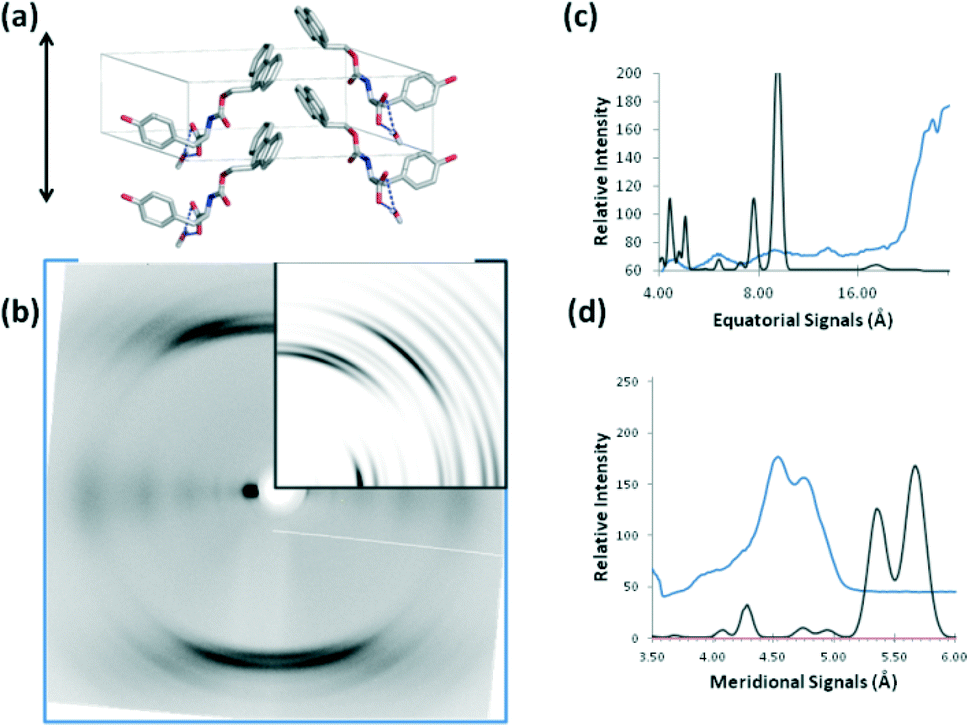 | ||
| Fig. 12 a) The X-ray crystal structure of FmocY oriented to align to a possible fibre axis (denoted by black double head arrow). b) Comparison between calculated (insert) and experimental diffraction data for FmocF. The red arrows denote signals in agreement between experimental and calculated data. c) Graphical trace comparing equatorial signals for calculated (black) and experimental data (blue). d) Graphical trace comparing meridional signals for calculated (black) and experimental data (blue). | ||
Conclusions
We have shown that a number of Fmoc amino acids can be effective hydrogelators. Depending on the amino acid (and for FmocF, the pH), some gels are formed by the self-assembly of the gelator in fibres, whilst some are formed by what appear to be jammed crystalline colloidal systems. The different types of gel show different rheological properties.Crystals were grown for two of the amino acids, and are the first reported structures for this class of gelator. Comparing the data for the single crystals to that obtained from diffraction from the fibre phase shows that the fibre axis in b for FmocF is consistent with the hydrogen bonding repeat distances and the calculated pattern is a good match with the experimental fibre X-ray diffraction data at the resolution described by the crystal structure. It is likely that some crystallisation occurred within the fibre phase here due to the propensity for FmocF to crystallise. However, the similarity in data implies that the gel phase and the crystal phase are closely related and that perhaps the ease of crystallisation is due to the relative small reorganisation needed to change between the forms.
On the other hand, our data shows that the FmocY molecules in the hydrogels are organised very differently from in the crystals. The data implies that the packing of FmocY within the crystal structure is created by interactions between the planar Fmoc groups, whilst it is clear that hydrogen bonding drives the self-assembly into fibrillar structures within the gels. This is in disagreement with many suggested models for Fmoc amino acids,25,26 and also for Fmoc-diphenylalanine, where it is suggested that stacking between Fmoc groups is a strong driving force for assembly into fibres.51 Our data here also suggests that extrapolating from single crystal structures (whether grown directly from the gel phase or not) may not allow one to understand the packing in the gel phase. This agrees with our previous work on dipeptide gelators.18,19
Experimental
Materials
All Fmoc-amino acids were purchased from Sigma Aldrich and used as received. Deionised water was used throughout.Hydrogel formation
To a weighed amount of the Fmoc-amino acid (0.11 mmol) was added 3.0 mL of water. Sodium hydroxide (1.0 mL of a 0.1 M solution) was added. The suspension was gently heated to approximately 40 °C for a few seconds. The excess Fmoc-amino acid was removed by filtration through glass wool in a Pasteur pipette to give a clear solution. Any turbidity at this point indicates deprotection of the Fmoc group has occurred and the sample was discarded. Otherwise, an aliquot of this solution was added to a pre-weighed amount of GdL, the solution swirled gently and then allowed to stand.The minimum gelation concentrations were determined by preparing a stock solution as above, diluting aliquots with deionised water as appropriate and then adding to pre-weighed aliquots of GdL. The amount of GdL was scaled with the concentration of the Fmoc-amino acid, as this has been previously shown to result in reproducible end points.52 After 24 hours, the vials were inverted and the mgc determined to be the lowest concentration at which a self-supporting gel was formed. For FmocY and FmocW, the absolute minimum gelation concentrations were not determined as experimentally it is difficult to accurate to weigh out GdL below a certain amount.
For the temperature sweeps, gels were formed as above, but placed in aluminium sample holders before being allowed to gel overnight. After 24 hours, the samples were loaded on to the rheometer.
pH measurements
A calibrated FC200 pH probe (HANNA instruments) with a (6 mm × 10 mm) conical tip was used for the pH measurements and pKa titrations. The stated accuracy of the pH measurements is ±0.1. Kinetic pH measurements during gelation were taken by monitoring the pH in situ and by taking pH measurements every 60 s for ~18 hours at 25 °C.Rheology
Dynamic rheological measurements were performed using an Anton Paar Physica MCR101 rheometer. Time sweeps were carried out using a parallel plate system with a 50 mm sand blasted plate with a gap of 0.8 mm. 2 mL solutions of gelator with GdL were prepared directly on the bottom plate and the top plate lowered onto the solution to monitor gelation. Time sweeps tests were performed at an angular frequency of 10 rad s−1 and with a strain of 0.1%. Measurements were recorded for approximately 16 hours. For the strain sweeps, a vane and cup measuring system was used with a gap of 1 mm. All experiments were performed at 25 °C. Strain scans were performed from 0.1–1000% strain at a frequency of 10 rad s−1.For the temperature sweeps, gels were prepared as previously mentioned in metal rheology cups and left overnight before measurements were carried out. G′ and G′′ were recorded at a strain of 0.5% and a frequency of 10 rad s−1 using a vane and cup measuring system. The temperature was increased from 20 °C to 90 °C with a heating rate of 2 °C per minute. The temperature was then decreased back to 20 °C at a rate of 5 °C per minute.
Scanning electron microscopy
SEM images were recorded using a Hitachi S-4800 FE-SEM at 3 keV. A portion of the hydrogels was placed on a glass cover slip attached to a sticky carbon tab. The hydrogel was air-dried directly on the coverslip. The samples were gold coated for 3 minutes at 15 mA using a sputter coater (EMITECH K550X) prior to imaging.Optical microscopy
Microscope images were taken under cross polarised light using an Infinity2 colour camera attached to a Nikon Eclipse LV100 microscope fitted with a Nikon TU Plan ELWD 50× lens.Powder X-ray diffraction
Powder X-ray diffraction data were collected on a PANalytical X'pert pro multipurpose diffractometer (MPD) in transmission Debye–Scherrer design operating with a Cu anode at 40 kV and 40 mA. For the dried gels, samples were ground and mounted as a loose powder onto a transparent film and spun at 2 s per rotation. PXRD patterns were collected in 4 × 1 h scans with a step size of 0.013° 2θ and a scan time of 115 s per step over 5–50° 2θ. The incident X-ray beam was conditioned with 0.04 rad Soller slits and an antiscattering slit of 0.5°. The diffracted beam passed through 0.04 rad Soller slits before being processed by the PIXcel2 detector operating in scanning mode.Crystallography
Crystals suitable for single crystal X-ray diffraction were grown from a gel of FmocF using a concentration of 3 mg mL−1 of GdL. For FmocY, the crystals were grown from a solution using 1 mg mL−1 of GdL. We stress that this was an unusual observation for FmocY; normally transparent homogeneous gels were formed.Single crystal X-ray data was measured on either a Rigaku MicroMax-007 HF rotating anode diffractometer (Mo-Kα radiation, λ = 0.71073 Å, Kappa 4-circle goniometer, Rigaku Saturn724+ detector); or at beamline I19, Diamond Light Source, Didcot, UK using silicon double crystal monochromated synchrotron radiation (λ = 0.6889 Å).53 Solvated single crystals, isolated from the crystallisation solvent mixture, were mounted on MiTeGen loops and flash cooled to 100 K under a dry nitrogen gas flow. Empirical absorption corrections based on multi-scan methods were applied by using the programme SADABS.54 Structures were solved with SHELXD,55 or by direct methods using SHELXS,55 and refined by full-matrix least squares on |F2| by SHELXL, interfaced through the programme OLEX2.56 Unless stated, all non-H atoms were refined anisotropically, and unless stated hydrogen atoms were located in the difference map and refined isotropically. Absolute configurations for the dipeptides were determined from synthetic methods and not crystallographically.
Crystal data for FmocF, CCDC # 1060776. Formula C24H21NO4; M = 387.42 g mol−1; monoclinic space group P21, colourless needle shaped crystal; a = 13.1570(13), b = 4.9083(4), c = 16.1242(16) Å; β = 113.135(3)°; V = 957.54(16) Å3; ρ = 1.344 g cm−3; μ(Mo-Kα) = 0.092 mm−3; F(000) = 408; crystal size = 0.17 × 0.04 × 0.03 mm3; T = 100(2) K; 13345 reflections measured (1.37 < θ < 26.42°), 3717 unique (Rint = 0.0595), 2762 (I > 2σ(I)); R1 = 0.0455 for observed and R1 = 0.0723 for all reflections; wR2 = 0.1027 for all reflections; max/min difference electron density 0.157 and −0.220 e Å−3; data/restraints/parameters = 3717/1/343; GOF = 0.996; Flack parameter −1.4(10). For this structure, the carboxylic acid hydrogen atom was located in the difference map but refined using the riding model.
Crystal data for FmocF·(MeOH)2, CCDC # 1060777. Formula C26H29NO6; M = 451.50 g mol−1; monoclinic space group P21, colourless needle shaped crystal; a = 13.076(6), b = 4.887(2), c = 18.998(8) Å; β = 106.417(11)°; V = 1164.4(10) Å3; ρ = 1.288 g cm−3; μ(Mo-Kα) = 0.091 mm−3; F(000) = 480; crystal size = 0.09 × 0.03 × 0.01 mm3; T = 100(2) K; 16474 reflections measured (1.69 < θ < 21.94°), 2788 unique (Rint = 0.1336), 2138 (I > 2σ(I)); R1 = 0.1269 for observed and R1 = 0.1548 for all reflections; wR2 = 0.3389 for all reflections; max/min difference electron density 0.750 and −0.530 e Å−3; data/restraints/parameters = 2788/253/283; GOF = 1.098; Flack parameter 0.4(10). Single crystal of FmocF·(MeOH)2 were small, weakly diffracting, and poorly ordered. A resolution limit of 0.95 Å was applied during refinement, displacement parameters were refined with rigid-body restraints (RIGU in SHELX), MeOH solvent molecules were refined isotropically, and hydrogen atoms were placed in geometrically estimated positions using the riding model. In addition three carbon atoms were refined with ISOR restraints.
Crystal data for FmocY·(H2O), CCDC # 1060778. Formula C24H23NO6; M = 421.43 g mol−1; monoclinic space group C2, colourless plate shaped crystal; a = 18.640(16), b = 5.992(5), c = 18.841(15) Å; β = 98.834(16)°; V = 2079(3) Å3; ρ = 1.346 g cm−3; μ(synchrotron λ = 0.6889 Å) = 0.091 mm−3; F(000) = 888; crystal size = 0.10 × 0.07 × 0.02 mm3; T = 100(2) K; 7927 reflections measured (1.06 < θ < 25.63°), 3700 unique (Rint = 0.0558), 3700 (I > 2σ(I)); R1 = 0.0370 for observed and R1 = 0.0389 for all reflections; wR2 = 0.0907 for all reflections; max/min difference electron density 0.277 and −0.247 e Å−3; data/restraints/parameters = 3700/1/372; GOF = 1.107; Flack parameter 0.5(4).
Fibre X-ray diffraction
FmocF and FmocY gels were prepared using GdL as described above and, immediately after GdL addition, 10 μL of the gelating solution was suspended between two wax tipped capillary tubes and allowed to air dry as described previously.18,48 The fibre sample was placed on a goniometer head and X-ray diffraction data was collected using a Rigaku CuKα rotating anode and SATURN ++ CCD detector using exposure times of 30–60 seconds and specimen to detector distances of 50 and 100 mm. Diffraction data was examined using ipmosflm57 and then using CLEARER.58 Reflection positions were output using the Radial Average module within CLEARER and further analysis was conducted using CLEARER. Diffraction patterns were calculated from the coordinates of FmocY and FmocF X-ray crystal structure analyses using Diffraction Simulation module within CLEARER by applying the experimental crystalline unit cells. Comparison between experimental and calculated diffraction data was made visually. For closer comparison, conversion of the diffraction signal intensity per pixel, as measured by CLEARER, was made to Ångstroms using Braggs law; the diffraction signals were then compared using Excel.Acknowledgements
JR and ED thank the EPSRC for DTA studentships. DA thanks the EPSRC for a Fellowship (EP/L021978/1). We thank Diamond Light Source for access to beamline I19 (MT8728) that contributed to the results presented here.Notes and references
- S. Fleming and R. V. Ulijn, Chem. Soc. Rev., 2014, 43, 8150–8177 RSC.
- D. M. Ryan and B. L. Nilsson, Polym. Chem., 2012, 3, 18–33 RSC.
- A. Dasgupta, J. H. Mondal and D. Das, RSC Adv., 2013, 3, 9117–9149 RSC.
- D. J. Adams, Macromol. Biosci., 2011, 11, 160–173 CrossRef CAS PubMed.
- T. Liebmann, S. Rydholm, V. Akpe and H. Brismar, BMC Biotechnol., 2007, 7, 88 CrossRef PubMed.
- V. Jayawarna, M. Ali, T. A. Jowitt, A. F. Miller, A. Saiani, J. E. Gough and R. V. Ulijn, Adv. Mater., 2006, 18, 611–614 CrossRef CAS PubMed.
- M. Ikeda, T. Tanida, T. Yoshii, K. Kurotani, S. Onogi, K. Urayama and I. Hamachi, Nat. Chem., 2014, 6, 511–518 CrossRef CAS PubMed.
- S. Sutton, N. L. Campbell, A. I. Cooper, M. Kirkland, W. J. Frith and D. J. Adams, Langmuir, 2009, 25, 10285–10291 CrossRef CAS PubMed.
- A. Mahler, M. Reches, M. Rechter, S. Cohen and E. Gazit, Adv. Mater., 2006, 18, 1365–1370 CrossRef CAS PubMed.
- G. Liang, Z. Yang, R. Zhang, L. Li, Y. Fan, Y. Kuang, Y. Gao, T. Wang, W. W. Lu and B. Xu, Langmuir, 2009, 25, 8419–8422 CrossRef CAS.
- S. K. M. Nalluri, N. Shivarova, A. L. Kanibolotsky, M. Zelzer, S. Gupta, P. W. J. M. Frederix, P. J. Skabara, H. Gleskova and R. V. Ulijn, Langmuir, 2014, 30, 12429–12437 CrossRef CAS PubMed.
- A. M. Smith, R. J. Williams, C. Tang, P. Coppo, R. F. Collins, M. L. Turner, A. Saiani and R. V. Ulijn, Adv. Mater., 2008, 20, 37–41 CrossRef CAS PubMed.
- Z. Yang, H. Gu, J. Du, J. Gao, B. Zhang, X. Zhang and B. Xu, Tetrahedron, 2007, 63, 7349–7357 CrossRef CAS PubMed.
- M. L. Muro-Small, J. Chen and A. J. McNeil, Langmuir, 2011, 27, 13248–13253 CrossRef CAS PubMed.
- X. Mu, K. M. Eckes, M. M. Nguyen, L. J. Suggs and P. Ren, Biomacromolecules, 2012, 13, 3562–3571 CrossRef CAS PubMed.
- H.-G. Braun and A. Z. Cardoso, Colloids Surf., B, 2012, 97, 43–50 CrossRef CAS PubMed.
- E. Ostuni, P. Kamaras and R. G. Weiss, Angew. Chem., Int. Ed. Engl., 1996, 35, 1324–1326 CrossRef CAS PubMed.
- K. A. Houton, K. L. Morris, L. Chen, M. Schmidtmann, J. T. A. Jones, L. C. Serpell, G. O. Lloyd and D. J. Adams, Langmuir, 2012, 28, 9797–9806 CrossRef CAS PubMed.
- D. J. Adams, K. Morris, L. Chen, L. C. Serpell, J. Bacsa and G. M. Day, Soft Matter, 2010, 6, 4144–4156 RSC.
- P. Terech, N. M. Sangeetha and U. Maitra, J. Phys. Chem. B, 2006, 110, 15224–15233 CrossRef CAS PubMed.
- Y. Wang, L. Tang and J. Yu, Cryst. Growth Des., 2008, 8, 884–889 CAS.
- B. Roy, P. Bairi and A. K. Nandi, Soft Matter, 2012, 8, 2366–2369 RSC.
- D. Braga, S. d'Agostino, E. D'Amen and F. Grepioni, Chem. Commun., 2011, 47, 5154–5156 RSC.
- J. H. van Esch, Langmuir, 2009, 25, 8392–8394 CrossRef CAS PubMed.
- D. M. Ryan, S. B. Anderson, F. T. Senguen, R. E. Youngman and B. L. Nilsson, Soft Matter, 2010, 6, 475–479 RSC.
- D. M. Ryan, T. M. Doran and B. L. Nilsson, Langmuir, 2011, 27, 11145–11156 CrossRef CAS PubMed.
- D. M. Ryan, T. M. Doran and B. L. Nilsson, Chem. Commun., 2011, 47, 475–477 RSC.
- Y. Liu, E. Kim, R. V. Ulijn, W. E. Bentley and G. F. Payne, Adv. Funct. Mater., 2011, 21, 1575–1580 CrossRef CAS PubMed.
- P. Xing, X. Chu, S. Li, M. Ma and A. Hao, ChemPhysChem, 2014, 15, 2377–2385 CrossRef CAS PubMed.
- Z. Yang, H. Gu, D. Fu, P. Gao, J. K. Lam and B. Xu, Adv. Mater., 2004, 16, 1440–1444 CrossRef CAS PubMed.
- Z. A. C. Schnepp, R. Gonzalez-McQuire and S. Mann, Adv. Mater., 2006, 18, 1869–1872 CrossRef CAS PubMed.
- K. Thornton, A. M. Smith, C. L. R. Merry and R. V. Ulijn, Biochem. Soc. Trans., 2009, 37, 660–664 CrossRef CAS PubMed.
- K. Thornton, Y. M. Abul-Haija, N. Hodson and R. V. Ulijn, Soft Matter, 2013, 9, 9430–9439 RSC.
- A. J. Patil, R. K. Kumar, N. J. Barron and S. Mann, Chem. Commun., 2012, 48, 7934–7936 RSC.
- A. Aufderhorst-Roberts, W. J. Frith, M. Kirkland and A. M. Donald, Langmuir, 2014, 30, 4483–4492 CrossRef CAS PubMed.
- Y. Liu, Y. Cheng, H.-C. Wu, E. Kim, R. V. Ulijn, G. W. Rubloff, W. E. Bentley and G. F. Payne, Langmuir, 2011, 27, 7380–7384 CrossRef CAS PubMed.
- S. Roy and A. Banerjee, Soft Matter, 2011, 7, 5300–5308 RSC.
- Y. Wang, Z. Zhang, L. Xu, X. Li and H. Chen, Colloids Surf., B, 2013, 104, 163–168 CrossRef CAS PubMed.
- G. Fields, in Peptide Synthesis Protocols, ed. M. Pennington and B. Dunn, Humana Press, 1995, pp. 17–27 Search PubMed.
- R. Vijay and P. L. Polavarapu, J. Phys. Chem. A, 2012, 116, 10759–10769 CrossRef CAS PubMed.
- P. L. Polavarapu and R. Vijay, J. Phys. Chem. A, 2012, 116, 5112–5118 CrossRef CAS PubMed.
- D. J. Adams, M. F. Butler, W. J. Frith, M. Kirkland, L. Mullen and P. Sanderson, Soft Matter, 2009, 5, 1856–1862 RSC.
- W. J. Frith, A. M. Donald, D. J. Adams and A. Aufderhorst-Roberts, J. Non-Newtonian Fluid Mech., 2015 DOI:10.1016/j.jnnfm.2014.09.008.
- J. Shi, Y. Gao, Z. Yang and B. Xu, Beilstein J. Org. Chem., 2011, 7, 167–172 CrossRef CAS PubMed.
- J. Raeburn, A. Zamith Cardoso and D. J. Adams, Chem. Soc. Rev., 2013, 42, 5143–5156 RSC.
- L. Chen, T. O. McDonald and D. J. Adams, RSC Adv., 2013, 3, 8714–8720 RSC.
- K. L. Morris, L. Chen, A. Rodger, D. J. Adams and L. C. Serpell, Soft Matter, 2015, 11, 1174–1181 RSC.
- K. L. Morris, L. Chen, J. Raeburn, O. R. Sellick, P. Cotanda, A. Paul, P. C. Griffiths, S. M. King, R. K. O'Reilly, L. C. Serpell and D. J. Adams, Nat. Commun., 2013, 4, 1480 CrossRef PubMed.
- L. Pauling and R. B. Corey, Proc. Natl. Acad. Sci. U. S. A., 1951, 37, 729–740 CrossRef CAS.
- K. Morris and L. Serpell, Chem. Soc. Rev., 2010, 39, 3445–3453 RSC.
- A. Saha, S. Bolisetty, S. Handschin and R. Mezzenga, Soft Matter, 2013, 9, 10239–10242 RSC.
- D. J. Adams, L. M. Mullen, M. Berta, L. Chen and W. J. Frith, Soft Matter, 2010, 6, 1971–1980 RSC.
- H. Nowell, S. A. Barnett, K. E. Christensen, S. J. Teat and D. R. Allan, J. Synchrotron Radiat., 2012, 19, 435–441 CrossRef CAS PubMed.
- G. M. Sheldrick, SADABS, University of Gottingen, Germany, 2008 Search PubMed.
- G. M. Sheldrick, Acta Crystallogr., Sect. A: Found. Crystallogr., 2008, 64, 112–122 CrossRef CAS PubMed.
- O. V. Dolomanov, L. J. Bourhis, R. J. Gildea, J. A. K. Howard and H. Puschmann, J. Appl. Crystallogr., 2009, 42, 339–341 CrossRef CAS.
- Collaborative, Acta Crystallogr., Sect. D: Biol. Crystallogr., 1994, 50, 760–763 CrossRef PubMed.
- O. Sumner Makin, P. Sikorski and L. C. Serpell, J. Appl. Crystallogr., 2007, 40, 966–972 CAS.
Footnote |
| † CCDC 1060776–1060778. For crystallographic data in CIF or other electronic format see DOI: 10.1039/c5ce00801h |
| This journal is © The Royal Society of Chemistry 2015 |