 Open Access Article
Creative Commons Attribution 3.0 Unported Licence
Disordered amorphous calcium carbonate from direct precipitation†
Masoud
Farhadi Khouzani
a,
Daniel M.
Chevrier
b,
Patricia
Güttlein
a,
Karin
Hauser
a,
Peng
Zhang
b,
Niklas
Hedin
c and
Denis
Gebauer
*a
aDepartment of Chemistry, Physical Chemistry, University of Konstanz, D-78457 Konstanz, Germany. E-mail: denis.gebauer@uni-konstanz.de
bDepartment of Chemistry & School of Biomedical Engineering, Dalhousie University, Halifax, Canada
cDepartment of Materials and Environmental Chemistry, Stockholm University, SE-10691 Stockholm, Sweden
First published on 1st June 2015
Abstract
Amorphous calcium carbonate (ACC) is known to play a prominent role in biomineralization. Different studies on the structure of biogenic ACCs have illustrated that they can have distinct short-range orders. However, the origin of so-called proto-structures in synthetic and additive-free ACCs is not well understood. In the current work, ACC has been synthesised in iso-propanolic media by direct precipitation from ionic precursors, and analysed utilising a range of different techniques. The data suggest that this additive-free type of ACC does not resemble clear proto-structural motifs relating to any crystalline polymorph. This can be explained by the undefined pH value in iso-propanolic media, and the virtually instantaneous precipitation. Altogether, this work suggests that aqueous systems and pathways involving pre-nucleation clusters are required for the generation of clear proto-structural features in ACC. Experiments on the ACC-to-crystalline transformation in solution with and without ethanol highlight that polymorph selection is under kinetic control, while the presence of ethanol can control dissolution re-crystallisation pathways.
Introduction
ACC has received much attention not only thanks to its pivotal role in biomineralization, but also due to its potential use in biocompatible nanocomposites.1,2 In biomineralization, ACC has different functions, ranging from calcium storage to the pre-moulding of complex structures for mineralized tissues.3,4 Recent studies of biogenic ACCs show that their short-range orders can relate to different crystalline polymorphs.5–7 Having in mind that crystalline polymorphism is specifically controlled in biomineralization, such distinct short-range orders might play a key role in crystalline polymorph selection.3The “pre-structuring” of biogenic ACCs towards the crystal structures, which they eventually transform into, seems to rely upon a complex interplay with bio(macro)molecules, and may be genetically controlled.3 In synthetic ACCs, distinct short-range orders can be induced by the use of additives as well.8 Without any additives, amorphous polymorphism (polyamorphism) has been observed to emerge in ACC when it is formed according to the so-called pre-nucleation cluster pathway.9,10 While this model can mechanistically explain a pH-dependent link observed between CaCO3 pre- and post-nucleation speciation, the derivation of a structural model for ACC polyamorphism remains to be a great challenge.7
A key question is which parameters, besides pH, define the proto-structure of ACC in the absence of any additives. A potential route to proto-vaterite ACC (pv-ACC) has been reported utilizing vortex fluidic syntheses.11 Owing to the rather undefined conditions in vortex mixing, and the presence of ethylene glycol as a potential additive, it is difficult to draw any conclusions regarding alternative pathways to pv-ACC in this particular case. Other novel synthetic routes employing freeze-drying,12 flame sprays,13 precipitation in ethanolic solutions,14 or miniemulsions15 have not been assessed in detail with respect to the obtained proto-structures.
While the potential role of alcohols as additives in aqueous routes to CaCO3 cannot be excluded,16 supersaturated solutions of pH 8.75 and pH 9.80, which contain pre-nucleation clusters and potentially ACC nanodroplets,17 yield proto-calcite ACC (pc-ACC) and pv-ACC, respectively, when quenched in excess alcohol.18 Despite the alcohol excess, both pc-ACC and pv-ACC contain one mole of structural water per mole of calcium carbonate and no traces of the organic solvent, as was demonstrated by thermogravimetric analyses and IR spectroscopy, respectively.18 They can be regarded as additive-free, and of equivalent composition, rendering them polyamorphic forms.7 The role of water in ACC is in the focus of recent research activities,19,20 and it remains unclear whether ACC polyamorphism is inherent to the system calcium–carbonate–water, rather than calcium carbonate alone. A broad range of water contents per mole of additive-free calcium carbonate has been reported. For instance, Radha et al.21 found 1.2–1.58; Michel et al.22 1.19–1.38 moles; Ihli et al.12 0.7 mole; and Rodriguez-Navarro et al.23 0.4–1.4 moles of water molecules per mole of CaCO3. The latter authors suggest that there is a continuous variation in ACC water content, from more hydrated, disordered ACC to less hydrated, proto-structured ACC with only less than 0.4 moles of water per mole of CaCO3 displaying a calcite-like proto-structure.23 It should be emphasized that the pc- and pv-ACCs contain 1 mole of water per mole of CaCO3 showing that distinct short-range orders can also occur in ACCs with higher water contents.18 Moreover, it is noteworthy that a comparison of ACCs with different amounts of water and different short-range orders within the notion of polyamorphism is not straightforward, as they exhibit varying compositions; in analogy with crystalline hydrates, the phenomenon then may be referred to as pseudo-polyamorphism.7
When ACC is precipitated in aqueous environments by direct mixing of solutions with concentrations of 0.1 M calcium and carbonate ions, no distinct proto-structure emerges.24 Such mixtures have very high levels of supersaturation, and likely, ACC is formed via a spinodal pathway.17,23,25 The absence of proto-structures in spinodal ACC strongly suggests that equilibrated pre-nucleation clusters play a key role during binodal pathways to ACC.17 The generation of very high levels of supersaturation by the use of a non-solvent of calcium carbonate — alcohol — hence allows for further insights into the emergence of distinct proto-structures from the point of view of precipitation pathways, and the critical role of water in this context. Here, we obtained ACC by direct mixing of the ionic precursors in ~95% (v/v) isopropanol, and analysed the structure and composition of the ACC nanoparticles by NMR, IR and EXAFS spectroscopies, as well as electron microscopies and TGA. The ACC contains one mole of water per mole of CaCO3, and exhibits no clear proto-structural motifs, whereas any role of pre-nucleation clusters during direct precipitation in isopropanol can likely be excluded. This suggests that the formation of proto-structured ACC requires aqueous routes and moderate levels of supersaturation, that is, precipitation pathways with pre-nucleation clusters. Furthermore, the crystallisation of the disordered ACC in aqueous and solid states has been explored. Polymorph selection is kinetically controlled and depends on the solvent, whereas the least stable form (vaterite) is obtained first, similar as in previous studies.26,27 This is in contrast to other studies where other crystalline polymorphs are formed directly, or indirectly from ACC, with and without additives.28–30
Results and discussion
Fig. 1 shows a TEM image of the obtained spherical particles of ACC with a diameter of ca. 10–15 nm. The diffusive rings in the selected area electron diffraction (SAED) pattern indicate that the particles are indeed amorphous (Fig. 1, inset). The ATR/FTIR spectrum (Fig. 2A) shows typical bands for calcium carbonate; the absence of any sharp bands in the ν4 spectral region, and all-over band positions and shapes are also consistent with ACC (see the ESI,† Table S1). The broad band in the spectral region 2750–3600 cm−1 indicates that the obtained ACC contains water, whereas no bands from the alcohol can be detected (ESI,† Fig. S1). The ν1 band can be used to differentiate between pc- and pv-ACC.18 It is located at a wavenumber of 1073 cm−1, and band shape and position are very similar to those of the ν1 band in pc-ACC (1074 cm−1). However, there are non-systematic differences in all IR-modes (ESI,† Table S1), suggesting that the ACC of this work is not pc-ACC.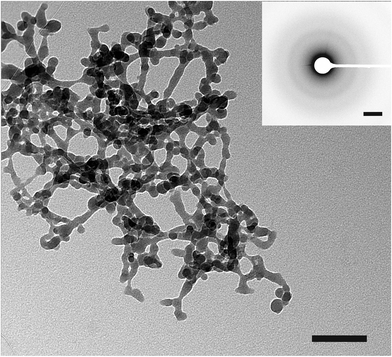 | ||
| Fig. 1 TEM image of ACC from direct precipitation in isopropanol. Negative of SAED is shown in the inset. The scale bars of TEM and SAED are 200 nm and 2 nm−1, respectively. | ||
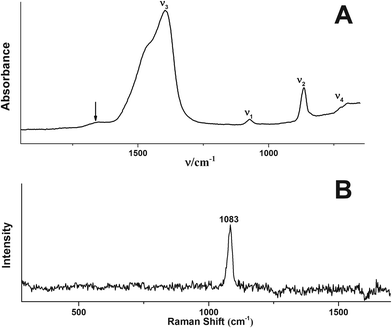 | ||
| Fig. 2 (A) ATR/FTIR spectrum and (B) Raman spectrum of the ACC of this work. (A) The band at ~1640 cm−1 marked with an arrow is due to the OH bending vibration; magnified spectral regions are shown in the ESI† (Fig. S1). | ||
The Raman spectrum (Fig. 2B) does not exhibit distinct bands in the spectral region of 70–360 cm−1 belonging to the lattice modes, whereas the ν1 band is located at 1083 cm−1, which provides further support that the particles are indeed ACC.31
Weight losses in thermogravimetric analysis (TGA, Fig. 3A) of the ACC sample occur at temperatures between 55–218 °C due to the release of water (reduction to 85%), and between 650–820 °C due to the calcination of CaCO3 with the corresponding loss of CO2 from the compound (relative weight reduction to 50%). These losses are in very good agreement with the stoichiometry of CaCO3·H2O and theoretical relative weights of 85% and 48%, respectively. Differential Scanning Calorimetry (DSC) analysis of the ACC sample shows a broad endothermic peak associated with the loss of water molecules (Fig. 3B). It is not symmetric and exhibits a rather complex shape, which is likely due to the disordered structure of ACC and non-homogeneous local environments of the water molecules.20
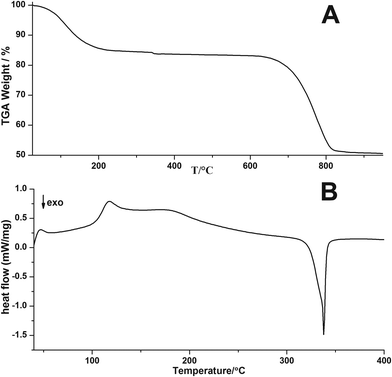 | ||
| Fig. 3 (A) TGA and (B) DSC curves of ACC from direct precipitation in isopropanol (negative gradients indicate exothermic processes). | ||
An exothermic peak is located at 338 °C and is related to the crystallisation of ACC yielding pure-phase calcite (Fig. 4). According to Radha et al. and Ihli et al.19,20 an initial step of water release is related to the loss of physically adsorbed water, whereas a second step is due to the release of stronger bound structural water molecules, rendering the crystallisation of ACC possible. The fact that these are not clearly seen in the current TGA trace (Fig. 3A) — as opposed to earlier reports19,20 — may be due to differences in the types and properties of its hydrous components. Corresponding proton environments are not accessible in NMR analyses, because the ACCs have to be stabilized against crystallisation due to MAS utilizing organic resins. It may be speculated that the apparent “energetic smearing” of water sites that is evident from the continuous water loss in TGA (Fig. 3A) may be due to the rather small size of the ACC nanoparticles studied here.
Fig. 5A shows the solid-state 13C NMR spectra of calcite18 and vaterite18 and of the ACC precipitated directly from isopropanol. The broad resonance of the ACC of this work exhibits a chemical shift of 168.8(5) ppm (also see the ESI,† Fig. S2 and Table S2). Care has been taken to properly reference the chemical shift scale, and the ACC from direct precipitation differs from that of both pc-ACC (168.7 ppm) and pv-ACC (169.5 ppm).18 Indeed, the chemical shift agrees with that of Gastrolith ACC, which has been shown to be “unstructured”.32Fig. 5B shows the Fourier transform of the Ca K-edge extended X-ray absorption fine structure (EXAFS) data (R-space, see Fig. S3† for the k-space) together with a best fit according to the EXAFS equation, in which a dominant Ca–O coordination shell is located at R = 2.44 Å (see the experimental section for details on the EXAFS analysis).
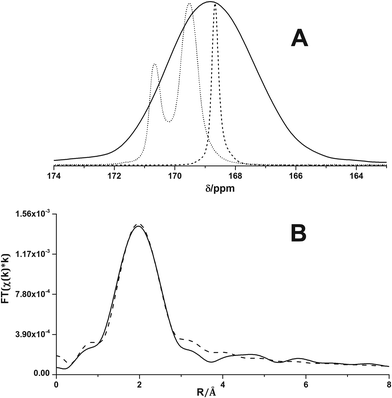 | ||
| Fig. 5 (A) Direct polarization solid-state 13C nuclear magnetic resonance spectra of calcite (dashed), vaterite (dotted) and disordered ACC (solid curve), recorded under magic angle spinning conditions. The calcite and vaterite spectra are taken from ref. 18. (B) Fourier transform of Ca K-edge EXAFS (solid curve) together with fitted curve (dashed). | ||
The first shell Ca–O distance for the ACC sample of this work is significantly longer than average Ca–O bond lengths in proto-structured ones (ESI,† Table S3). The determined Ca–O coordination number (CN) of 5 also exceeds that in pc-ACC and pv-ACC but remains under-coordinated relative to bulk CaCO3 (Table S3†). The higher CN compared to proto-structured ACCs could originate from water molecules coordinating to Ca in addition to carbonate ions. The longer Ca–O distance and lower than bulk Ca–O coordination are consistent with Ca in an amorphous environment.
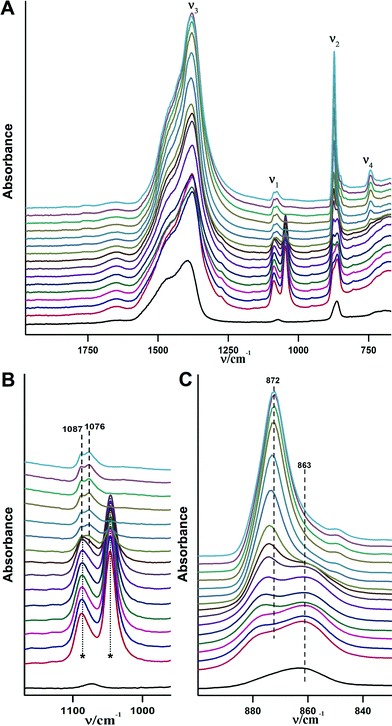
The crystallization of ACC in aqueous environments over time has been monitored using ATR/FT-IR spectroscopy. Fig. 6 illustrates the crystallisation progress over time upon addition of water. Immediately after addition of water (within less than a minute) crystallisation happens. This can be seen from the ν2 band located at 873 cm−1, which immediately develops and indicates the presence of vaterite or calcite. However, strong water absorption overlaps with the carbonate ν4 band, and it is not possible to determine the formed CaCO3 polymorph unambiguously from this band in aqueous solution. Hence, spectra were recorded until the water was completely evaporated and the carbonate ν4 band became clear (see below).
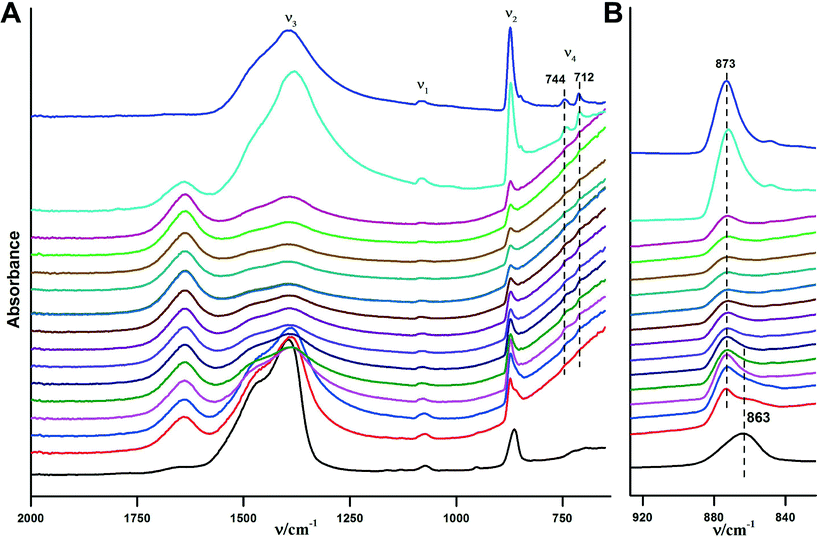 | ||
| Fig. 6 ATR/FTIR spectra illustrating the in situ crystallisation of the obtained ACC upon addition of water over time. The time interval between each spectrum is ~2 minutes, time increases in upward direction. The overall measurement takes about 45 minutes, but there were no changes observed in ten spectra before the last one displayed, which are hence not shown for the sake of clarity. The black spectrum at the bottom is for pure ACC, and the violet spectrum at the top is for the obtained crystalline form, i.e. without added water and dried, respectively (note the ACC contains structural water, cf. Fig. S1†). A) Overview of the ATR/FTIR spectra. B) Magnified ν2 spectral region. | ||
The ν2 band of the ACC located at 863 cm−1 vanishes within 2–10 minutes after the addition of water (Fig. 6B). Spectra recorded at later times show somewhat weaker band intensities when compared with the initial spectrum, which may be related to the partial dissolution of vaterite in water and later on, precipitation of calcite (re-dissolution crystallization).33 The final spectrum of the dried sample (Fig. 6A, top spectrum) shows two bands in the ν4 spectral region, which are located at 712 cm−1 and 744 cm−1 and are indicative of calcite and vaterite, respectively. This shows that the final product is a mixture of these two crystalline polymorphs.
In order to slow down the process of crystallisation, a mixture of 90% ethanol and 10% water (v/v) has been used. The IR-spectra for the crystallisation process after addition of the water–ethanol mixture are shown in Fig. 7. The complete transformation from pure ACC to crystalline calcium carbonate in this case occurred within 20 min, while in the case of pure water the transformation was finished within less than a minute (see above). As it can be seen from Fig. 7B, the overlap between the C–H vibrations of ethanol and the carbonate ν1 band does not allow obtaining information on the crystallization from this band. However, as in the case of the crystallisation in pure water, the ν2 band illustrates the transformation (Fig. 7C). At first, a shoulder for the ν2 band of ACC (863 cm−1) appears at 873 cm−1 within 2–6 minutes; then, this shoulder starts to grow and finally, is the only band that remains in this spectral region. It is noteworthy that there are no pronounced differences among the intensities of the recorded spectra, indicating that CaCO3 dissolution is suppressed due to the presence of the non-solvent, which may be one basic reason for the slowed down kinetics of ACC crystallisation. The final spectra acquired from the dried specimen after crystallisation shows only one band in the ν4 spectral region located at 744 cm−1, indicating that the only obtained phase is vaterite.
Theoretical and experimental works on the effects of ethanol–water binary mixtures (EWBM) on the crystallisation of CaCO3 have suggested that Ca2+ and CO32− are solvated differently and this leads to local inhomoginities and hence to polymorph selection upon changing ethanol/water ratios.27,34–36 However, to the best of our knowledge, all previous works investigated the effect of this mixture during the direct formation of CaCO3 and there is no indication that the EWBM plays the same role during the transformation of as-prepared ACCs. Exploration of the precise role of ethanol during the crystallisation of ACC is beyond the scope of this work. However, based on the previous results and the present preliminary tests, the data corroborates that an important factor for polymorph selection is kinetics. In pure water, the least stable polymorph (vaterite) is produced directly, and then based on dissolution–reprecipitation, some of it afterwards transformes into calcite.33 In excess ethanol, vaterite is the final (kinetically stabilized) product likely because dissolution–reprecipitation processes are inhibited in the non-solvent.
Conclusions
In conclusion, rather large yields of small nanoparticles of ACC are accessible from direct precipitation in isopropanol. These yields will be useful for future in-depth studies of their crystallisation behaviour and has already proved to be usable in materials science.37 Overall, the analyses show that the ACC studied here is distinct from pc- and pv-ACC as it does not exhibit any clear proto-structural motif. Most likely, this relates to the virtually instantaneous precipitation of ACC nanoparticles in isopropanol, occurring without the equilibration of pre-nucleation clusters. Indeed, from the point of view of supersaturation, the exchange of the precipitation medium from water to alcohol is qualitatively analogous to increasing the concentration of the ions within an aqueous system. The rather disordered character of the ACC directly precipitated in alcohol in this work essentially agrees with the ACC precipitated in water from high ion concentrations (i.e. high supersaturation).22 ACC formed from such high levels of supersaturation cannot develop distinct proto-structures. In turn, this suggests that the occurrence of proto-structures relies upon a pathway to ACC that involves equilibration of pre-nucleation clusters at moderate levels of supersaturation.17 Notably, despite being precipitated directly in excess of isopropanol, the ACC contains one mole of water per mole of CaCO3, suggesting that the water molecules coordinated to ion precursors remain within ACC. This indicates that water is inherent to ACC polyamorphism, which remains to be elucidated in detail. Last, the crystallization experiments in water corroborate the notion that the formed polymorphs mainly depend on the kinetics, which is also the case for pc- and pv-ACC.18,19 Interestingly, the EWBM can control dissolution re-crystallisation pathways of ACC transformation.Experimental
Chemicals
All chemicals used in this work were of analytical grade. Sodium carbonate (anhydrous) was retrieved from Fischer Scientific (99.8% w/w). Calcium chloride (anhydrous) was purchased from Merck (99.8% w/w). Isopropanol, ethanol and acetone, which were used as solvents and in washing procedures, were of technical grade. 13C enriched sodium carbonate was purchased from Cambridge Laboratories, Inc. with 99% isotopic enrichment.Synthesis of ACC
50 ml of 10 mM sodium carbonate were poured into a plastic beaker with 2 L isopropanol, and stirred for ca 2 min. Then 50 ml of 10 mM calcium chloride was added to the solution and the beaker was sealed utilizing parafilm. The solution was then stirred for 0.5 h and after collecting the magnet bar and re-sealing the beaker, the solution was kept in a quiet place for 0.5 h. Afterwards, transparent ACCs sediments at the bottom of the beaker were isolated by decanting the supernatant and centrifuging the sediment for ca. 10 min at 9000 rpm. Then, the resulting ACCs were washed with pure isopropanol and re-dispersed with the pure solvent and centrifuged again. The washing process was continued with acetone in the same manner as before, again centrifuged and the resulting ACCs were stored as acetone dispersions.Crystallization experiments
In order to monitor the crystallization of the obtained ACC over time, an in situ crystallization experiment in aqueous media was designed. To that end, about 1 mg of dried and neat ACC sample was placed on the diamond crystal of the ATR/FTIR instrument, and 20 μl pure water, or 90% ethanol and 10% water (v/v), was added to the sample utilizing a micropipette. Then, the ATR spectra of the mixture were continuously recorded. The time interval for every measurement was ca. 2 minutes.ATR/FTIR, Raman, TEM, TGA and DSC analyses
The FT-IR spectra were recorded utilizing a Perkin Elmer spectrometer 100 equipped with diamond ATR crystal. Raman measurements were carried out using a TriVista CRS Raman Microscope. The TEM images were taken utilizing an In-column OMEGA filter microscope (Zeiss Libra 120) operated at 120 kV. In order to avoid the samples to crystallize during the imaging, the optimum size of objective aperture was found to be 130–160 μm. TGA measurements were performed using STA 449 F3 Jupiter® – Simultaneous TGA-DSC under oxygen atmosphere with a rate of 10 K min−1. DSC analysis was accomplished utilizing a DSC 204 F1 Phoenix® under nitrogen atmosphere with a heating rate of 10 K min−1 and the temperature interval was 35–400 °C.Solid-state NMR
Direct polarization 13C solid-state NMR spectra were acquired at a frequency of 100.61 MHz on a Bruker Avance III spectrometer using a 9.4 T wide bore superconducting magnet. The measurements were performed under conditions of magic angle spinning (MAS) with a frequency of 14 kHz for ACC. A 13C pulse length of 70° was used. Special care was taken not to saturate the spectra and to compensate for the magnetic field drift, and high-power 1H decoupling was used. The relaxation delay and the number of collected scans were for the ACC in this work (150 s, 384). The calcite and vaterite spectra are from ref. 18, they were recorded with long recycling delays: calcite (1200 s, 16) and vaterite (720 s, 12).The samples for NMR analyses were prepared using 13C enriched sodium carbonate and the ACC of this work was embedded in epoxy resin in order to avoid crystallization of the sample due to the spinning of the MAS rotor. The embedding of the ACC in epoxy resin was performed using 45 mg of dried and neat ACC, and mixing with 140 mg freshly prepared 2-component epoxy resin (UHU®plus endfest 300). The homogenous mixture of ACC and epoxy resin was allowed to harden and then grinded until a fine powder was achieved.
Extended X-ray absorption fine structure (EXAFS) analysis
Experiments were conducted at the PNC/XSD beamline (Sector 20-BM) of the Advanced Photon Source (Argonne National Laboratory, Argonne, IL, USA). The ACC sample was measured in the solid-phase at room temperature under ambient conditions. The sample was ground with a mortar and pestle and then pressed into a compact pellet for measurement. X-ray absorption data were collected at the Ca K-edge (ca. 4038 eV) using ionization chambers (I0 and IT channels) for transmission measurements. An absorption edge jump (Δμ0) of ca. 0.75 was achieved for the ACC sample. Several scans were collected and averaged to improve the signal to noise ratio. Background subtraction, energy calibration and EXAFS fitting were performed using the WinXAS 3.1 software package. A k-range of 3.5–8.0 Å−1 was used for the Fourier Transform (FT) to R-space (FT-EXAFS, shown in Fig. 5B). For EXAFS fitting, the amplitude reduction factor was fixed at 1, which was determined by fitting a calcite reference EXAFS spectrum and fixing the Ca–O coordination number to 6. A fitting window of 1.2–2.8 Å was used for the EXAFS fitting region for the ACC sample. Theoretical phase and scattering amplitude functions used for fitting Ca–O scattering were calculated using the FEFF8.2 computational package38 using calcite as a model system.39 No other scattering paths were evident in the EXAFS data. Reported uncertainties for EXAFS fitting results were computed from off-diagonal elements of the correlation matrix and weighted by the square root of the reduced chi-squared value.40 The magnitude of experimental noise (determined from 8 to 25 Å in the R-space) was also incorporated in the error calculation.Acknowledgements
DG is a Research Fellow of the Zukunfstkolleg of the University of Konstanz and supported by the Fonds der Chemischen Industrie. NH thanks the Swedish Energy Agency for support, and the Swedish Research Council and the Knut and Alice Wallenberg Foundation for NMR equipment grants. PZ acknowledges funding support from NSERC Canada. The PNC/XSD facilities at the APS are supported by the U.S. DOE-Basic Energy Sciences, NSERC Canada, the University of Washington, the CLS, and the APS. Use of the APS was supported by the U.S. DOE under Contract DEAC02-06CH11357. Technical assistance was provided by Dr. Robert Gordon and Dr. Zou Finfrock.Notes and references
- T. Y. Cheang, S. M. Wang, Z. J. Hu, Z. H. Xing, G. Q. Chang, C. Yao, Y. Liu, H. Zhang and A. W. Xu, J. Mater. Chem., 2010, 20, 8050–8055 RSC.
- Y. Zhao, Z. Luo, M. H. Li, Q. Y. Qu, X. Ma, S. H. Yu and Y. L. Zhao, Angew. Chem., Int. Ed., 2015, 54, 919–922 CrossRef CAS PubMed.
- L. Addadi, S. Raz and S. Weiner, Adv. Mater., 2003, 15, 959–970 CrossRef CAS.
- E. Foran, S. Weiner and M. Fine, Sci. Rep., 2013, 3 Search PubMed.
- Y. Levi-Kalisman, S. Raz, S. Weiner, L. Addadi and I. Sagi, Adv. Funct. Mater., 2002, 12, 43–48 CrossRef CAS.
- S. Raz, P. C. Hamilton, F. H. Wilt, S. Weiner and L. Addadi, Adv. Funct. Mater., 2003, 13, 480–486 CrossRef CAS.
- J. H. E. Cartwright, A. G. Checa, J. D. Gale, D. Gebauer and C. I. Sainz-Díaz, Angew. Chem., Int. Ed., 2012, 51, 11960–11970 CrossRef CAS PubMed.
- R. S. K. Lam, J. M. Charnock, A. Lennie and F. C. Meldrum, CrystEngComm, 2007, 9, 1226–1236 RSC.
- D. Gebauer and H. Cölfen, Nano Today, 2011, 6, 564–584 CrossRef CAS.
- D. Gebauer, A. Völkel and H. Cölfen, Science, 2008, 322, 1819–1822 CrossRef CAS PubMed.
- W. H. Peng, X. J. Chen, S. M. Zhu, C. P. Guo and C. L. Raston, Chem. Commun., 2014, 50, 11764–11767 RSC.
- J. Ihli, A. N. Kulak and F. C. Meldrum, Chem. Commun., 2013, 49, 3134–3136 RSC.
- M. Huber, W. J. Stark, S. Loher, M. Maciejewski, F. Krumeich and A. Baiker, Chem. Commun., 2005, 648–650 RSC.
- S. F. Chen, H. Cölfen, M. Antonietti and S. H. Yu, Chem. Commun., 2013, 49, 9564–9566 RSC.
- R. K. Pai and S. Pillai, CrystEngComm, 2008, 10, 865–872 RSC.
- K. K. Sand, J. D. Rodriguez-Blanco, E. Makovicky, L. G. Benning and S. L. S. Stipp, Cryst. Growth Des., 2012, 12, 842–853 CAS.
- D. Gebauer, M. Kellermeier, J. D. Gale, L. Bergström and H. Cölfen, Chem. Soc. Rev., 2014, 43, 2348–2371 RSC.
- D. Gebauer, P. N. Gunawidjaja, J. Y. P. Ko, Z. Bacsik, B. Aziz, L. J. Liu, Y. F. Hu, L. Bergström, C. W. Tai, T. K. Sham, M. Edén and N. Hedin, Angew. Chem., Int. Ed., 2010, 49, 8889–8891 CrossRef CAS PubMed.
- J. Ihli, W. C. Wong, E. H. Noel, Y. Y. Kim, A. N. Kulak, H. K. Christenson, M. J. Duer and F. C. Meldrum, Nat. Commun., 2014, 5 Search PubMed.
- A. V. Radha and A. Navrotsky, Cryst. Growth Des., 2015, 15, 70–78 CAS.
- A. V. Radha, T. Z. Forbes, C. E. Killian, P. U. P. A. Gilbert and A. Navrotsky, Proc. Natl. Acad. Sci. U. S. A., 2010, 107, 16438–16443 CrossRef CAS PubMed.
- F. M. Michel, J. MacDonald, J. Feng, B. L. Phillips, L. Ehm, C. Tarabrella, J. B. Parise and R. J. Reeder, Chem. Mater., 2008, 20, 4720–4728 CrossRef CAS.
- C. Rodriguez-Navarro, K. Kudlacz, O. Cizer and E. Ruiz-Agudo, CrystEngComm, 2015, 17, 58–72 RSC.
- F. M. Michel, J. MacDonald, J. Feng, B. L. Phillips, L. Ehm, C. Tarabrella, J. B. Parise and R. J. Reeder, Chem. Mater., 2008, 20, 4720–4728 CrossRef CAS.
- M. Faatz, F. Gröhn and G. Wegner, Adv. Mater., 2004, 16, 996–1000 CrossRef CAS.
- M. H. Nielsen, S. Aloni and J. J. De Yoreo, Science, 2014, 345, 1158–1162 CrossRef CAS PubMed.
- K. K. Sand, J. D. Rodriguez-Blanco, E. Makovicky, L. G. Benning and S. L. S. Stipp, Cryst. Growth Des., 2012, 12, 842–853 CAS.
- M. H. Nielsen, S. Aloni and J. J. De Yoreo, Science, 2014, 345, 1158–1162 CrossRef CAS PubMed.
- Y. Politi, T. Arad, E. Klein, S. Weiner and L. Addadi, Science, 2004, 306, 1161–1164 CrossRef CAS PubMed.
- Y. Politi, R. A. Metzler, M. Abrecht, B. Gilbert, F. H. Wilt, I. Sagi, L. Addadi, S. Weiner and P. U. P. A. Gilbert, Proc. Natl. Acad. Sci. U. S. A., 2008, 105, 20045–20045 CrossRef PubMed.
- D. B. Wang, L. M. Hamm, R. J. Bodnar and P. M. Dove, J. Raman Spectrosc., 2012, 43, 543–548 CrossRef CAS.
- R. J. Reeder, Y. Z. Tang, M. P. Schmidt, L. M. Kubista, D. F. Cowan and B. L. Phillips, Cryst. Growth Des., 2013, 13, 1905–1914 CAS.
- J. D. Rodriguez-Blanco, S. Shaw and L. G. Benning, Nanoscale, 2011, 3, 265–271 RSC.
- L. Zhang, L. H. Yue, F. Wang and Q. Wang, J. Phys. Chem. B, 2008, 112, 10668–10674 CrossRef CAS PubMed.
- S. F. Chen, S. H. Yu, J. Jiang, F. Q. Li and Y. K. Liu, Chem. Mater., 2006, 18, 115–122 CrossRef CAS.
- G. W. Yan, L. Wang and J. H. Huang, Powder Technol., 2009, 192, 58–64 CrossRef CAS.
- D. Gebauer, V. Oliynyk, M. Salajkova, J. Sort, Q. Zhou, L. Bergström and G. Salazar-Alvarez, Nanoscale, 2011, 3, 3563–3566 RSC.
- A. L. Ankudinov, B. Ravel, J. J. Rehr and S. D. Conradson, Phys. Rev. B: Condens. Matter Mater. Phys., 1998, 58, 7565–7576 CrossRef CAS.
- S. A. Markgraf and R. J. Reeder, Am. Mineral., 1985, 70, 590–600 CAS.
- M. Newville, B. I. Boyanov and D. E. Sayers, J. Synchrotron Radiat., 1999, 6, 264–265 CrossRef CAS PubMed.
Footnote |
| † Electronic supplementary information (ESI) available: Supplementary figures. See DOI: 10.1039/c5ce00720h |
| This journal is © The Royal Society of Chemistry 2015 |

