 Open Access Article
Creative Commons Attribution 3.0 Unported Licence
Ba3(PO4)2 hierarchical structures: synthesis, growth mechanism and luminescence properties
L. Krishna
Bharat
and
Jae Su
Yu
*
Department of Electronics and Radio Engineering, Kyung Hee University, Yongin-si, Gyeonggi-do 446-701, Republic of Korea. E-mail: jsyu@khu.ac.kr
First published on 2nd June 2015
Abstract
Europium ions-activated flower-like Ba3(PO4)2 phosphor samples with assembled nanoplates were prepared by a facile synthesis route. X-ray diffraction patterns confirmed the single crystal structure with a rhombohedral phase. The synthesis mechanism of these hierarchical structures was explained from scanning electron microscope images taken at different growth times. Transmission electron microscopy was performed to further examine their crystallinity and the structural properties were also studied by Fourier transform infrared spectroscopy analysis. The optical properties were investigated by analyzing the photoluminescence (PL) excitation and emission spectra of the samples. The PL emission spectra showed red emission of trivalent europium (Eu3+) ions along with blue emission due to the reduction of Eu3+ to its divalent (i.e., Eu2+) state. The cathodoluminescence spectra of the samples were almost similar with the PL spectra without any acute changes.
Introduction
In recent years, synthesis of novel inorganic materials with controllable shapes, sizes and dimensions (zero, one, two and three) has gained interest and importance due to their potential applications in various fields such as optics,1,2 electronics3,4 and biology.5,6 More attention has been paid to complex microstructures which are assembled from nanostructured building blocks such as nanoparticles7 or quantum dots8 (zero dimensional), nanorods,9 nanowires,10 or nanoribbons11 (one dimensional), and nanosheets,12 or nanoplates13 (two dimensional). Ba3(PO4)2 is a good host material for luminescence from rare-earth metals.14,15 This host material is made up of tetrahedral PO43− blocks and is extensively used as a laser material in single crystal form as well as an efficient phosphor in powder form. Among the rare-earth doped phosphates, trivalent europium (Eu3+) ions have been studied intensely due to the red emission from intra-configurational f–f transition. The emission properties of europium ions strongly depend on the local environment in the host lattice. The Eu3+ ions give intense red emission, while, in the divalent state, they provide a wide range of emissions from ultraviolet (UV) to red depending on the nature of the host material.16,17Generally, phosphors are prepared by a conventional solid-state reaction method. However, this method produces several impurity phases easily due to poor mixing and low reactivity of raw materials. Moreover, the large size of the particles prepared through this method is also liable. On the other hand, recently, several wet chemical methods have come into the limelight as efficient methods for preparing phosphors with tunable shapes and sizes. The intimate mixing of starting materials, low reaction temperature, and excellent chemical homogeneity make wet chemical methods more reliable. There are few reports on the synthesis of nanocomposites of Ba3(PO4)2 by wet chemical techniques.18–20 To the best of our knowledge, there were no reports found on the synthesis and optical properties of three-dimensional (3D) hierarchical single crystal Ba3(PO4)2 architectures.
In this work, we reported the synthesis of Ba3(PO4)2 microarchitectures formed with the assembly of nanoplates by a facile synthesis route. The optical properties of europium ions-activated Ba3(PO4)2 phosphors were also studied through photoluminescence (PL) and cathodoluminescence (CL) spectroscopy.
Experimental procedure
Flower-like Ba3(PO4)2 structures were prepared by a facile wet chemical precipitation process. The chemicals used in this experiment, like barium nitrate (Ba(NO3)2), ammonium phosphate dibasic ((NH4)2HPO4), sodium hydroxide (NaOH), cetyltrimethylammonium bromide (CTAB) and europium nitrate pentahydrate (Eu(NO3)3·5H2O), were of high purity grade and purchased from Sigma-Aldrich Co. Firstly, solution I was prepared by mixing 3 mmol of barium nitrate and 0.05 g of CTAB in 100 ml of de-ionized (DI) water. Similarly, solution II was prepared by adding 2 mmol of ammonium phosphate to 100 ml of DI water. These two solutions were stirred thoroughly until clear solutions were obtained. Then, the solution II was added slowly to the solution I. The pH was adjusted to 13 using 1 M NaOH solution and the resulting solution was stirred for 10 min at room temperature. Finally, the solution temperature was increased to 80 °C with the help of a hot plate and kept for different reaction times of 2, 4, 6 and 8 h. The final product was filtered, washed with ethanol and DI water, and dried at 60 °C for a day in an ambient atmosphere. Europium ions-doped samples were also prepared by following similar steps with different concentrations of europium (1, 2, 4, 6, and 8 mol%). The proposed chemical reaction for the formation of Ba3(PO4)2 nanocrystalline materials is as follows:| H3PO4 + H2O → H3O+ + H2PO4− |
| H2PO4− + H2O → H3O+ + HPO42− |
| HPO42− + H2O → H3O+ + PO43− | (1) |
 | (2) |
 | (3) |
Initially, (NH4)2HPO4 in water gives phosphoric acid (H3PO4) which is a triprotic acid. Then, PO43− ions were obtained from the three-step ionization process of H3PO4 (eqn (1)). These PO43− ions further reacted with Ba(OH)2 (eqn (2)), resulting in the formation of Ba3(PO4)2 as shown in eqn (3).
Characterization
The as-prepared samples were analyzed by using a field-emission scanning electron microscope (FE-SEM: LEO SUPRA 55, Carl Zeiss), a transmission electron microscope (TEM: JEM-2100F, JEOL), an X-ray diffractometer (XRD: Mac Science, M18XHF-SRA), and a Fourier transform infrared (FTIR) spectroscopy system. Also, room-temperature PL and CL measurements were carried out by using a spectrofluorometer (QM-4/2005SE, PTI) equipped with a xenon arc lamp and a Gatan (UK) MonoCL3 system attached to an SEM (Hitachi S-4300 SE), respectively.Results and discussion
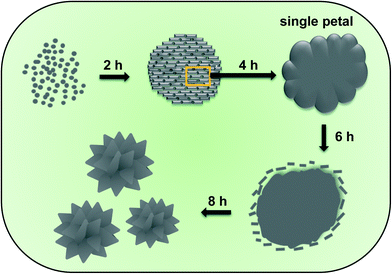
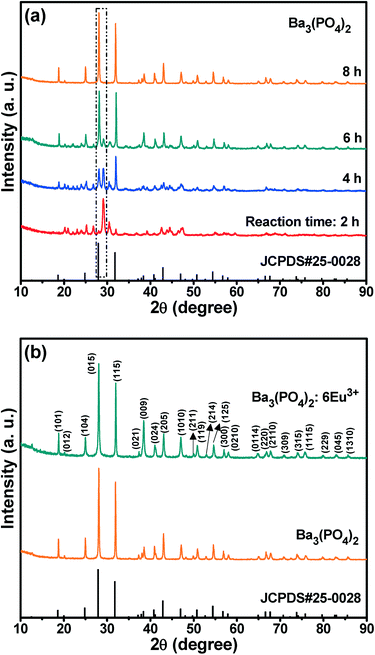
The schematic diagram for the formation of hierarchical Ba3(PO4)2 architectures shown in Fig. 1. Fig. 2(a) shows the XRD patterns of the Ba3(PO4)2 samples prepared at different reaction times of 2, 4, 6, and 8 h. The XRD patterns clearly confirmed the phase formation of Ba3(PO4)2 as a function of reaction time. When the reaction time was set at 2 h, the XRD pattern revealed the peaks related to Ba3(PO4)2, but their intensities were very low. Eventually, as the reaction time increased, the intensity of the peaks related to the pure phase of Ba3(PO4)2 started to increase and that of the other peaks decreased. This can be seen by observing the peaks represented in the box with dotted line borders in Fig. 2(a). The intensity of the peaks around 28° gradually increased with the increase of reaction time, and that of the peaks around 29° decreased and it finally disappeared when the reaction time reached 8 h. At 8 h of reaction time, a pure phase of the compound was formed without any impurity peaks. The XRD patterns of the as-prepared Ba3(PO4)2 sample and the sample activated with 6 mol% Eu3+ ions are shown in Fig. 2(b). From the XRD patterns, it can be observed that the materials were crystallized in rhombohedral phase with the space group R![[3 with combining overline]](https://www.rsc.org/images/entities/char_0033_0305.gif) m and all the peaks matched well with JCPDS #25-0028.
m and all the peaks matched well with JCPDS #25-0028.
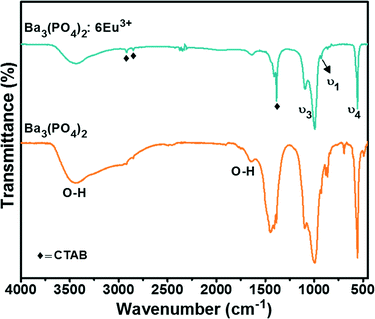
The functional groups present in the compound were analyzed by FTIR spectroscopy of the Ba3(PO4)2 samples with and without doping of 6 mol% Eu3+ ions, as shown in Fig. 3. The bands at 1092, 992 and 927 cm−1 are related to the P–O stretching vibrations (ν3 and ν1) in PO43−. The bending vibrations (ν4) of O–P–O are present at 556 cm−1.21,22 The presence of CTAB is confirmed by the bands at 2918, 2850, 1408, and 1384 cm−1.23 The band at 2918 cm−1 corresponds to the CH2 anti-symmetric stretching vibrations and the band at 2850 cm−1 is related to the symmetric stretching vibrations.24 The CH3 symmetric and anti-symmetric deformation bands are indexed to 1408 and 1384 cm−1, respectively.25 A strong broad band at 3435 cm−1 and a weak broad band at 1634 cm−1 are due to the O–H.26 The O–H bands are related to the water molecules present in the compound and moisture absorbed from the atmosphere.
The morphology and crystallinity of the Ba3(PO4)2 samples prepared via a facile wet chemical precipitation method were characterized from the SEM and TEM images. Fig. 4 shows the SEM images of the flower-like morphologies formed by interconnection of petal-like nanoplatelets. The formation of these flower-like structures was studied in detail by repeating the experiment at different reaction times of 2, 4, 6, and 8 h. The SEM images at 2 h of reaction time showed the formation of rod-shaped nanoparticles. These nanoparticles aggregated spontaneously to form clusters with microsizes due to their high surface energy. The microspheres become the core of the flower-like morphology. Subsequently, when the reaction time reached 4 h, the nanoparticles coalesced together to form flower petal-like structures with thicknesses of approximately 60–80 nm (Fig. 4(b)) due to Ostwald ripening. After 6 h, the flower-like structures were seen more clearly, but there also remained a lot of nanoparticles, as can be seen in Fig. 4(c). As the reaction time increased to 8 h, the formation of well-defined flower-like 3D nanostructures which are composed of nanopetals was observed. The SEM images at the prolonged reaction times of 10, 12, and 14 h were also obtained as shown in Fig. 5. From the SEM images, it is clear that there is very little/no change in the morphology of the obtained products. Thus, the reaction time of 8 h was taken as an optimum value.
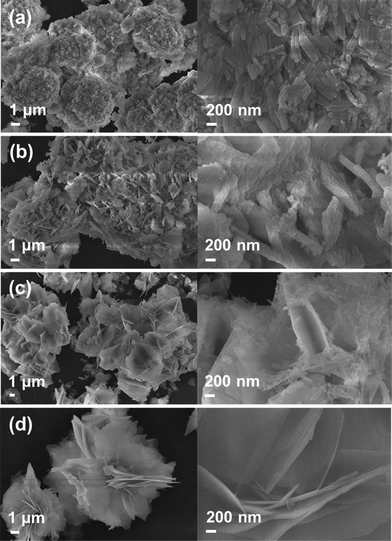 | ||
| Fig. 4 SEM images of the Ba3(PO4)2 samples prepared at different reaction times of (a) 2 h, (b) 4 h, (c) 6 h, and (d) 8 h. | ||
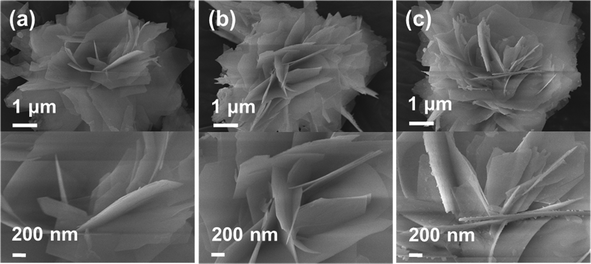 | ||
| Fig. 5 SEM images of the Ba3(PO4)2 samples prepared at different reaction times of (a) 10 h, (b) 12 h, and (c) 14 h. | ||
The TEM images of the Ba3(PO4)2 sample grown at a reaction time of 8 h are shown in Fig. 6. Fig. 6(a) shows the TEM image of a single flower-like 3D Ba3(PO4)2 structure formed with the assembly of nanopetals. The TEM image of a single petal obtained after sonication for few minutes is shown in Fig. 6(b). As shown in Fig. 6(c) and (d), the high-resolution TEM (HRTEM) image and the SAED pattern confirm the crystallinity of the Ba3(PO4)2 sample, respectively. The HRTEM image exhibited a clear lattice fringe with a d-spacing of 2.801 Å, which matches with the JCPDS card value. The SAED image showed a clear dot pattern, confirming the single crystalline nature of the sample. The TEM image and energy-dispersive X-ray analysis (EDAX) pattern of a single Ba3(PO4)2 nanopetal are shown in Fig. 7(a) and (b), respectively. From the EDAX pattern, it can be observed that all the elements in the compound appeared. There existed some elements like Cu and C which are from the grid used for taking TEM images. Fig. 7(c–e) shows the elemental mappings of the single Ba3(PO4)2 nanopetal. The combined elemental mapping of Ba, P and O is presented in Fig. 7(f). The EDAX pattern and elemental mappings also confirm the formation of this compound.
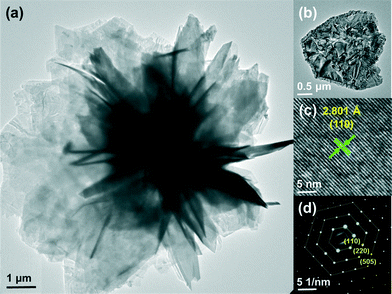 | ||
| Fig. 6 TEM images of (a) a single flower-like 3D Ba3(PO4)2 structure and (b) its single petal, and (c) HRTEM image and (d) SAED pattern of the single Ba3(PO4)2 petal. | ||
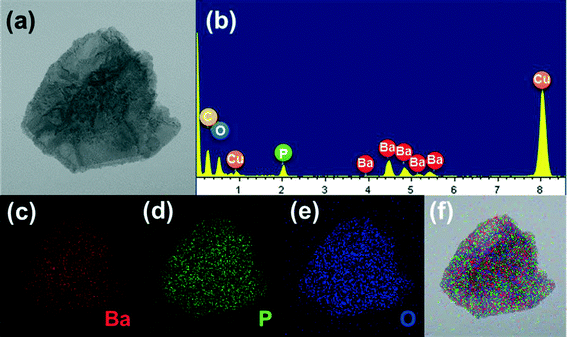 | ||
| Fig. 7 (a) TEM image, (b) EDAX pattern, (c–e) elemental mappings, and (f) combined elemental mapping of a single Ba3(PO4)2 petal. | ||
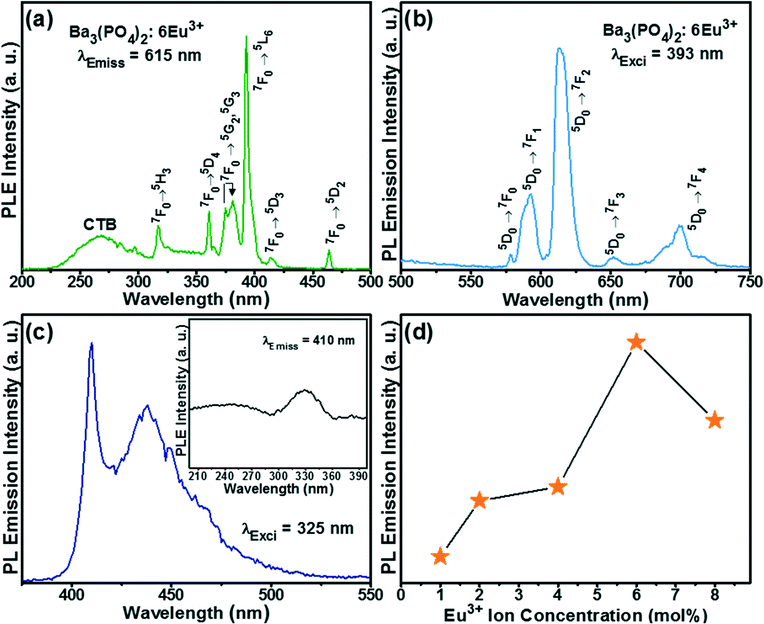
Additionally, the luminescence properties of the flower-like Ba3(PO4)2 sample doped with Eu3+ ions were investigated. Fig. 8(a) shows the PL excitation (PLE) spectrum of the Ba3(PO4)2 sample activated with 6 mol% Eu3+ ions (i.e., Ba3(PO4)2:6Eu3+) observed at an emission wavelength of 615 nm. The spectrum consists of a broad band in the shorter wavelength region called the charge transfer band (CTB) and sharp f–f transition bands of Eu3+ ions in the longer wavelength region. The CTB is due to the charge transfer between the completely filled 2p orbitals of O2− ions and partially filled 4f orbitals of Eu3+ ions. Among the sharp f–f intra-configurational transition peaks of Eu3+ ions, the peak at 393 nm is of the highest intensity and this wavelength is used to observe the emission spectrum. The sharp peaks in the longer wavelength region at 317, 360, 375, 381, 393, 414, and 464 nm were assigned to the transition from the 7F0 ground state to the 5H3, 5D4, 5G2, 5G3, 5L6, 5D3, and 5D2 excited states, respectively.
The PL emission spectrum of the flower-like Ba3(PO4)2:6Eu3+ sample observed at an excitation wavelength of 393 nm is shown in Fig. 8(b). The spectrum consists of peaks in the wavelength range of 575–725 nm due to the emission transition from the 5D0 excited state to the ground states of 7F0, 7F1, 7F2, 7F3, and 7F4.27 The emission peak at 615 nm was of the highest intensity, corresponding to the hypersensitive electric dipole transition of Eu3+ ions in the non-inversion symmetry site. The magnetic dipole transition peak at 592 nm due to the occupancy of Eu3+ ions in the inversion symmetry site was of lower intensity than the peak at 615 nm and is less sensitive to the surrounding environment. The PL emission spectrum of Eu3+ ions-doped Ba3(PO4)2 also showed blue emission upon excitation at a wavelength of 324 nm in the lower wavelength region due to the reduction of Eu3+ to Eu2+ ions.28 The emission spectrum of Eu2+ ions is shown in Fig. 8(c) and the corresponding excitation spectrum is shown in the inset of Fig. 8(c). This spectrum shows the f–d emission band in the wavelength range of 400–450 nm. The reduction of europium from its trivalent state to the divalent state in this host material is caused by the following reasons. The tetrahedral PO43− anions present in this host matrix facilitate the stabilization of Eu2+ ions. Usually, two Eu3+ ions substitute for three Ba2+ ions to keep the electroneutrality of the compound. Thus, one negative Ba2+ vacancy and two positive defects of europium are formed. The electrons on the vacancies would be transferred to the Eu3+ ions and reduced to its divalent (i.e., Eu2+) state.29 The PL emission intensity of the flower-like Ba3(PO4)2:Eu3+ samples as a function of Eu3+ ion concentration is shown in Fig. 8(d). The highest PL emission intensity was obtained at 6 mol% Eu3+ ion concentration.
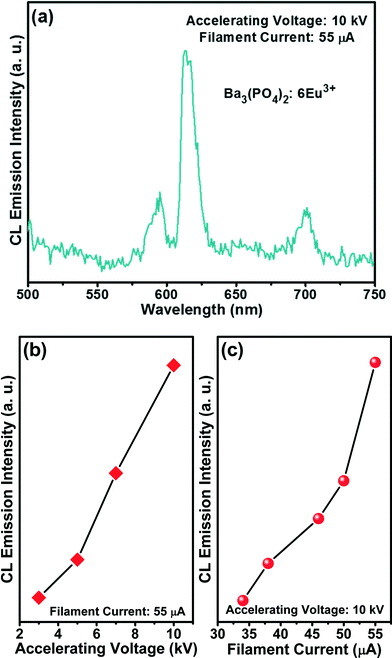
The CL emission spectrum of the flower-like Ba3(PO4)2:6Eu3+ sample taken at 10 kV of accelerating voltage and 55 μA of filament current is shown in Fig. 9(a). The CL spectrum is similar to the PL spectrum, indicating no distinct difference. The CL emission intensities taken at different accelerating voltages with a constant filament current of 55 μA and at different filament currents with a constant accelerating voltage of 10 kV are shown in Fig. 9(b) and (c), respectively. As the accelerating voltage or filament current increased, the emission intensity increased due to the larger electron beam current density and deeper penetration of electrons into the sample. The deeper penetration of electrons gives more room for the generation of plasma by heavy recombination of exciton (electron–hole) pairs, which results in the excitation of a large amount of europium ions from the surface or boundary including the deeper region of the particles.30 The electron penetration depth is proportional to the accelerating voltage based on the equation:31,32
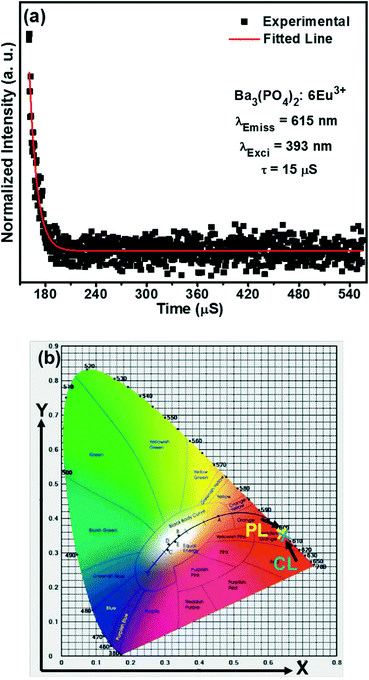
The decay curve of the Ba3(PO4)2:6Eu3+ sample observed at 615 nm of emission wavelength and 393 nm of excitation wavelength is shown in Fig. 10(a). The calculated lifetime is found to be ~15 μs. The Commission Internationale de l'Eclairage (CIE) chromaticity coordinates calculated from the PL and CL emission spectra are shown in Fig. 10(b). The wavelength range of 500–700 nm is taken to calculate the CIE values. The two values are almost similar and found in the reddish-orange region.
Conclusion
In summary, flower-like hierarchical 3D Ba3(PO4)2 architectures were synthesized by a facile wet chemical technique. The flowers were formed with the assembly of nanoplates with thicknesses of a few tens of nanometers. The XRD patterns confirmed the single crystal structure with a rhombohedral phase. The Eu3+ ions-activated flower-like Ba3(PO4)2 phosphors showed red emission when excited at near-UV wavelengths. These phosphors also showed blue emission in the lower wavelength region due to the reduction of Eu3+ to Eu2+ ions in the host lattice. The aliovalent replacement between Eu3+ and Ba2+ ions which results in electronegative defects and the rigid PO43− tetrahedral anion are responsible for the reduction of Eu3+ to Eu2+ ions.Acknowledgements
This work was supported through a National Research Foundation of Korea (NRF) grant funded by the Korean government (MSIP) (no. 2014-069441).References
- D. Thi My Dung, L. Thi Tuyet Thu, F.-B. Eric and D. Mau Chien, Adv. Nat. Sci.: Nanosci. Nanotechnol., 2011, 2, 015009 CrossRef.
- M. Shivaram, H. Nagabhushana, S. C. Sharma, S. C. Prashantha, B. Daruka Prasad, N. Dhananjaya, R. Hari Krishna, B. M. Nagabhushana, C. Shivakumara and R. P. S. Chakradhar, Spectrochim. Acta, Part A, 2014, 128, 891–901 CrossRef CAS PubMed.
- D.-H. Kim, N. Lu, R. Ghaffari and J. A. Rogers, NPG Asia Mater., 2012, 4, e15 CrossRef PubMed.
- H. Won-Suk, H. Jae-Min, K. Hak-Sung and S. Yong-Won, Nanotechnology, 2011, 22, 395705 CrossRef PubMed.
- C. Arijit Kumar, S. Raj Kumar, C. Asoke Prasun, A. Pulakesh, C. Ruchira and B. Tarakdas, Nanotechnology, 2012, 23, 085103 CrossRef PubMed.
- P. C. Ray, Chem. Rev., 2010, 110, 5332–5365 CrossRef CAS PubMed.
- H. Li, L. Shen, G. Pang, S. Fang, H. Luo, K. Yang and X. Zhang, Nanoscale, 2015, 7, 619–624 RSC.
- S. Yang, C.-F. Wang and S. Chen, J. Am. Chem. Soc., 2011, 133, 8412–8415 CrossRef CAS PubMed.
- H. Xue, Z. Li, H. Dong, L. Wu, X. Wang and X. Fu, Cryst. Growth Des., 2008, 8, 4469–4475 CAS.
- X. Guo, L. Fang and Y. Tan, Phys. Chem. Chem. Phys., 2015, 17, 2794–2803 RSC.
- Z. Sun, J. H. Kim, Y. Zhao, F. Bijarbooneh, V. Malgras, Y. Lee, Y.-M. Kang and S. X. Dou, J. Am. Chem. Soc., 2011, 133, 19314–19317 CrossRef CAS PubMed.
- J. S. Chen, Y. L. Tan, C. M. Li, Y. L. Cheah, D. Luan, S. Madhavi, F. Y. C. Boey, L. A. Archer and X. W. Lou, J. Am. Chem. Soc., 2010, 132, 6124–6130 CrossRef CAS PubMed.
- Y.-Z. Zheng, H. Ding, E. Uchaker, X. Tao, J.-F. Chen, Q. Zhang and G. Cao, J. Mater. Chem. A, 2015, 3, 1979–1985 CAS.
- H. Ji, Z. Huang, Z. Xia, M. S. Molokeev, V. V. Atuchin, M. Fang and Y. Liu, J. Phys. Chem. C, 2015, 119, 2038–2045 CAS.
- M. Peng, J. Lei, L. Li, L. Wondraczek, Q. Zhang and J. Qiu, J. Mater. Chem. C, 2013, 1, 5303–5308 RSC.
- J. Y. Han, W. B. Im, G.-Y. Lee and D. Y. Jeon, J. Mater. Chem., 2012, 22, 8793–8798 RSC.
- R.-J. Xie, N. Hirosaki, T. Suehiro, F.-F. Xu and M. Mitomo, Chem. Mater., 2006, 18, 5578–5583 CrossRef CAS.
- C. Mu and J. He, Mater. Lett., 2012, 70, 101–104 CrossRef CAS PubMed.
- B. Zhu, F. Yuan, X. Yuan, Y. Bo, Y. Wang, G.-Y. Yang, G. C. Drummen and X. Zhu, J. Nanopart. Res., 2014, 16, 1–8 Search PubMed.
- M. Tong, J. Zhao, Y. Liang, Y. Zhu, X. Wu, S. Liu, C. Yan and G. Li, RSC Adv., 2015, 5, 27517–27525 RSC.
- Z.-Y. Xue and G. L. Schrader, J. Phys. Chem. B, 1999, 103, 9459–9467 CrossRef CAS.
- R. W. Mooney, S. Z. Toma, R. L. Goldsmith and K. H. Butler, J. Inorg. Nucl. Chem., 1968, 30, 1669–1675 CrossRef CAS.
- R. A. Campbell, S. R. W. Parker, J. P. R. Day and C. D. Bain, Langmuir, 2004, 20, 8740–8753 CrossRef CAS PubMed.
- K. H. S. Kung and K. F. Hayes, Langmuir, 1993, 9, 263–267 CrossRef CAS.
- S. Wang, H. Xu, L. Qian, X. Jia, J. Wang, Y. Liu and W. Tang, J. Solid State Chem., 2009, 182, 1088–1093 CrossRef CAS PubMed.
- L. Krishna Bharat, S. H. Lee and J. S. Yu, Mater. Res. Bull., 2014, 53, 49–53 CrossRef CAS PubMed.
- M. Ajmal and T. S. Atabaev, Opt. Mater., 2013, 35, 1288–1292 CrossRef CAS PubMed.
- S. H. M. Poort, J. W. H. van Krevel, R. Stomphorst, A. P. Vink and G. Blasse, J. Solid State Chem., 1996, 122, 432–435 CrossRef CAS.
- H. Liang, Y. Tao, Q. Zeng, H. He, S. Wang, X. Hou, W. Wang and Q. Su, Mater. Res. Bull., 2003, 38, 797–805 CrossRef CAS.
- L. Krishna Bharat, B. Vengala Rao and J. S. Yu, Chem. Eng. J., 2014, 255, 205–213 CrossRef CAS PubMed.
- G. Seeta Rama Raju, E. Pavitra and J. S. Yu, Phys. Chem. Chem. Phys., 2014, 16, 18124–18140 RSC.
- K. N. Shinde, S. J. Dhoble, H. C. Swart and K. Park, Phosphate Phosphors for Solid-State Lighting, Springer-Verlag, Berlin Heidelberg, 1st edn, 2012.
| This journal is © The Royal Society of Chemistry 2015 |


