
Three anhydrous forms and a dihydrate form of quifenadine hydrochloride: a structural study of the thermodynamic stability and dehydration mechanism†
Artis
Kons
*a,
Ligita
Rutkovska
a,
Agris
Bērziņš
a,
Raitis
Bobrovs
ab and
Andris
Actiņš
a
aFaculty of Chemistry, University of Latvia, Kr. Valdemara iela 48, Riga, Latvia. E-mail: artis.kons@lu.lv.
bFormulation and Drug Delivery Research Group, School of Pharmacy and Biomolecular Sciences, Liverpool John Moores University, Liverpool, UK
First published on 8th April 2015
Abstract
Crystal structures of dihydrate (DH) and three anhydrous forms (A, B and C) of quifenadine (1-azabicyclo[2.2.2]oct-8-yl-diphenyl-methanol) hydrochloride are presented, and crystal structure information is used to explain and rationalize the relative stability of polymorphs and observed phase transformations. The dehydration mechanism of the hydrate is provided by interpreting the results obtained in studies of crystal structures, dehydration kinetics and thermal analysis. Structural analysis is used to explain the observed relative stability of the anhydrous phases and the hydrate. The crystal structures have been determined either from single crystal (form DH) or from powder diffraction data (forms A, B and C). All three polymorphs consist of similar hydrogen bonded tetramers, and the structural differences arise due to differences in conformation or/and molecular packing.
Introduction
Polymorphism is the ability of compounds to crystallize into different crystalline modifications. If solvent molecules are incorporated in the crystal lattice along with the host molecules in either stoichiometric or nonstoichiometric ratio, then the resulting phase is called a solvate or pseudopolymorph. Polymorphism and pseudopolymorphism of an active pharmaceutical ingredient (API) have an influence on its solubility, bioavailability and stability. Therefore, identification of polymorphs and pseudopolymorphs, comparison of their physicochemical properties and understanding conditions of transformations between crystalline forms are very important.1–3From pharmaceutical and supramolecular points of view, the knowledge of polymorph and pseudopolymorph crystal structures gives general information about their stability, formation pathways and also physicochemical properties. Moreover, studies on the polymorphism of organic systems can lead to generalization of the fundamental aspects of the structure–property relationship.4,5 Therefore, crystal structure determination of pharmaceutically active compounds during the crystalline phase screening process is advisable.
Commonly, the crystal structure is determined from single-crystal X-ray diffraction data. However, many crystalline solids cannot be prepared in the form of an appropriate single crystal. In such a case, powder X-ray diffraction methods can be used to extract structural information. The development of direct-space approaches for structure solution has given the opportunity to solve crystal structures even from diffraction data recorded using laboratory X-ray powder diffraction instrumentation.6,7
Quifenadine (1-azabicyclo[2.2.2]oct-8-yl-diphenyl-methanol), a quinuclidine derivative, is an antihistaminic agent that decreases the impact of histamine by blocking histamine H1-receptors in the peripheral tissues and activates the enzyme diamine oxidase (histaminase).8,9 To the best of our knowledge, there are no reports on the existence of polymorphs or solvates of quifenadine hydrochloride.
In the present paper, thermal analytical techniques (differential thermal analysis, thermogravimetric analysis and hot-stage microscopy), powder and single-crystal X-ray diffractometry, and gravimetric moisture sorption studies were employed to characterize the solid state forms of quifenadine hydrochloride. Crystal structures of three anhydrous forms and a hydrate are presented, and crystal structure information is used to explain and rationalize the relative stability of polymorphs and observed phase transformations. Structural transformations during the dehydration process of hydrate have been interpreted and the relative stabilities of anhydrous phases and the hydrate have been evaluated.
Experimental section
Materials
Quifenadine hydrochloride (purity >99%) was obtained from JSC Olainfarm (Olaine, Latvia). The sample consisted of a commercial racemic mixture of polymorph A. Inorganic compounds and organic solvents of analytical grade were purchased from commercial sources and used without further purification.Sample preparation
Dihydrate DH was prepared by recrystallizing quifenadine hydrochloride from water and stored under ambient conditions. Single crystals of DH were obtained by slow evaporation from a mixture of acetonitrile/water (95/5 v/v) and stored in mother liquor under ambient conditions. Anhydrous form B was obtained by dehydration of DH at 80 °C or 0% relative humidity and stored over a desiccant. Anhydrous form C was prepared by recrystallizing from n-butanol or iso-butanol and stored under ambient conditions. Anhydrous form A was used without further purification.Single-crystal X-ray diffraction (SCXRD)
The single-crystal X-ray diffraction data for quifenadine hydrochloride DH was collected at 173 K using a Nonius Kappa CCD diffractometer with Mo Kα radiation (λ = 0.71073 Å) and an Oxford Cryostream open-flow nitrogen cryostat for sample temperature control. The structure was solved by direct methods in OLEX2 (ref. 10) software and refined by full-matrix least-squares on F2 using SHELXL.11 All non-hydrogen atoms were refined anisotropically. The most disagreeable reflections with Δ(F2) values greater than 5 su were omitted (6 reflections with hkl indices: 0 1 2; 2 –3 2; 1 –3 4; 3 –3 2; −2 −2 8 and −2 −1 6). Mercury 3.3 (ref. 12) software was used for crystal structure analysis and simulation of powder X-ray diffraction patterns based on crystal structure data. Crystallographic face indexing of quifenadine dihydrate was done at room temperature. Face indexing was performed using Collect software.13Powder X-ray diffraction (PXRD)
For routine measurements of phase composition, the PXRD patterns were recorded on a Bruker D8 Advance diffractometer using copper radiation (CuKαλ = 1.54180 Å) with Bragg–Brentano geometry and LynxEye (1D) detector. The tube voltage and current were set to 40 kV and 40 mA, respectively. The divergence and antiscattering slits were set at 0.6 mm, and the receiving slit was set at 8 mm. The patterns were recorded from 3° to 30° on the 2θ scale, using a scan speed of 0.2 s per 0.02°.For structure determination, PXRD patterns were recorded on a Bruker D8 Discover diffractometer using copper radiation (CuKαλ = 1.54180 Å) in transmission mode and LynxEye (1D) detector. The tube was employed with voltage and current settings of 40 kV and 40 mA. The sample was loaded into a special glass Nr. 10 capillary (0.5 mm diameter). A capillary spinner (60 rpm) was used to minimize instrumental and sample packing aberrations. The incident beam path of the diffractometer was equipped with a Göbel mirror, Soller slits, and a 0.6 mm divergence slit, while the diffracted beam path was equipped only with Soller slits. The diffraction patterns were recorded from 3 or 5 to 70° on the 2θ scale at a 0.01° step size using a scan speed of 20 s per step.
Structure determination from powder X-ray diffraction data
Indexing of powder diffraction patterns of quifenadine hydrochloride A, B and C forms was carried out with programs Dicvol91 (ref. 14) and X-Cell15,16 using the first 25 reflections (2θ < 35°). All forms were indexed with a triclinic unit cell. The cell and diffraction pattern profile parameters were refined using the Pawley method17 (Rwp = 2.29%, Rp = 1.40% for A; Rwp = 1.09%, Rp = 0.75% for B and Rwp = 2.33%, Rp = 1.77% for C). The space group for all forms was assigned to P![[1 with combining macron]](https://www.rsc.org/images/entities/char_0031_0304.gif) with Z = 2.
with Z = 2.
The trial geometry model was generated by optimizing the quifenadine molecule using DFT-D within the DMol3 module18 in Materials Studio 7 using the PBE functional19 and a dispersion correction according to Grimme.20
The Monte Carlo/Simulating Annealing search algorithm in the MS Powder Solve package was used to constantly adjust the conformation, position, and orientation of the trial model in the unit cell in order to maximize the agreement between the calculated and the measured diffraction data. The structural solution obtained from the Powder Solve was refined by Rietveld refinement based on the measured powder X-ray diffraction pattern. In the Rietveld refinement, cell parameters, the position and orientation of motion groups, torsion angles, thermal vibration, and preferred orientation parameters (using March–Dollase model21,22) were optimized to get the optimum crystal structure. Aromatic rings were treated as rigid groups. The final Rietveld refinement showed a good agreement between the observed and the calculated profiles (Fig. 2). Relevant crystal data and refinement details for A, B, C and DH are summarized in Table 1.
| Cell parameters | A form | B form | C form | DH form |
|---|---|---|---|---|
| Chemical formula | C20H24NOCl | C20H24NOCl | C20H24NOCl | C20H24NOCl·2H2O |
| Formula weight | 329.86 | 329.86 | 329.86 | 365.88 |
| Sample type | Powder | Powder | Powder | Single crystal |
| Crystal system | Triclinic | Triclinic | Triclinic | Triclinic |
| Space group |
P |
P |
P |
P |
| Temperature | 293(2) | 293(2) | 293(2) | 173(2) |
| a, Å | 6.372(2) | 6.408(5) | 6.449(2) | 6.339(1) |
| b, Å | 12.699(5) | 9.281(6) | 12.951(3) | 8.601(2) |
| c, Å | 10.759(4) | 18.356(2) | 11.222(2) | 18.404(5) |
| α, ° | 96.03(2) | 113.09(3) | 97.60(1) | 100.02(2) |
| β, ° | 98.88(2) | 83.62(3) | 106.61(2) | 92.32(3) |
| γ, ° | 80.68(2) | 116.50(3) | 75.25(2) | 103.45(2) |
| V, Å3 | 845.9(1) | 895.8(1) | 862.9(1) | 957.5(3) |
| ρ calc, g cm−3 | 1.295 | 1.223 | 1.270 | 1.269 |
| Z (Z′) | 2 (1) | 2 (1) | 2 (1) | 2 (1) |
| R wp (Rp)/R1 (wR2), % | 2.81 (1.89) | 1.41 (0.99) | 3.12 (2.32) | 4.8 (14.8) |
Calculation of lattice and interaction energy in PIXEL
The crystal lattice and interaction energy calculations were performed according to the semiempirical PIXEL methodology (with code provided in the CLP software suite). Empirical parameters were used as provided in the literature.23 The atom positions for the purposes of this calculation were obtained by a standard procedure using RETCIF and RETCOR modules. The hydrogen atom positions were renormalized. Molecular electron density calculations were performed in Gaussian 09 (ref. 24) at the MP2/6-31G(d,p) level using standard grid parameters. The condensation level 4 and a calculation cutoff value of 40 Å were used.Differential thermal analysis/thermogravimetric analysis (DTA/TG)
DTA/TG analysis was performed using an Exstar6000 TG/DTA6300 (SII) instrument. Open aluminium pans were used. Heating of samples from 30 °C to 320 °C was performed at a heating rate of 10 °C min−1 under 100 mL min−1 nitrogen flow. The sample mass was approximately 5–7 mg.Gravimetric determination of water content
The water sorption and desorption processes of B and DH were measured in desiccators with controlled relative humidity (RH). To provide a variety of RH values, saturated salt solutions and P2O5 were used. The salts used for this experiment and the corresponding RH values were LiBr (6%), LiCl (11%), CH3CO2K (23%), MgCl2 (32%), NaBr (56%), KI (68%), NaCl (75%), KCl (84%), K2SO4 (97%), and also P2O5 (∼0%).25Dehydration kinetics
Nonisothermal experiments were performed at heating rates of 0.5, 2, 3, 4, 5 and 10 °C min−1, and isothermal studies were carried out at 30–70 °C using an Exstar6000 TG/DTA6300 (SII) apparatus. For isothermal studies, the heater unit was preset to the required temperature allowing fast stabilization of the necessary temperature at the start of the experiment. The sample mass was 6.0 ± 0.5 mg, and the nitrogen flow rate was 100 ± 10 mL min−1.Hot stage microscopy (HSM)
For thermo-microscopic investigations, a Laborlux 12 PolS (Leitz) polarized light microscope equipped with a heating stage and a Newtronic heating control module was used. The heating rate was 5° min−1. Images were collected using Leica Application Suite software from a DFC450 (Leica) digital microscope camera.Results and discussion
An initial polymorph screening of quifenadine hydrochloride was performed by recrystallization from 16 solvents (water, methanol, ethanol, n-propanol, iso-propanol, n-butanol, iso-butanol, acetone, ethyl acetate, acetonitrile, dichloromethane, chloroform, toluene, 1,4-dioxane, dimethylformamide and dimethyl sulfoxide) at variable temperatures. Through the screening process, quifenadine hydrochloride was found to crystallize in three crystalline modifications: two polymorphs (A and C) and dihydrate (DH). Additional polymorph B was obtained by dehydration of DH.Thermal analysis
The DTA and TG thermal profiles of all crystalline forms are illustrated in Fig. 3. No thermal event was observed for forms A and C in the temperature range prior to the degradation near 320 °C, confirming that these forms are unsolvated. One small exothermal event (at 168 °C) was observed for form B in the temperature range until the onset of degradation. This exothermal effect is attributed to a solid-state phase transition from form B to A as confirmed by PXRD analysis, which substantiates the monotropic relationship between these polymorphs on the basis of the heat of transition rule.26Dehydration of form DH was observed as an endothermic peak in the DTA over a temperature range from 40 °C to 80 °C and associated weight loss of 9.5% in the TGA. A mass loss of 9.5% corresponds to 1.92 mol of water, which is only slightly below the theoretical value of 2 mol of water per mole of quifenadine hydrochloride. No further weight loss was observed until the material began to degrade at 320 °C. The dehydration product was polymorph B, as confirmed by the PXRD analysis. After the dehydration, an exothermic effect observed at 171 °C corresponds to phase transition from polymorph B to form A.
Thermodynamic stability of quifenadine hydrochloride polymorphs
To better understand the relative thermodynamic relationships of quifenadine hydrochloride polymorphs, solvent-mediated slurry-bridging (SMSB) experiments were carried out at various temperatures. Mixtures of forms A/B, A/C and B/C were slurried in acetone and tetrahydrofuran at 5 and 25 °C, in acetonitrile at 60 °C and in butyl acetate at 120 °C. That resulted in conversion of mixtures of A/B and A/C to pure form A at all temperatures and similarly a mixture of polymorphs B/C converted to form C. These observations indicate that form A is the most thermodynamically stable form at all studied temperatures and form C is more thermodynamically stable than form B.On the basis of the density rule,26 the most stable crystal structure should have the highest density. As shown in Table 1, the density values calculated from crystal structure data for forms A, B, and C indicate that the stability follows the order of A > C > B. Additionally, a comparison of the stability of forms A, B and C was performed using calculation of the crystal lattice energy for these forms with PIXEL software. As expected, form A has the most negative total lattice energy of −382.7 kJ mol−1 and therefore is the most stable form at 0 K, followed by form C (−371.4 kJ mol−1) and form B with the highest lattice energy of −361.5 kJ mol−1. Therefore the lattice energy calculations correlate with conclusions obtained from SMSB experiments and crystal density results.
These observations indicate that form A is the most thermodynamically stable form at all temperatures and has a monotropic relationship with both forms B and C. Polymorphs B and C also have a monotropic relationship with form C being thermodynamically more stable than form B.
Moisture sorption experiments
In moisture sorption/desorption experiments, both the weight change and the phase composition of the samples were determined. The moisture sorption/desorption isotherms of quifenadine hydrochloride forms B/DH (Fig. 4) show that the anhydrous form B is stable (i.e., does not absorb water) up to 11% relative humidity (RH). Under higher moisture conditions, the sample takes up water and transforms to DH. The measured mass increase of 9.5% is in agreement with thermogravimetric measurement (1.92 mol of water). By decreasing the humidity, when the RH is less than 6%, the dehydration of DH occurs and polymorph B is obtained. The distinct steps and the presence of hysteresis between the sorption and desorption isotherms are characteristic of stoichiometric hydrates. However, small hysteresis (~5% of RH) shows that this reversible phase transformation has a low energy barrier suggesting that crystal structures of these two forms can be similar. The sorption/desorption isotherms show that DH is a very stable hydrate, which releases water only at very low relative humidity, whereas form B is an unstable anhydrous phase, absorbing water already at 11% RH.Moisture sorption analysis of form C showed that it was stable up to 89% RH (for 2 months), while at higher RH it transformed to form DH, but form A was stable up to 100% RH and transformation to DH was not observed after 2 months.
Analysis of the crystal structures
Structures of polymorphs A, B, and C were determined using powder X-ray diffraction data, but the structure of DH was determined using single-crystal X-ray diffraction data. Crystallographic data for all forms are shown in Table 1. All these crystalline modifications crystallize in the P space group. The crystal structure of each polymorph contains one quifenadine cation and one chloride anion in the asymmetric unit, whereas dihydrate contains additional two water molecules in the asymmetric unit.
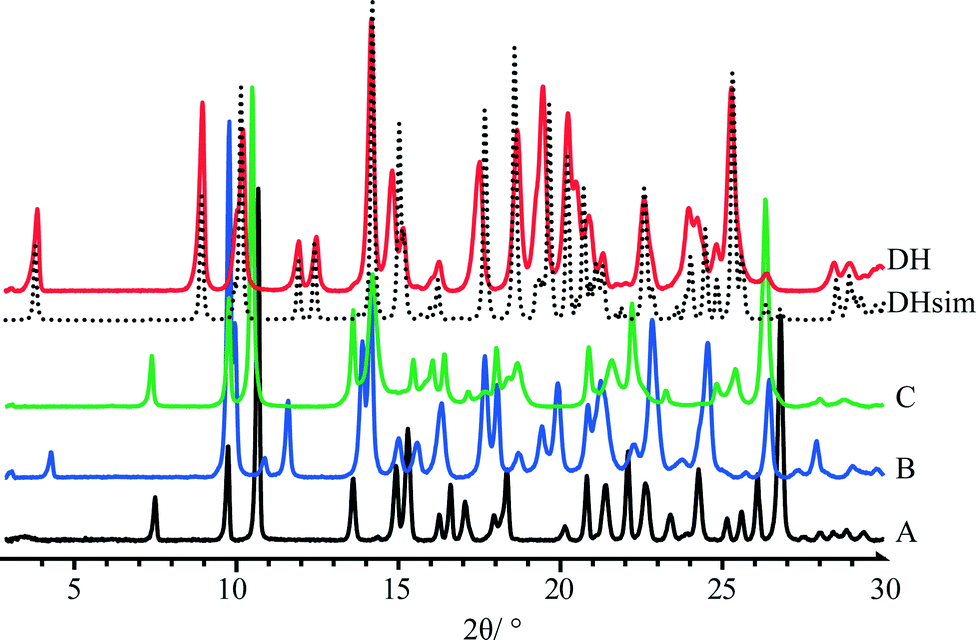
Overlay of powder X-ray diffraction (PXRD) patterns of quifenadine hydrochloride polymorphs and dihydrate is depicted in Fig. 5. Each form has a unique and distinguishable PXRD pattern. A comparison of PXRD patterns shows that forms A and C have similar positions and intensities of first four peaks suggesting structural similarities. The agreement between the experimental and crystal structure simulated PXRD patterns of DH confirms the identity of the polycrystalline phase.
A quifenadine molecule consists of two terminal phenyl groups, one quinuclidine moiety and one hydroxyl group linked together by a quaternary carbon. The conformational state of the quifenadine cation in all four structures is compared in Fig. 6, and the torsion angle values are summarized in Table 2 (numbering of atoms is given in Fig. 1). This analysis was carried out using the molecules of identical enantiomers in a quifenadine hydrochloride racemic mixture. It can be seen that the molecular conformation in all four forms is very similar and only minor conformational differences arise mainly due to rotation of phenyl groups and quinuclidine moiety around C(3)–C(1), C(4)–C(1) and C(2)–C(1) bonds. The torsion angle ∠C2–C1–C3–C8 in the DH structure is closest to the corresponding angle found in the cation of form B, whereas the torsion angles ∠C2–C1–C4–C10 and ∠C3–C1–C2–C6 in the DH structure are closest to the corresponding angles found in the cation of form C.
| ∠C2–C1–C3–C8 | ∠C2–C1–C4–C10 | ∠C3–C1–C2–C6 | |
|---|---|---|---|
| A | −36.9(3) | 46.2(3) | 174.0(2) |
| B | −24.0(6) | 60.5(10) | 179.3(4) |
| C | −44.1(4) | 59.0(4) | 172.2(2) |
| DH | −15.9(2) | 61.9(2) | 169.88(14) |
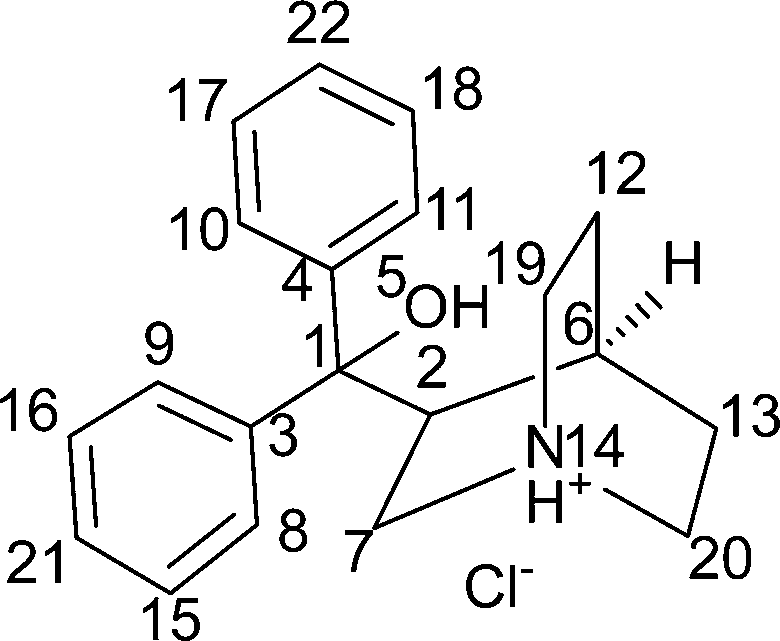 | ||
| Fig. 1 Molecular structure of quifenadine hydrochloride with the numbering of non-hydrogen atoms. | ||
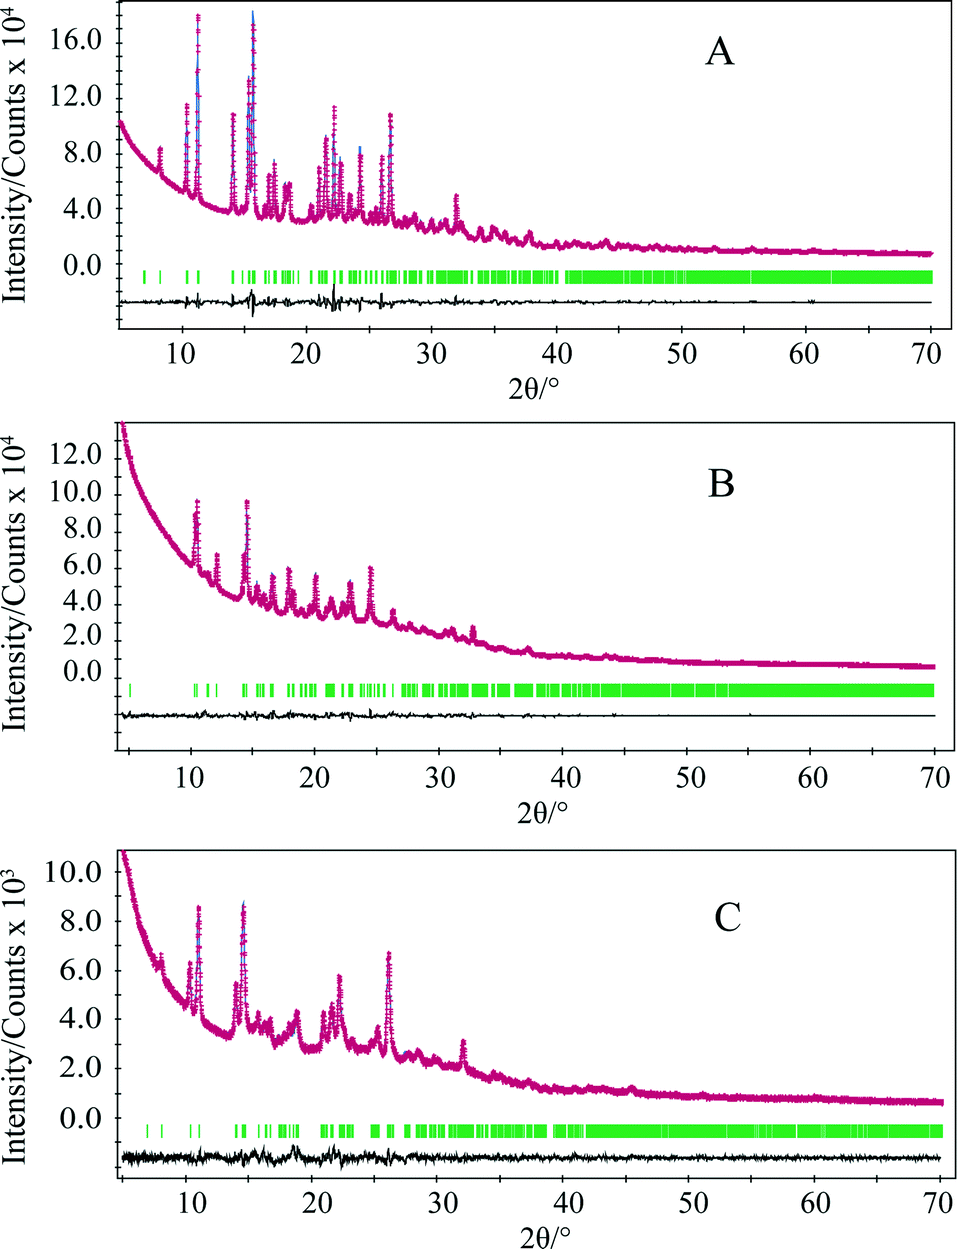 | ||
| Fig. 2 Final Rietveld fit for quifenadine hydrochloride forms A, B and C: red crosses – measured data points; blue line – calculated profile; black line – difference curve; green tick marks – calculated peak positions. | ||
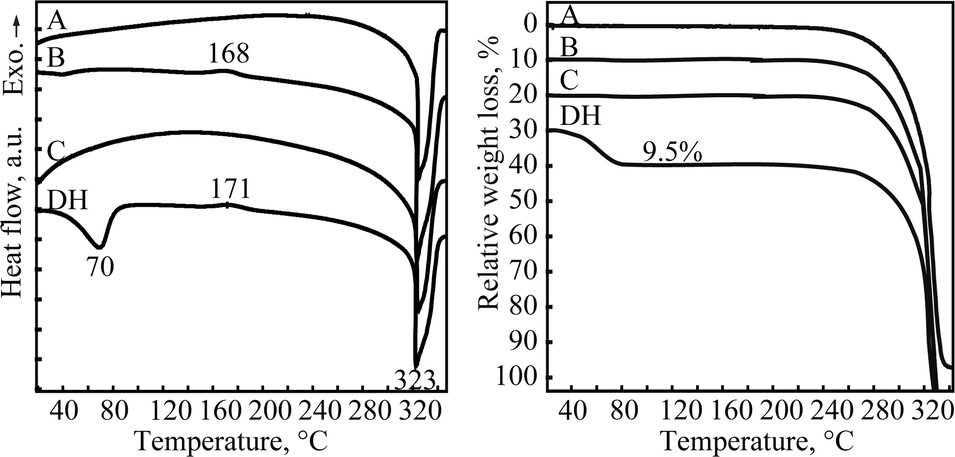 | ||
| Fig. 3 Stacked plots of the DTA and TG curves of quifenadine hydrochloride forms A, B, C and DH. | ||
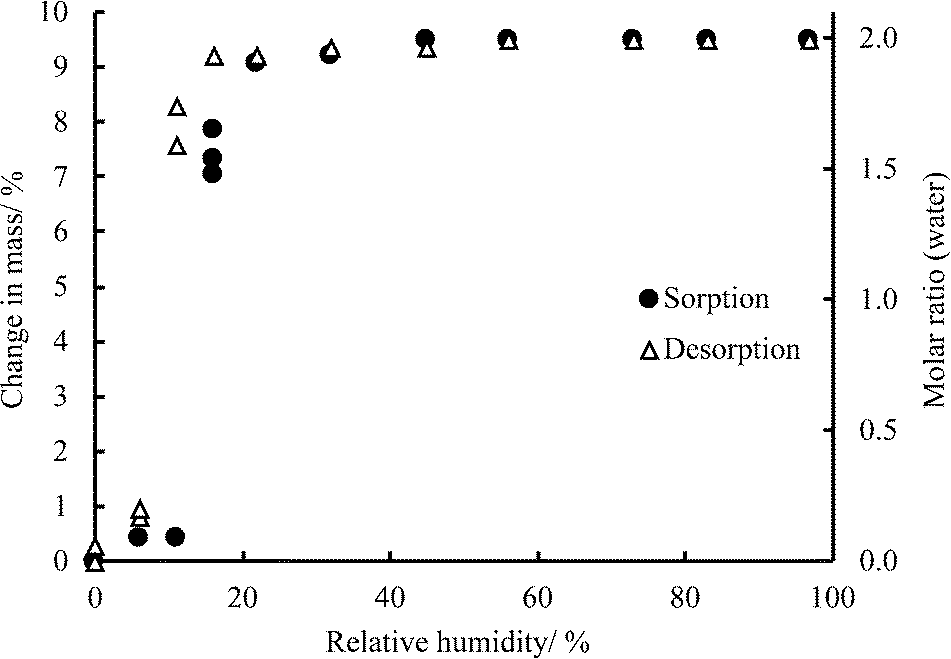 | ||
| Fig. 4 Moisture sorption and desorption isotherms of quifenadine hydrochloride forms B/DH at 30 °C. | ||
 | ||
| Fig. 5 PXRD patterns of quifenadine hydrochloride forms A, B, C and DH. | ||
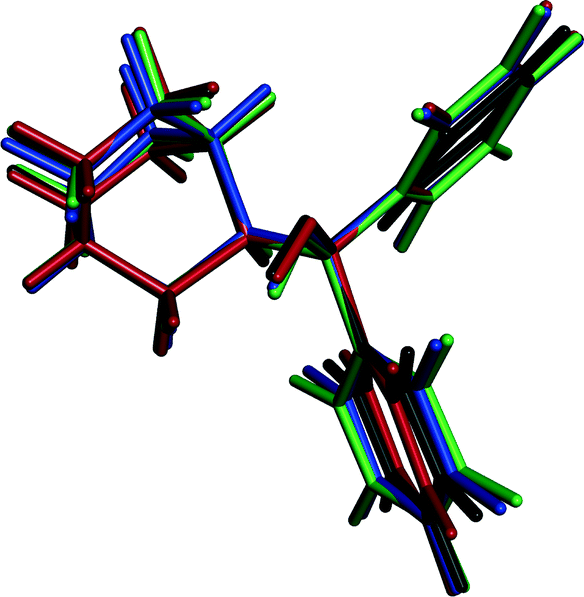 | ||
| Fig. 6 Overlay of the quifenadine cations extracted from the crystal structures of A (black), B (blue), C (red) and DH (green) with superimposed quifenadine moieties. | ||
In quifenadine hydrochloride, the only easily acessible strong hydrogen bond acceptor is the Cl− anion, and the possible donors allowing the formation of strong hydrogen bonds are the NH+ group and the hydroxyl group. As shown in Fig. 7, all three polymorphs have the same hydrogen bonding pattern where two chloride anions interact with two quifenadine cations through N14–H⋯Cl24 and O5–H⋯Cl24 bonds and form a tetramer with the graph set R24(16). Slight differences were observed in the hydrogen bond geometry and interaction energy between hydrogen bond donor and acceptor moieties in each of these three forms (see Table 3). Form A has the most negative interaction energy between cation and anion moieties, but interaction energy in forms B and C is almost equal. The hydrogen bonding pattern in the quifenadine hydrochloride dihydrate structure is more complex due to the presence of two water molecules increasing the number of possible hydrogen bond acceptor and donor sites. In this structure, hydrogen bonds are formed between NH+ group and water molecules. The Cl− is involved in H-bonding with the three water molecules and also with the –OH group attached to Cl. H-bonds between water molecules are also observed. Two quifenadine cations, two chloride anions and two water molecules form a hexamer with the graph set R46(20) through N14–H⋯O25, O5–H⋯Cl24 and O25–H⋯Cl24 bonds (see Fig. 7). Two other water molecules form a hydrogen bonded ring with chloride anions with the graph set R24(8). All of the water molecules are also involved in the formation of a hydrogen bonded chain including a chloride anion (C23(6)) perpendicular to the H-bonded hexamer R24(8) ring. Therefore the dehydration induces breakage of the hydrogen bond network and six hydrogen bonds are replaced with two new ones. Obviously, the water molecules play a stabilizing role in the quifenadine hydrochloride dihydrate structure by forming an efficient hydrogen bonding network, which explains its stability.
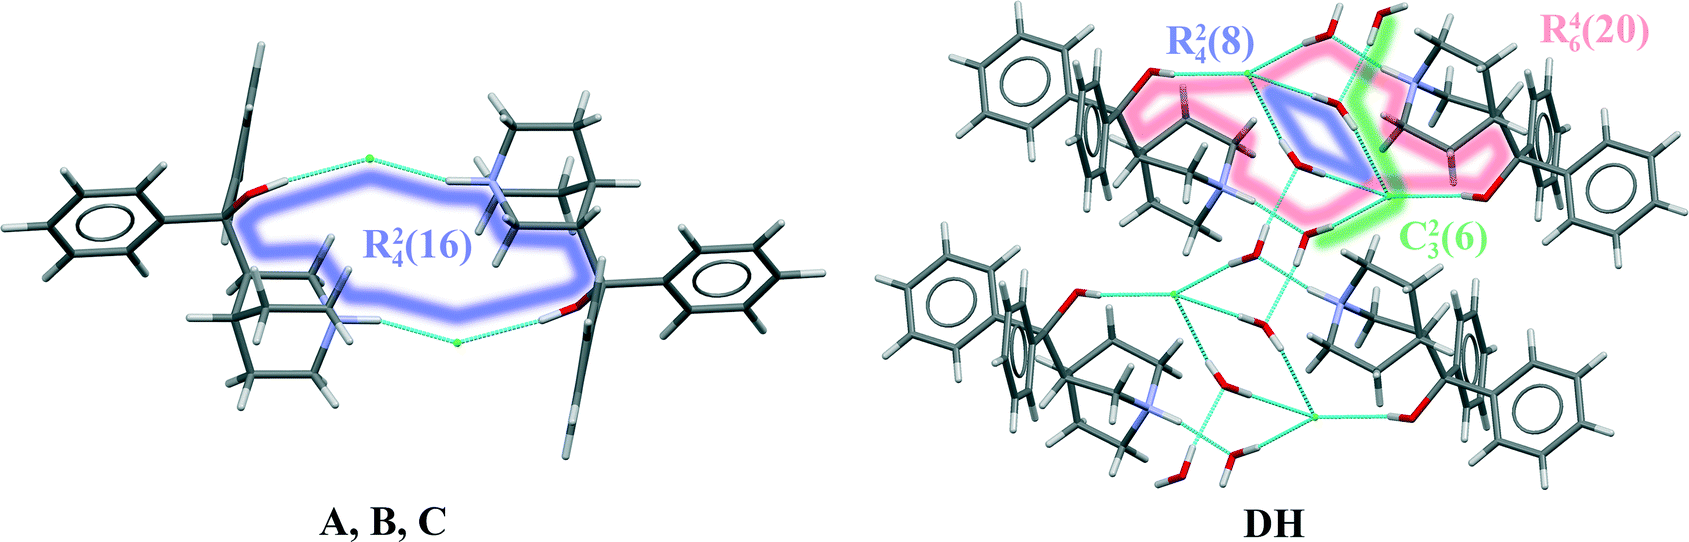 | ||
| Fig. 7 The hydrogen bonding patterns in quifenadine hydrochloride forms A, B, C and DH. | ||
| Interaction | D⋯A, Å | D–H⋯A, ° | Interaction energy, kJ mol−1 |
|---|---|---|---|
| a It was not possible to perform interaction energy calculation using PIXEL code because of four chemical entities in the asymmetric unit. | |||
| Form A | |||
| O5–H⋯Cl24 | 3.096(4) | 156 | −423.5 |
| N14–H⋯Cl24 | 3.010(4) | 153 | −446.6 |
| Form B | |||
| O5–H⋯Cl24 | 3.152(5) | 159 | −413.9 |
| N14–H⋯Cl24 | 3.042(5) | 150 | −442.2 |
| Form C | |||
| O5–H⋯Cl24 | 3.177(7) | 151 | −411.5 |
| N14–H⋯Cl24 | 3.034(7) | 151 | −444.6 |
| Form DH | |||
| O5–H⋯Cl24 | 3.197(2) | 165 | —a |
| N14–H⋯O26 | 2.727(2) | 166 | — |
| O25–H48⋯Cl24 | 3.171(2) | 172 | — |
| O25–H49⋯Cl24 | 3.177(2) | 179 | — |
| O25–H⋯O26 | 2.732(2) | 165 | — |
| O26–H⋯Cl24 | 3.179(2) | 171 | — |
As shown in Fig. 8, forms A and C have the same monolayered molecular packing pattern where all neighboring molecules are in antiparallel orientation. The 2D pattern is defined by the same type of layers. However, there are marked differences between the packing of forms A and C and form B. The molecular packing of form B has a bilayered pattern where neighboring molecules are in the same direction and molecules in each layer are in opposite orientation to those in an adjacent layer. The molecular packing of form B has more distinguishable hydrophobic and hydrophilic layers than in forms A and C where tetramers are packed more efficiently.
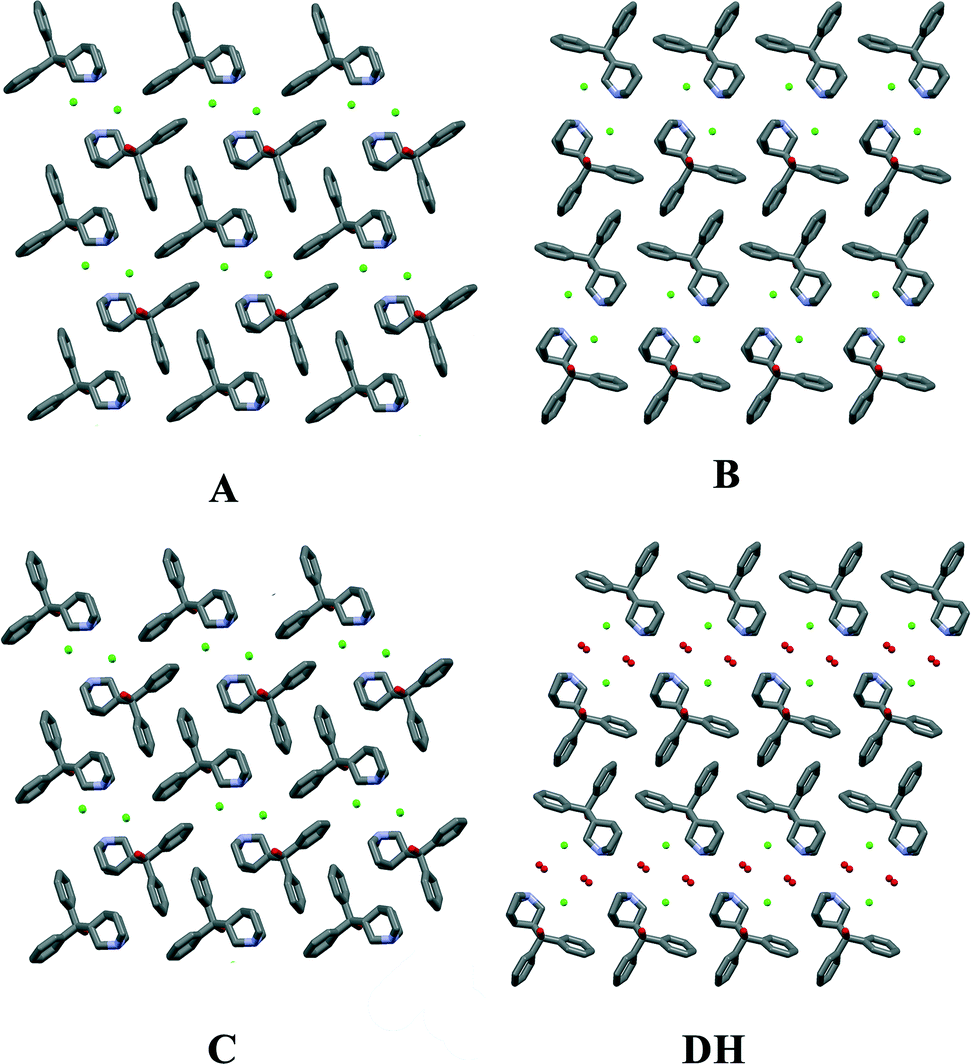 | ||
| Fig. 8 The molecular packing in quifenadine hydrochloride forms A, B, C and DH (hydrogen atoms have been omitted for clarity). | ||
The molecular packing of form DH shares common features with that of form B. The 2D structural pattern of DH is defined by the same molecular orientation and the same arrangement of the layers with respect to each other. The only difference is the inclusion of water molecules, which are located in structural channels between hydrophilic quinuclidine groups and chloride anions. Therefore DH is a channel hydrate. Besides, water molecules are involved in the main hydrogen bonding network, which makes this hydrate stoichiometric. Due to the high structural packing similarity, it is clear why the dehydration of DH leads to form B instead of A or C. This transition does not change the parallel orientation of quifenadine cations in the crystal structure, and it only decreases the distance between the quifenadine moieties. Transformation of DH to A or C requires a significant amount of molecular reorganization, and therefore, this transition is unfavourable, as is the reverse process, explaining the observations in moisture sorption experiments.
To compare the packing efficiency and therefore the stability in all four forms, calculation of the packing index for these forms has been performed with the PLATON27 software. PLATON calculations yielded 73.1, 71.7, 69.1 and 68.4% packing indices for forms A, C, B and DH, respectively, which are in agreement with thermodynamic stability results for these polymorphic forms. The lowest packing index of form DH, however, suggests that the presence of water molecule channels does not lead to very efficient packing, but the stability of this crystal structure is provided by an energetically efficient hydrogen bonding network provided by the insertion of water molecules.
In order to better explore the differences between very similar forms A and C, full geometry optimization of these two crystal structures was performed using the DFT-D method within Quantum Espresso.28 The obtained results indicated that between forms A and C there is only a small energy barrier because after geometry optimization of both experimental structures an almost identical structure was obtained. Therefore the only explanation why form C was obtained from n-butanol or iso-butanol instead of very similar form A can be based on the presence and strength of some specific interactions between the solvent molecules and the quifenadine and chloride moieties during the crystallization, resulting in slightly different molecular packing, which interestingly was not able to regroup to very similar but thermodynamically more stable structure A.
Dehydration kinetics
The dehydration kinetic model and activation energy (Ea) were determined in isothermal and non-isothermal modes to better understand the dehydration mechanism of DH. It is recommended to analyze the solid-state kinetics over selected fraction dehydrated (α) values because errors are usually higher at very low and high fraction dehydrated values;29 therefore, determination of activation energy and model fitting were performed for the data 0.2 ≤ α ≤ 0.8. The isothermal and nonisothermal dehydration kinetics of DH were first analyzed by Friedman's isoconversional method. Fig. 9 gives calculated Ea values as a function of fraction dehydrated α for dehydration of DH in isothermal (left) and non-isothermal (right) modes. The activation energy was determined to be 59 ± 4 kJ mol-1 and 62 ± 5 kJ mol−1 in isothermal and non-isothermal modes, respectively. The matching values of Ea calculated for both isothermal and nonisothermal modes suggest that the dehydration mechanism in both modes is the same. To identify an acceptable kinetic model, linear regression correlation coefficient (R2) for the plot of g(α) versus t was calculated for the most common solid state kinetic models. Equally high correlation coefficients were found for both one-dimensional phase boundary reaction model R1 (R2 = 0.9995) and two-dimensional phase boundary reaction model R2 (R2 = 0.9994). Then the reconstruction of the dehydration curves was performed to identify the most appropriate reaction model between R1 and R2. Fig. 10 gives the experimental and theoretical dehydration isotherms (fraction dehydrated versus time) obtained from TGA in isothermal mode at different temperatures. As shown in Fig. 10, model R1 provides a good description of the isothermal dehydration kinetics over the 0.2 ≤ α ≤ 0.8 range of the fraction dehydrated. Besides, R1 is a rational dehydration model for channel type hydrate with structurally close dehydration product, as the dehydration process most likely occurs by the movement of the phase boundary in the direction of the water channels. At α > 0.8, experimental isothermal α–time plots deviated from the linear relationship (and therefore from kinetic model R1) because the dehydration process became slower. Although similar deviation is characteristic of kinetic model R2, in this case R2 provides the worse fit to the experimental data (see Fig. 10). Therefore the observed deviation indicated that at the end of the dehydration the mechanism was changing, which probably could be caused by the presence of particles with different sizes, as large particles dehydrate slower than smaller particles.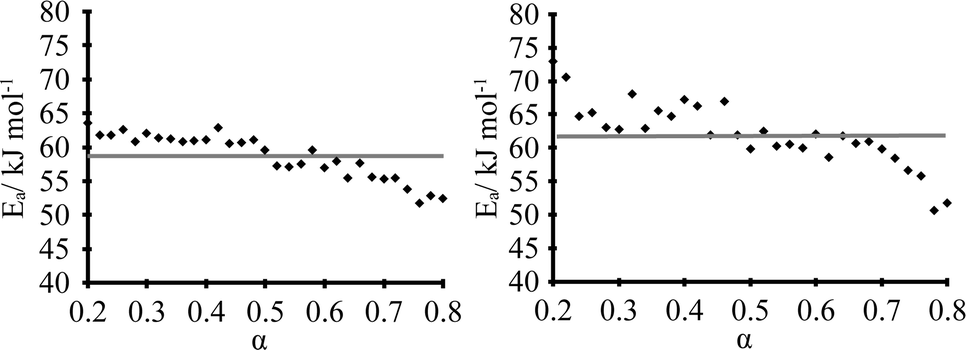 | ||
| Fig. 9 Dehydration Ea values as a function of fraction dehydrated α in isothermal (left) and non-isothermal (right) modes. | ||
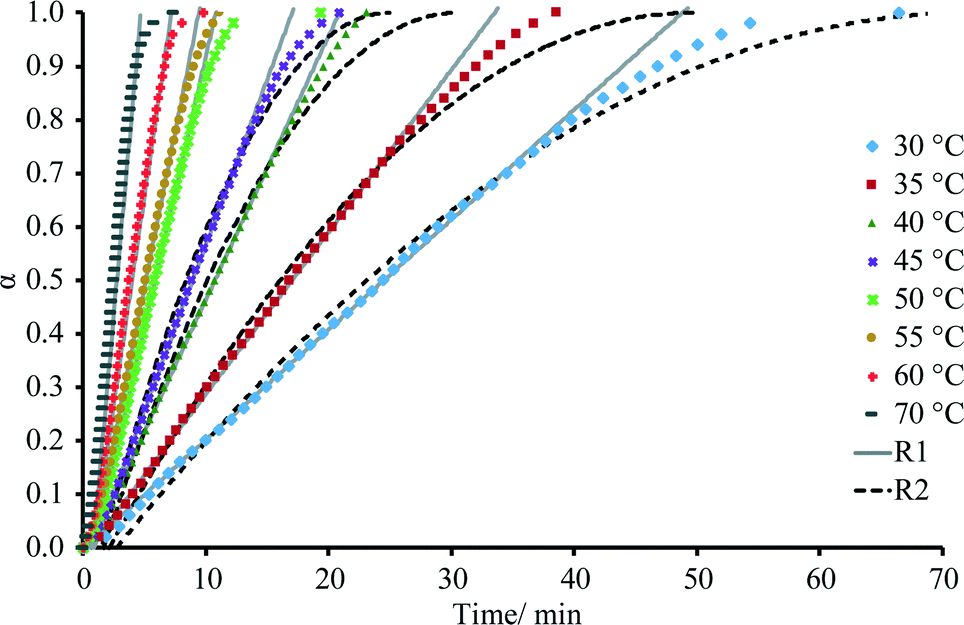 | ||
| Fig. 10 Experimental and theoretical representation of the dependence of fraction dehydrated (α) on time obtained from TGA at different temperatures in isothermal mode. | ||
Hot stage microscopy
The direct microscopic observations can provide useful information to identify and substantiate the best fitting kinetic model obtained from mathematical analysis of the kinetic data. As many solid-state kinetic models are based on geometric model functions, adequacy of these models can be verified by visual observation of the dehydration reaction.30,31Photomicrographs taken during the dehydration of DH using hot stage microscopy are shown in Fig. 11, and crystal morphology determined by single crystal face indexing is shown in Fig. 12. From Fig. 12, it can be seen that there are channels containing water molecules along the a-axis in the DH structure, and during the dehydration, water escapes through these channels. This result fits with the observations from hot stage microscopy in Fig. 11, where the dehydration process initiates from both ends of the crystal, and by increasing the temperature, the reaction boundary slowly moves inwards to the center of the crystal. Therefore the microscopic observations confirm the R1 reaction model, where the dehydration process is in one dimension, and water molecules escape through the water channels along the a-axis.
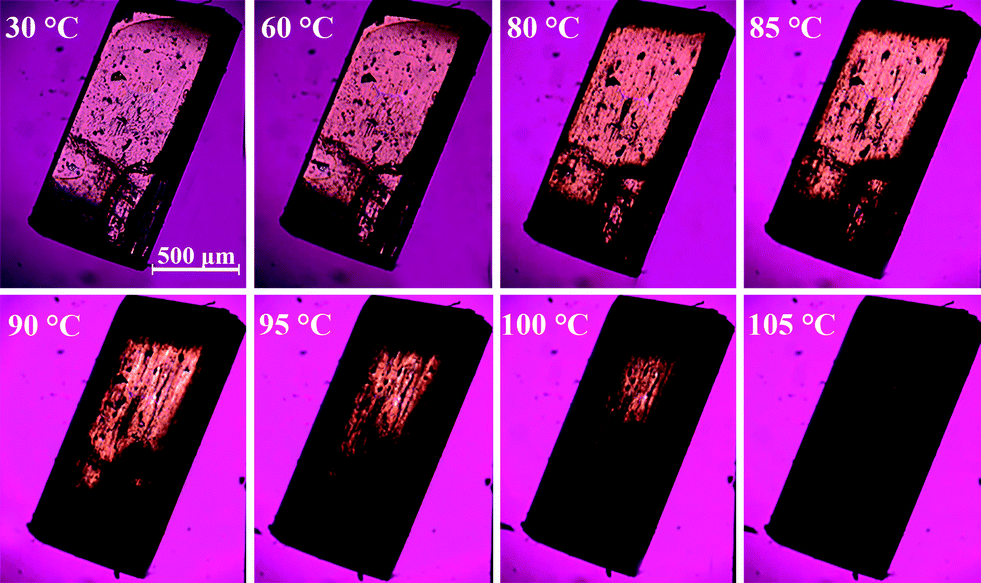 | ||
| Fig. 11 Photomicrographs of the dehydration process of DH form. | ||
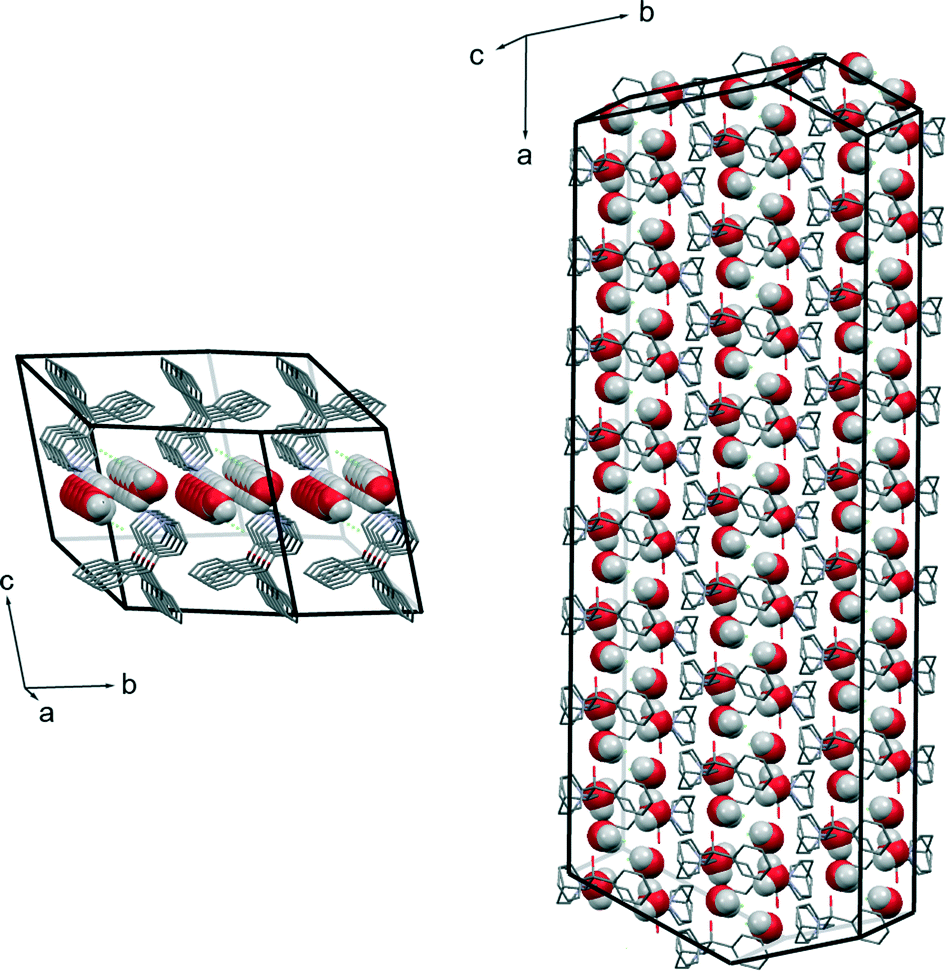 | ||
| Fig. 12 Determined crystal morphology of DH crystal showing water channels along the a-axis. | ||
Conclusions
Crystallization of quifenadine hydrochloride from 16 different solvents produced two anhydrous forms (A and C) and a dihydrate (DH), while the dehydration of DH produced another new polymorph (B). The same hydrogen bonding pattern (hydrogen bonded tetramer consisting of two quifenadine cations and two chloride anions) was observed in the crystal structures of all three polymorphs. Thermodynamic stability of the polymorphs was established by SMSB experiments and calculation of the crystal lattice energy. These results demonstrated that form A is the most thermodynamically stable form, followed by form C and then form B; besides, all three polymorphs have a monotropic relationship to each other.In DH, hydrogen bonds form a complex network, with water molecules playing a stabilizing role. Water molecules are located in structure channels and dehydration produces structurally similar polymorph B. Therefore the solid-state hydration/dehydration transformation DH ↔ B is reversible under ambient conditions and depends on the relative humidity.
The dehydration of form DH was studied using various experimental methods. It was determined that the dehydration proceeds by the one-dimensional phase boundary reaction model (R1) in which the water molecules escape through the structure channels along the a-axis.
Acknowledgements
We wish to thank Riga Technical University Institute of Polymer Materials for the opportunity to carry out hot-stage microscopy measurements, Inese Sarceviča for the help with single-crystal structure determination and Formulation and Drug Delivery Research Group, School of Pharmacy and Biomolecular Sciences, Liverpool John Moores University for the opportunity to carry out calculations with Materials Studio.Notes and references
- S. Ito, M. Nishimura, Y. Kobayashi and S. Itai, Int. J. Pharm., 1997, 151, 133–142 CrossRef CAS.
- H. G. Brittain, J. Pharm. Sci., 2012, 101, 464–484 CrossRef CAS PubMed.
- R. Hilfiker, ed. W. Beckmann, Crystallization: Basic Concepts and Industrial Applications, Wiley-VCH Verlag GmbH & Co. KGaA, Weinheim, Germany, 2013 Search PubMed.
- J. Bernstein, Cryst. Growth Des., 2011, 11, 632–650 CAS.
- G. P. Stahly, Cryst. Growth Des., 2007, 7, 1007–1026 CAS.
- W. I. F. David, K. Shankland, J. Van De Streek, E. Pidcock, W. D. S. Motherwell and J. C. Cole, J. Appl. Crystallogr., 2006, 39, 910–915 CrossRef CAS.
- W. I. F. David and K. Shankland, Acta Crystallogr., Sect. A: Found. Crystallogr., 2008, 64, 52–64 CrossRef CAS PubMed.
- United States Patent, 1978, US4117139A Search PubMed.
- L. Makarov, L. Balykova, O. Soldatova, V. Komolyatova and V. Serebruany, Am. J. Ther., 2012, 17, 396–401 Search PubMed.
- O. V. Dolomanov, L. J. Bourhis, R. J. Gildea, J. a. K. Howard and H. Puschmann, J. Appl. Crystallogr., 2009, 42, 339–341 CrossRef CAS.
- G. M. Sheldrick, Acta Crystallogr., Sect. A: Found. Crystallogr., 2008, 64, 112–122 CrossRef CAS PubMed.
- C. F. Macrae, I. J. Bruno, J. A. Chisholm, P. R. Edgington, P. McCabe, E. Pidcock, L. Rodriguez-Monge, R. Taylor, J. van de Streek and P. A. Wood, J. Appl. Crystallogr., 2008, 41, 466–470 CrossRef CAS.
- BV Nonius, Nonius KappaCCD Collect, 1998 Search PubMed.
- A. Boultif and D. Louër, J. Appl. Crystallogr., 1991, 24, 987–993 CrossRef CAS.
- A. Boultif and D. Louër, J. Appl. Crystallogr., 2004, 37, 724–731 CrossRef CAS.
- M. A. Neumann, J. Appl. Crystallogr., 2003, 36, 356–365 CAS.
- G. S. Pawley, J. Appl. Crystallogr., 1981, 14, 357–361 CrossRef CAS.
- B. Delley, J. Chem. Phys., 1990, 92, 508–517 CrossRef CAS PubMed.
- J. Perdew, K. Burke and M. Ernzerhof, Phys. Rev. Lett., 1996, 77, 3865–3868 CrossRef CAS.
- S. Grimme, J. Comput. Chem., 2006, 27, 1787–1799 CrossRef CAS PubMed.
- A. March, Z. Kristallogr., 1932, 81, 285–297 Search PubMed.
- W. a. Dollase, J. Appl. Crystallogr., 1986, 19, 267–272 CrossRef CAS.
- A. Gavezzotti, New J. Chem., 2011, 35, 1360–1368 RSC.
- M. J. Frisch, G. W. Trucks, H. B. Schlegel, G. E. Scuseria, M. A. Robb, J. R. Cheeseman, G. Scalmani, V. Barone, B. Mennucci, G. A. Petersson, H. Nakatsuji, M. Caricato, X. Li, H. P. Hratchian, A. F. Izmaylov, J. Bloino, G. Zheng, J. L. Sonnenberg, M. Hada, M. Ehara, K. Toyota, R. Fukuda, J. Hasegawa, M. Ishida, T. Nakajima, Y. Honda, O. Kitao, H. Nakai, T. Vreven, J. A. J. Montgomery, J. E. Peralta, F. Ogliaro, M. Bearpark, J. J. Heyd, E. Brothers, K. N. Kudin, V. N. Staroverov, R. Kobayashi, J. Normand, K. Raghavachari, A. Rendell, J. C. Burant, S. S. Iyengar, J. Tomasi, M. Cossi, N. Rega, J. M. Millam, M. Klene, J. E. Knox, J. B. Cross, V. Bakken, C. Adamo, J. Jaramillo, R. Gomperts, R. E. Stratmann, O. Yazyev, A. J. Austin, R. Cammi, C. Pomelli, J. W. Ochterski, R. L. Martin, K. Morokuma, V. G. Zakrzewski, G. A. Voth, P. Salvador, J. J. Dannenberg, S. Dapprich, A. D. Daniels, O. Farkas, J. B. Foresman, J. V. Ortiz, J. Cioslowski, D. J. Fox, J. Montgomery, J. A. J. E. Peralta, F. Ogliaro, M. Bearpark, J. J. Heyd, E. Brothers, K. N. Kudin, V. N. Staroverov, R. Kobayashi, J. Normand, K. Raghavachari, A. Rendell, J. C. Burant, S. S. Iyengar, J. Tomasi, M. Cossi, N. Rega, N. J. Millam, M. Klene, J. E. Knox, J. B. Cross, V. Bakken, C. Adamo, J. Jaramillo, R. Gomperts, R. E. Stratmann, O. Yazyev, A. J. Austin, R. Cammi, C. Pomelli, J. W. Ochterski, R. L. Martin, K. Morokuma, V. G. Zakrzewski, G. A. Voth, P. Salvador, J. J. Dannenberg, S. Dapprich, A. D. Daniels, Ö. Farkas, J. B. Foresman, J. V. Ortiz, J. Cioslowski and D. J. Fox, 2009.
- L. Greenspan, J. Res. Natl. Bur. Stand., Sect. A, 1977, 81A, 89–96 CrossRef.
- A. Burger and R. Ramberger, Microchim. Acta, 1979, 72(3–4), 273–316 CrossRef.
- A. L. Spek, Acta Crystallogr., Sect. D: Biol. Crystallogr., 2009, 65, 148–155 CrossRef CAS PubMed.
- P. Giannozzi, S. Baroni, N. Bonini, M. Calandra, R. Car, C. Cavazzoni, D. Ceresoli, G. L. Chiarotti, M. Cococcioni, I. Dabo, A. Dal Corso, S. de Gironcoli, S. Fabris, G. Fratesi, R. Gebauer, U. Gerstmann, C. Gougoussis, A. Kokalj, M. Lazzeri, L. Martin-Samos, N. Marzari, F. Mauri, R. Mazzarello, S. Paolini, A. Pasquarello, L. Paulatto, C. Sbraccia, S. Scandolo, G. Sclauzero, A. P. Seitsonen, A. Smogunov, P. Umari and R. M. Wentzcovitch, J. Phys.: Condens. Matter, 2009, 21, 395502 CrossRef PubMed.
- A. Khawam and D. R. Flanagan, Thermochim. Acta, 2005, 429, 93–102 CrossRef CAS PubMed.
- V. Koradia, H. L. D. E. Diego, M. R. Elema and J. Rantanen, J. Pharm. Sci., 2010, 99, 3966–3976 CAS.
- A. K. Galwey, Thermochim. Acta, 2000, 355, 181–238 CrossRef CAS.
Footnote |
| † CCDC 1051731, 1051732, 1051733, and 1051734 contain the supplementary crystallographic data for the structures of DH, A, B, and C, respectively. For crystallographic data in CIF or other electronic format see DOI: 10.1039/c5ce00426h |
| This journal is © The Royal Society of Chemistry 2015 |