 Open Access Article
Creative Commons Attribution 3.0 Unported Licence
Static and lattice vibrational energy differences between polymorphs†
Jonas
Nyman
and
Graeme M.
Day
 *
*
School of Chemistry, University of Southampton, Southampton, UK. E-mail: g.m.day@soton.ac.uk; Tel: +44 (0)2380599174
First published on 23rd March 2015
Abstract
A computational study of 1061 experimentally determined crystal structures of 508 polymorphic organic molecules has been performed with state-of-the-art lattice energy minimisation methods, using a hybrid method that combines density functional theory intramolecular energies with an anisotropic atom–atom intermolecular model. Rigid molecule lattice dynamical calculations have also been performed to estimate the vibrational contributions to lattice free energies. Distributions of the differences in lattice energy, free energy, zero point energy, entropy and heat capacity between polymorphs are presented. Polymorphic lattice energy differences are typically very small: over half of polymorph pairs are separated by less than 2 kJ mol−1 and lattice energy differences exceed 7.2 kJ mol−1 in only 5% of cases. Unsurprisingly, vibrational contributions to polymorph free energy differences at ambient conditions are dominated by entropy differences. The distribution of vibrational energy differences is narrower than lattice energy differences, rarely exceeding 2 kJ mol−1. However, these relatively small vibrational free energy contributions are large enough to cause a re-ranking of polymorph stability below, or at, room temperature in 9% of the polymorph pairs.
1 Introduction
Polymorphism, the possibility of a compound to exist in at least two different crystalline phases,1 has important implications for the development of pharmaceuticals, organic semiconductors,2 explosives and any other material where solid state properties must be controlled.3 Unexpected polymorphism can have far-reaching economic and medical,4,5 as well as legal6 consequences. For these reasons, there is a strong motivation to develop our fundamental understanding of polymorphism, of property differences between polymorphs and, ultimately, the ability to predict possible polymorphs a priori.The relative free energy determines which polymorph should be favourable under given thermodynamic conditions. However, crystallisation does not always lead to the most stable structure, with kinetic factors sometimes leading to an alternative crystal packing. How large a lattice energy penalty can be overcome by such kinetic factors? It is important to understand the energy differences that can exist between observable polymorphs. This question is particularly relevant in computational attempts to predict possible polymorphs of a given molecule. The most commonly adopted approach to predicting crystal structures involves a search for the lowest energy crystal packing possibilities, followed by an assessment of which low energy computer-generated structures might be observed.7,8 Such methods usually lead to many possible structures and it is necessary to focus one's attention on those potential polymorphs that lie in a limited energy range from the lowest energy possibility.
Polymorph energy differences are often said to be less than 10 kJ mol−1.3 A rule of thumb can be based on experimental determinations of polymorph relative energies, for example from sublimation enthalpies,9 melting data,10 differential scanning calorimetry,11 relative solubilities12 or solution microcalorimetry.13 However, experimental collection of a large quantity of high quality polymorph energy differences is challenging. An alternative approach to understanding polymorph energy differences is through computational modelling.
In computational studies of molecular crystals, the free energy is commonly approximated with the static lattice energy, calculated either with force field or electronic structure methods, such as dispersion-corrected periodic DFT14,15 or fragment-based approaches.16 While high quality lattice energies can be achieved, this ignores the energetic contributions related to the vibration of molecules about their equilibrium positions. Omitting the vibrational contribution to the free energy is convenient, since it simplifies the calculation, and tempting from the computational cost point of view. This is sometimes justified by a claim that the difference in vibrational energy between polymorphs is so small that it never causes a re-ranking of the relative stability. This was one of the conclusions of Gavezzotti and Filippini's landmark 1995 study of polymorph energy differences.17 The conclusion stands in sharp contradiction to the many experimentally known temperature-dependent polymorphic transitions and other computational studies that have demonstrated the importance of vibrational zero-point energy and entropy differences between crystal structures.18 There is a need to readdress the issue using up-to-date computational methods.
In this study, we present lattice energy and lattice dynamical studies of thermodynamic properties of a set of 1061 experimentally determined crystal structures of 508 polymorphic organic molecules, using state-of-the-art methods for lattice energy evaluation. This is the largest study to date of energetic differences between polymorphs.
2 Methods
2.1 Selection of polymorph pairs
Crystal structures were obtained from the Cambridge Structural Database (CSD), version 5.35 (Nov. 2013). Reference code families of polymorphs in van de Streek's “best hydrogens list”19,20 containing only H/D, C, N, O, F, S, and Cl were selected, the elements for which the most reliable atom–atom potentials exist. Multicomponent structures and radicals were removed.As our lattice dynamical treatment currently only includes rigid molecule motions, we assume that differences in intramolecular vibrations between polymorphs are negligible. This approximation may lead to errors when there are significant molecular geometry differences between polymorphs, such as in conformational polymorphism. Therefore, we used the root-mean-square deviation (RMSD) of atomic coordinates for molecules in different polymorphs (calculated using TORMAT,21 excluding hydrogen atom positions) to exclude structures with large intramolecular differences. Cruz-Cabeza and Bernstein22 showed that polymorphs tend to have very similar molecular conformations, and that an RMSD of atomic coordinates of up to 0.225–0.3 Å usually corresponds to slight adjustments of the same molecular conformer. We observe essentially the same distribution as Cruz-Cabeza and Bernstein22 (see Fig. S12 in ESI†) and set our limit to 0.25 Å, to exclude structure pairs where molecular geometry differences exceeded this value.
The symmetries of structures with non-integer Z′ were modified to include whole molecules in the asymmetric unit. Structures with more than 65 atoms in the asymmetric unit were excluded to limit the computational cost of the flexible molecule energy minimisation. Missing hydrogen atoms were added based on conventional geometric criteria whenever this could be done unambiguously and deuterium atoms were substituted by hydrogen in deuterated structures. Structures with disorder or incorrectly placed hydrogen atoms were excluded. A small number of structures had to be excluded because of limitations in the energy-minimisation method applied here, as described below.
Lattice dynamics calculations require that the Hessian is positive definite, i.e. that the crystal structure is a true potential energy minimum. For a few structures, this was not the case and the crystal is thus unstable with respect to symmetry breaking. For these structures, we removed all crystallographic symmetry and performed the lattice dynamics calculations on the P1 unit cell. If the structure was still unstable, it was discarded.
The final structure set (see list in ESI†) consisted of 1061 crystal structures in 508 polymorphic clusters forming 466 polymorph pairs, 39 triplets and 3 quadruplets, yielding 601 pairwise comparisons of polymorph energies. The structures were analysed for the presence of hydrogen bonds with the program PLATON.23 654 crystal structures in 310 clusters are found to contain hydrogen bonds and 507 structures in 198 clusters do not form hydrogen bonds. Structures are referred to by their CSD reference codes throughout. Our set of structures is three times larger than that used in the largest previous study17 of polymorph energetics that we are aware of.
2.2 Lattice energy minimisation
Lattice energies were calculated from a hybrid model, combining a DFT model for the intramolecular energy with an atom–atom model of intermolecular interactions:| Elatt = EDFTintra + Eatom−atominter. | (1) |
Intramolecular energies and molecular geometries were calculated at the B3LYP/6-311G(d,p) level of theory.
The intermolecular interaction energy between molecules M and N was modelled with an anisotropic model potential of the form:
 | (2) |
A recently revised28,29 version of the Williams99 exp-6 potential30 was used. The re-parametrisation was performed to optimise the performance of the potential for use with atomic multipole electrostatics. Parameters for sulfur were taken from Abraha and Williams,31 using conventional combining rules for S⋯X interactions. All halogen atoms were treated as having an anisotropic repulsion, as described previously.25,32 The revised Williams99 parameters, and those for F and Cl are provided in the supplementary information. The Williams99 potential requires a foreshortening of all X–H bonds by 0.1 Å.
All crystal structures were lattice energy-minimised through the CRYSTALOPTIMIZER program,33,34 which minimises the sum of the intra- and intermolecular energies with respect to selected intramolecular degrees of freedom, as well as crystal packing degrees of freedom (molecular orientation, rotation and unit cell parameters). CRYSTALOPTIMIZER performs flexible-molecule crystal structure optimisation by iteratively computing the molecular geometry and energy at the DFT level of theory with GAUSSIAN 09 (ref. 35) under the constraints of the crystal packing forces calculated from the intermolecular potential, using the crystal structure modelling program DMACRYS25 for intermolecular energy calculations.
This lattice energy minimisation method includes the strain on the molecules resulting from the crystal packing forces on a set of intramolecular degrees of freedom, usually chosen as flexible torsions and bond angles. These degrees of freedom are optimised in response to intermolecular interactions. The computational cost increases with the number of flexible degrees of freedom. To process the large number of crystal structures, we implemented an algorithm in Python to automatically select the flexible degrees of freedom that we considered most important for accurately modelling the impact of crystal packing on molecular geometry:
• All covalent bond lengths are optimised without considering packing forces.;
• To accurately model hydrogen bond geometries, bond angles and dihedrals containing a polar hydrogen atom (−OH, −NH, −SH) are considered flexible and optimised under the influence of packing forces.;
• All exocyclic bonds are considered rotatable. Dihedral angles around these bonds are optimised under the influence of crystal packing forces.;
• All dihedrals and angles in rings of 3-coordinated carbon atoms (e.g. phenyl rings) are treated as unaffected by packing forces.;
• All dihedrals and angles, except those with polar H, in five- or six-membered heterorings of nitrogen and 3-coordinated carbons are optimised without considering packing forces.;
• Any remaining dihedrals (e.g. in heterorings with S or O) are optimised subject to packing forces.
Since GAUSSIAN requires bond angles to be between 0° and 180° and to prevent angles containing an sp1-hybridized carbon (i.e. CC and CN triple bonds) from exceeding 180°, such angles were constrained to 179.99°. These rules are adequate for practically all molecules, but fail for GLYCIN, XELLEF and BEWYUY. Glycine (GLYCIN) crystallizes in zwitterionic form. During energy minimisation with our method, one proton moves from the amino group to the carboxyl group. BEWYUY and XELLEF contain triple bonds that are sensitive to packing forces, so our constraint on near-linear angles is inappropriate. In this study we have ignored the PV contribution to the (Gibbs) free energy, resulting in errors for high-pressure polymorphs with significant differences in density. Two polymorph pairs (FIGYID, ACRLAC) were identified where the PV-term is not negligible. These five polymorph families have therefore been excluded from the current study.
2.3 Free energy calculations
All vibrational contributions to crystal free energies are calculated from harmonic phonon frequencies calculated at the optimised crystal structure geometries. Lattice dynamics theory36,37 and its adaptation to the dynamics of rigid molecular crystals38–40 has been described in detail elsewhere. Rigid molecule lattice dynamics are implemented in the DMACRYS software for computating phonons using anisotropic atom–atom potentials.41,42Harmonic phonons can be considered as non-interacting quantum harmonic oscillators with angular frequencies ωi. The resulting partition function is
 | (3) |
The vibrational contribution to the free energy Fvib is then
| Fvib(T) = − kBT ln Zvib, | (4) |
 | (5) |
| A(T) = Elatt + Fvib(T), | (6) |
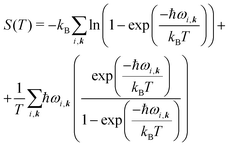 | (7) |
 | (8) |
The accuracy of calculated vibrational energy contributions depends on how well the calculations reproduce the true vibrational frequencies, and on the sampling of reciprocal space used in calculating the partition function (eqn (3)). Phonon calculations using the form of anisotropic atom–atom potentials employed here have previously been shown to reproduce observed frequencies from terahertz spectroscopy with good accuracy,43,44 so that errors due to inaccuracies of the model potential should be small. The lattice dynamics implementation in DMACRYS only provides phonons calculated at the Brillouin zone centre (k = 0). Non-zero k-vectors were sampled by generating supercells of the original unit cell; the vibrational modes of a (N, M, P) supercell include N × M × P distinct k-points of the original cell. To ensure that our calculated energies are converged with respect to sampling of k-points, it is important to sample as widely as possible between k = 0 and the edge of the first Brillouin zone. However, to obtain k-points close to 0 using the supercell method can require very large supercells and prohibitively long computational times. To keep computational costs manageable, we sampled k-points using combinations of “linear” supercells, each expanded along a single lattice vector. Phonon frequencies from a series of supercells are then combined. For cubic, tetragonal and orthorhombic unit cells, the linear supercell expansion leads to k-point sampling along the reciprocal unit cell axes a*, b*, c*. In lower symmetry crystal systems, the sampling is not necessarily along the reciprocal lattice vectors, but should adequately sample the dependence of phonon frequency on orientation in reciprocal space.
In testing the convergence of calculated thermodynamic properties with respect to k-point sampling, we set target k-point distances along each reciprocal space direction (length in reciprocal space per k-point). A particular target length defined a number of k-points in that direction and, thus, the length of the supercell. Elongated supercells were split into several smaller supercells that sample approximately the same number of unique k-points (see ESI† for a description), providing a nearly equivalent k-point sampling at a reduced computational cost. The individual supercells in each direction are chosen to have mutually co-prime supercell expansion coefficients, ensuring that each supercell samples a unique set of k-points (apart from k = 0, whose duplicates were removed prior to computing thermodynamic properties).
Ambient conditions are most relevant for understanding the energetic aspects of polymorphism, so all thermodynamic properties reported here are calculated at T = 300 K. So as not to exclude weakly bound crystal structures, we did not attempt to excude structures with melting points below 300 K.
3 Results and discussion
3.1 Free energy convergence with phonon sampling
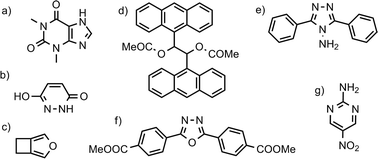
The convergence of Helmholtz energy, entropy, zero point energy and heat capacity with respect to k-point sampling was studied to decide on a sampling density that gives sufficiently small errors in calculated thermodynamic quantities, while maintaning the computational efficiency required to evaluate properties of all 1061 crystal structures. In his investigation of vibrational energy contributions in crystal structure prediction, van Eijck18 found that 50 randomly chosen k-points provided converged thermodynamic properties. However, the number of k-points necessary for convergence is not the same for different crystal structures, but depends on the size and contents of the unit cell. Therefore, instead of targetting a set number of k-points, we studied convergence with respect to the distance (in reciprocal space) between sampled k-points. We believe that this provides a uniform treatment of crystal structures.Convergence of thermodynamic properties was investigated for a set of four polymorph pairs of theophylline (CSD refcode family BAPLOT), two polymorph pairs of maleic hydrazide (MALEHY) and the pair of 3,4-cyclobutylfuran (XULDUD) polymorphs (Fig. 1), chosen to represent crystal structures with varying types and strengths of intermolecular interactions. The structures for theophylline polymorphs VI and VII were taken from Eddleston et al.45 and Eddleston et al.46 The crystal structures were geometry optimised, as described above, before the lattice dynamics calculation were performed for a series of k-point sampling densities.
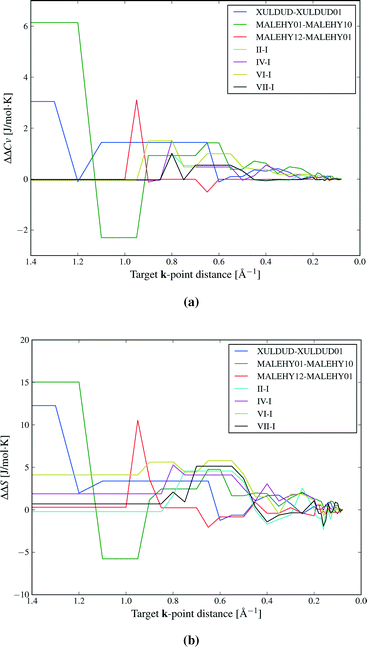
Fig. 2 shows the convergence of the difference in heat capacity and entropy for the 7 polymorph pairs. The error is measured relative to the best estimate of ΔS and ΔCv calculated at a very dense k-point sampling of 0.08 Å−1.
At the largest k-point distance, only k = 0 is sampled, clearly giving unacceptable results and errors in relative entropies exceeding 10 J mol−1 K−1 (corresponding to errors of 2–3 kJ mol−1 in ΔA). We find that it is necessary to sample several, but not very many, k-vectors to achieve sufficiently converged thermodynamic properties. Heat capacity differences converge relatively easily (Fig. 2a), while entropy differences converge more slowly (Fig. 2b).
Based on these, and additional convergence tests described elsewhere,47 we have chosen a target k-point distance of 0.12 Å−1 for the polymorph pair calculations, corresponding to 15 k-vectors on average per structure, though with a large variance. With this sampling, we estimate that the errors caused by the finite k-point sampling should usually be less than 1 J mol−1 K−1 in ΔS and 1 kJ mol−1 for the difference in total vibrational energy between polymorphs.
3.2 Overall energetic contributions
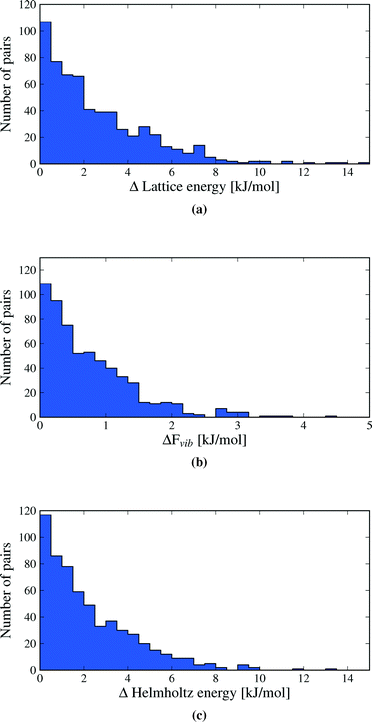
We first inspect the distribution of lattice energy differences between polymorphs (Fig. 3a). These are the total differences in the sum of intermolecular and intramolecular energies, calculated for the static, lattice energy minimised structures. Our results confirm the validity of the rule-of-thumb that polymorph lattice energy differences are less than 10 kJ mol−1 (ref. 3); only 1.5% of polymorph pairs included in this study exceed 10 kJ mol−1 in relative lattice energy. Indeed, most lattice energy differences are much smaller: over half (52.7%) of polymorph pairs are separated by less than 2 kJ mol−1 and 95% by less than 7.2 kJ mol−1. Measured in percent, the lattice energy difference is less than 8% in all but a few cases (see Fig. S1 in ESI†).Lattice energy differences are generally dominated by differences in intermolecular interactions, with 68.5% of polymorph pairs differing in intramolecular energy by less than 1 kJ mol−1 (see Fig. S12 in the ESI†). This is, in part, due to our selection of polymorphs with small intramolecular geometry differences. The range in intramolecular energies that we find is in broad agreement with our recent study of conformational energies in molecular crystals.48 In rare cases, intramolecular energy differences reach 15–20 kJ mol−1, where a high energy conformation is found in one polymorph. The largest intramolecular energy differences that we find are associated with changes in hydrogen atom positions that lead to a switch between inter- and intramolecular hydrogen bonding. This type of conformational polymorphism is a particularly difficult challenge for computational methods.49 In all cases of large intramolecular energy differences, the intramolecular penalty is compensated by improved intermolecular interactions in the polymorph containing the higher energy molecular conformation.
Differences in the total vibrational contribution to free energy at 300 K are generally smaller in magnitude (Fig. 3b). |ΔFvib| is calculated to be less than 1 kJ mol−1 in more than 70% of polymorph pairs and is greater than 2 kJ mol−1 in fewer than 6% of cases. Due to the small magnitude of ΔFvib between polymorphs, and recalling that ΔA = ΔElatt + ΔFvib, the overall distribution of free energy differences (Fig. 3c) closely resembles the distribution of lattice energy differences: 56.6% of pairs are separated by less than 2 kJ mol−1 in calculated free energy, 95% are below 6.4 kJ mol−1 and the free energy difference of only 0.5% of polymorph pairs exceeds 10 kJ mol−1.
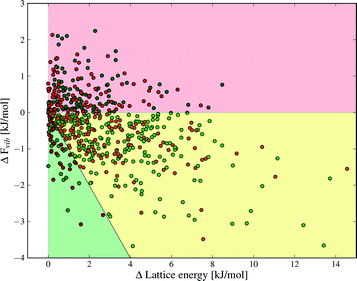
Despite the small contributions of Fvib to polymorph free energy differences, these results should not be interpreted as demonstrating the unimportance of lattice vibrational contributions to polymorph relative stabilities. Fig. 4 shows the lattice energy difference and ΔFvib data together for all polymorph pairs, and demonstrates that there is only a weak correlation between the two quantities.
As a consequence, there are cases where Fvib reinforces the static lattice energy difference (the shaded red region in Fig. 4), as well as cases where ΔFvib and ΔElatt have opposite sign (the yellow and green shaded regions in Fig. 4). The latter case, where ΔFvib counteracts ΔElatt, is more common: dynamical energy contributions (Fvib) reduce the energy difference between polymorphs in 69% of pairs included in this study. The free energy curves of these pairs will cross at some temperature, leading to an enantiotropic phase transition if the crossing temperature falls below their melting point. The shaded green area in Fig. 4 highlights those polymorph pairs where ΔFvib is greater than, and of opposite sign, to ΔElatt at 300 K, leading to a change in order of stability of the polymorph pair; this is the case for 9% of polymorph pairs.
3.3 Contributions to ΔFvib
The total vibrational contribution to the free energy difference between polymorphs is a sum of the zero point energy, thermal contribution to the internal energy and entropic contribution:| ΔFvib = ΔZPE + ∫T0ΔCv(T)dT − TΔS. | (9) |
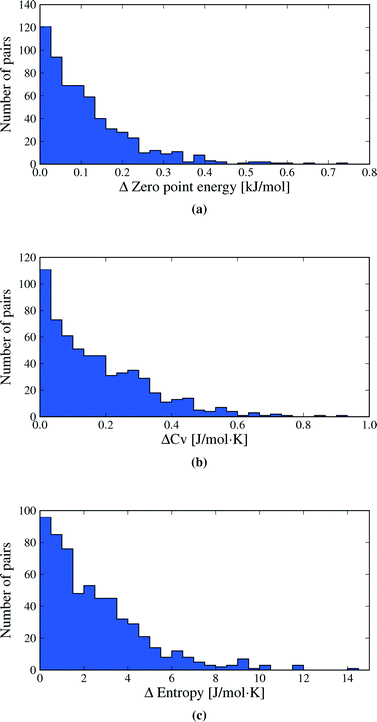
Vibrational zero point energy is a minor contribution to the relative stability of polymorphs (Fig. 5a). ΔZPE is less than 0.33 kJ mol−1 in 95% of polymorph pairs and the largest calculated difference is just over 0.7 kJ mol−1.
Molar heat capacities do not vary greatly from their expected equipartition value. Since our lattice dynamical treatment excludes intramolecular vibrations, each molecule has six vibrational degree of freedom (3 translational and 3 rotational) and the calculated Cv ≈ 6R (Fig. 6). This is the expected result at room temperature, since the entire phonon density of states for almost all crystal structures falls below kBT (208.5 cm−1 at 300 K), so that there is significant thermal population of energy levels for all vibrational modes. As a consequence, heat capacity differences between polymorphs are very small (Fig. 5b): in 95% of polymorph pairs, Cv differs by less than 0.46 J mol−1 K−1.
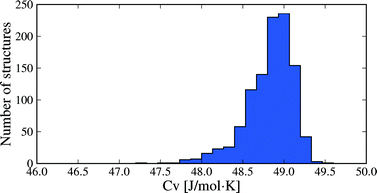 | ||
| Fig. 6 Distribution of heat capacities calculated at 300 K for all 1061 crystal structures. Only intermolecular vibrational mode contributions are included. | ||
Entropy differences are, at room temperature, an order of magnitude larger than the thermal contribution to internal energy (Fig. 5c) and entropy is by far the most important vibrational contribution to polymorph free energy differences. As with all of our observed distributions, entropy differences are often small: 50.7% of calculated ΔS are below 2 J mol−1 K−1, corresponding to only 0.6 kJ mol−1 at 300 K. However, ΔS is greater than 5.4 J mol−1 K−1 in 10% of polymorph pairs and exceeds 6.8 J mol−1 K−1 in 5% of pairs, corresponding to a 2 kJ mol−1 contribution to the room temperature free energy difference. These largest entropy differences are important when compared to the static lattice energy differences, which are less than 2 kJ mol−1 in over half the polymorph pairs. Vibrational effects are most important in the cases where large entropy differences are coupled with small lattice energy differences.
Two caveats to these results are that i) vibrational energy contributions have been calculated in the rigid molecule approximation, and ii) non-vibrational contributions to the entropy have not been included. While molecular flexibility and intramolecular energy differences are fully accounted for during geometry optimisation and in our lattice energy calculations, the rigid molecule lattice dynamical treatment means that intramolecular vibrational frequencies are ignored. This approximation will affect the absolute thermodynamic quantities; for example, heat capacities (Fig. 6) will be significantly underestimated for molecules where intramolecular vibrations are near or below kBT. However, the focus here is on differences in thermodynamic quantities between polymorphs and we expect that intramolecular vibrational energy differences will only be important in specific cases, such as conformational polymorphism. For this reason, inclusion of intramolecular vibrations using the hybrid energy model (eqn (1)) will be a focus of future work. In terms of non-vibrational entropy contributions, disorder is expected to be the other main source of entropy differences between polymorphs. Greater static or dynamic disorder in one polymorph than another can easily lead to entropy differences that match or exceed the vibrational entropy differences.50–52 These contributions must be considered when disorder is present in one or more polymorphs.
3.4 Physical origins of entropy differences
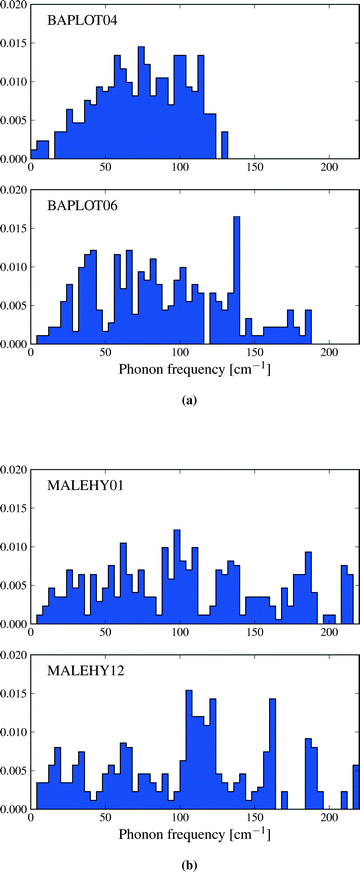
The thermodynamic properties described in this section are functions of the phonon density of states, and differences in entropy, heat capacity and zero point energy arise from variations in the distribution of lattice vibrational frequencies between polymorphs. Calculated phonon frequencies fall in the range between 4 and 220 cm−1 – a wider frequency band than was observed by Gavezzotti and Filippini17 – and the distribution of frequencies in this range can vary significantly between polymorphs. As an example, Fig. 7a shows the vibrational frequency distributions in theophylline forms I and II. Form II is favoured by lattice energy and is known to be the thermodynamically more stable of forms I and II at low temperatures.53 However, form I displays a lower frequency distribution than form II. This leads to a relatively large difference in entropy (ΔS = 6.5 J mol−1 K−1) favouring form I and an enantiotropic phase transition between these structures, which is known to occur at high temperatures.53 By contrast, many pairs of polymorphs have very similar distributions of vibrational frequencies, leading to smaller differences in entropy: for example, Fig. 7b shows the density of states of the two monoclinic polymorphs of maleic hydrazide, whose vibrational entropies differ by only 0.84 J mol−1 K−1 (polymorph MH3,54 MALEHY12, having the slightly higher entropy).A pertinent question is what causes these differences in vibrational frequencies. In the examples quoted above, the theophylline polymorphs I and II differ in which atoms are involved in hydrogen bonding, while maleic hydrazide forms the same hydrogen bonding in both polymorphs. Differences in strong intermolecular interactions undoubtedly lead to different vibrational spectra and, sometimes, differences in thermodynamic properties. However, a detailed analysis of interactions in 1061 crystal structures is not possible. Instead, we ask if a coarser description of structural differences is useful.
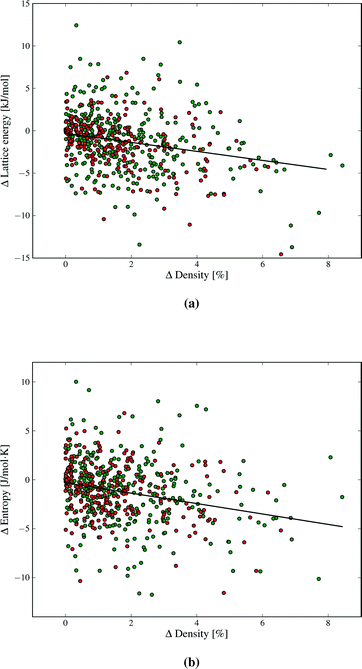
Our results demonstrate a weak (R2 = 0.09), but statistically significant, correlation between lattice energy and density differences between polymorphs (Fig. 8a). The denser polymorph tends to have a lower (i.e. more stable) lattice energy. Structures with lower density are often assumed to vibrate with lower frequencies, due to molecules having more free space to move, and hence might be expected to have higher entropy. There is indeed such a trend in our findings (Fig. 8b). As with lattice energy, the correlation is extremely weak (R2 = 0.06), but statistically significant. A lower density polymorph tends to have more vibrational entropy. Both correlations represent trends across a large set of polymorph pairs and are not predictive for individual cases. In terms of free energy, the trends in lattice energy and vibrational entropy compensate each other, contributing to the finding that Fvib usually lowers polymorph energy differences. However, the scatter in Fig. 8 shows that other factors, such as detailed structural features and specific intermolecular interactions, often dominate the bulk trend. Nevertheless, entropy can be expected to contribute a stabilising effect for poorly packed crystal structures, such as clathrates and inclusion compounds.
Strong directional interactions, and hydrogen bonds in particular, might interfere with the close-packing of crystals and cause differences in density and entropy between polymorphs. We have therefore examined if there are any differences in the distributions of ΔFvib and ΔS between polymorphs for molecules with and without hydrogen bonds (green and red data points, respectively, in Fig. 4, 8, 9 and additional figures in the ESI†). We find no evidence for a difference in distribution of thermodynamic property differences between polymorphs based on the presence or absence of hydrogen bonding.
3.5 Outliers and particular observations
The largest lattice and free energy difference (ΔElatt = 18.5, ΔA = 18.2 kJ mol−1) is between the polymorphs of 3,5-diphenyl-4-amino-1,2,4-triazole (UKANOJ/01, Fig. 1e). The reason is the dramatically different hydrogen bonding motifs in these structures. The more stable UKANOJ01 has a stable 3-dimensional network of strong N–H⋯N hydrogen bonds, while UKANOJ forms an unfavourable structure with unusually long hydrogen bonds.We also calculate a large difference in lattice energy ΔElatt = 14.5 kJ mol−1 for the polymorph pair JARXUV/01 (Fig. 1d). This is one of the largest molecules in our set, so the lattice energies are large in magnitude. While the percentage lattice energy difference (8%) for this pair is also one of the largest in our set, the value is less exceptionally large. In discussing polymorphs of molecules of different size, percentage lattice energy differences may be more meaningful than absolute differences. Also, for this pair, the vibrational energy stabilises the higher energy polymorph (JARXUV01) by 1.55 kJ mol−1, so the free energy difference is less extreme than the lattice energy difference.
For the polymorph pair BEBMAX/01 (Fig. 1f), we calculate one polymorph (BEBMAX) to have 20 J mol−1 K−1 higher entropy than the other at 300 K. BEBMAX has very anisotropic unit cell dimensions and turns out to be particularly sensitive to the phonon k-point sampling. ΔS is still large (9.14 J mol−1 K−1), but less extreme with a finer 0.08 Å−1 sampling.
3,4-Cyclobutylfuran (XULDUD, Fig. 1c) was a target in the first blind test of crystal structure predictions.55 It was later discovered that XULDUD was highly unstable and a disappearing polymorph. Our calculations show that the XULDUD structure is located at a saddle point on the potential energy surface and symmetry breaking results in a stable Z′ = 2 structure. The lowering in energy is small and the observed structure is probably a thermal average over the symmetry-broken minima. A similar phenomenon was found for only a handful of crystal structures.
The polymorphs of 2-amino-5-nitropyrimidine (PUPBAD/01/02, Fig. 1g), have attracted some interest before. An attempt to calculate their relative stability and to rationalize their polymorphic behaviour was reported by Aakeröy et al.56 They concluded that the orthorhombic form III (PUPBAD) has the lowest lattice energy, but quantification of energy differences was limited by difficulties in treating molecular flexibility with their computational methods. Thermal (DSC) studies were also inconclusive. Indeed, by lattice energy, we find that form III (PUPBAD) is much more stable than forms I (PUPBAD01, ΔElatt = 6.7 kJ mol−1) and II (PUPBAD02, ΔElatt = 7.4 kJ mol−1). However, neglecting vibrational effects in these polymorphs is misleading. The entropy differences are exceptionally large (ΔS = 12 J mol−1 K−1 and 14 J mol−1 K−1 respectively) so that by 330 K, all three have essentially the same free energy. This helps explain why the three polymorphs crystallise concomitantly.56
3.6 Implications for crystal structure prediction
The results of this study should be valuable for discussion and analysis of polymorphism in general. An understanding of the expected energy differences between polymorphs forms a foundation for examinations of the influence of specific structural features and particular interactions on polymorph relative stabilities.One area where an understanding of polymorph energies is crucial is the ab initio prediction of crystal structures, which is usually performed by ranking computer-generated crystal structures by their calculated lattice energies.7,8,57 The fact that lattice energy differences tend to be so small demonstrates the challenge involved in correctly ranking the energies of predicted structures. The differences in calculated energies between observed and unobserved predicted crystal structures are typically as small as the polymorph energy differences seen here. Furthermore, given that observed polymorphs can differ by up to 10 kJ mol−1 in lattice energy, all predicted crystal structures within this energy range from the most stable structure can be seen as potentially observable polymorphs. Such an energy range frequently includes large numbers of putative crystal structures.58 In fact, our distribution of polymorph lattice energy differences closely matches the relative lattice energies of observed crystal structures in crystal structure prediction studies of small organic molecules.59 The reasons why predicted polymorphs outnumber observed polymorphs have recently been discussed by Price.60
A further observation relates to the use of lattice energy versus free energy in predicting relative stabilities of predicted polymorphs. Free energies should be used to assess the true thermodynamic stabilities of structures, but are often approximated by calculated lattice energies, due in large part to the added complexity and computational expense of free energy calculations. However, the small magnitude of lattice energy differences that we find between known polymorphs highlights the fact that it takes very little vibrational energy to cause a re-ranking of polymorph stability. While a small number of studies have shown promising results from the inclusion of dynamical effects in crystal structure prediction, either through a lattice dynamics18,61–63 or molecular dynamics64–66 approach, lattice energy-based predictions are still the norm.
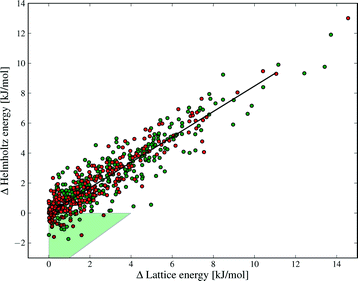
Our results show why lattice energies have achieved good success, particularly as the quality of lattice energy calculations has improved.14,16,67,68 The correlation between ΔA and ΔElatt is strong (R2 = 0.85, see Fig. 9), demonstrating that lattice energy is the dominant contribution to free energy differences. However, the slope of the regression line is 0.86, not 1, reflecting our finding that ΔElatt and ΔFvib are of opposite sign in the majority of cases; vibrational contributions in general decrease the energy differences between polymorphs. Furthermore, some pairs are re-ranked by the vibrational energy, which contradicts Gavezzotti and Filippini's conclusion that free energy differences always have the same sign as enthalpy differences.17 Differences in our conclusions may be due to their simpler force field model, lack of intramolecular energy in their assessment of lattice energies, as well as our different Brillouin zone sampling methods.
The green triangle in Fig. 9 marks the area where the vibrational contribution causes a discordant ranking of polymorph stability relative to lattice energy; this area covers 9% of the polymorph pairs. This fraction is large enough to justify the computational effort of free energy calculations, since this rate of mis-ranking over an entire landscape of predicted crystal structures can have a significant influence on the outcomes of a prediction.
4 Conclusions
Lattice energy minimisation and rigid-molecule harmonic lattice dynamics have been applied to understand thermodynamic property differences for a large set of experimentally determined, non-disordered, packing polymorphs of organic molecules. Our principle results are those summarised in Fig. 3 and 4, showing the distribution of static and vibrational energy differences between polymorphs. While our study is restricted to single-component crystal structures of molecules containing the elements C, N, O, H, F, Cl and S, given the large size of the structure set (1061 crystal structures in 508 polymorph families), and quality of the energy model, we believe that these faithfully reflect true energy differences and, thus, are of great value in discussing and understanding polymorphism.Unsurprisingly, the lattice energy differences between polymorphs are typically very small and are less than 7.2 kJ mol−1 in 95% of polymorph pairs. Entropies dominate the vibrational contribution to relative free energies and, while these contributions to relative free energies are typically small (|ΔFvib| < 2 kJ mol−1 in most cases), they can be large enough to significantly affect the calculated relative stability of polymorphs.
ΔFvib and ΔElatt are of opposite sign in 69% of the polymorph pairs, so that polymorph free energies usually converge with increasing temperature and will eventually cross. By T = 300 K, we find that vibrational contributions swap the stability order of 9% of polymorph pairs.
Correlations of energy and entropy differences with density are weak, and there is no evidence that polymorphs of hydrogen bonding and non-hydrogen bonding molecules show different trends in thermodynamic differences. Therefore, it is difficult to predict relative stability or thermodynamic behaviour based on these coarse descriptions of structure.
Based on the evidence presented here, computational studies of polymorph stability, including crystal structure prediction, should not be restricted to static lattice energy calculations. The influence of lattice vibrations is important in judging the true stability difference between polymorphs and a necessary consideration for the anticipation of temperature-driven phase transitions. Since the errors introduced by restricting lattice dynamics to a single k-point are large, the energy methods that are developed for use in the context of crystal structure prediction should be sufficiently efficient to allow adequate sampling of phonons without an unacceptably large computational expense. Currently, only atom–atom potentials meet these criteria and we believe that the continued development of accurate atom–atom models for such studies is necessary.
Acknowledgements
We thank Dr Manolis Vasileiadis for support and problem solving our use of the CrystalOptimizer program. The research leading to these results has received funding from the European Research Council under the European Union's Seventh Framework Programme (FP/2007-2013)/ERC Grant Agreement no. 307358 (ERC-stG-2012-ANGLE). The authors acknowledge the use of the IRIDIS High Performance Computing Facility at the University of Southampton.References
- J. Haleblian and W. McCrone, J. Pharm. Sci., 1969, 58, 911–929 CrossRef CAS PubMed.
- T. Siegrist, C. Besnard, S. Haas, M. Schiltz, P. Pattison, D. Chernyshov, B. Batlogg and C. Kloc, 2079–2082, Adv. Mater., 2007, 19 Search PubMed.
- J. Bernstein, Polymorphism in Molecular Crystals, Oxford University Press, 2002 Search PubMed.
- S. R. Chemburkar, J. Bauer, K. Deming, H. Spiwek, K. Patel, J. Morris, R. Henry, S. Spanton, W. Dziki, W. Porter, J. Quick, P. Bauer, J. Donaubauer, B. A. Narayanan, M. Soldani, D. Riley and K. McFarland, Org. Process Res. Dev., 2000, 4, 413–417 CrossRef CAS.
- J. Bauer, S. Spanton, R. Henry, J. Quick, W. Dziki, W. Porter, J. Quick, P. Bauer, J. Donaubauer, B. A. Narayanan, M. Soldani, D. Riley and K. McFarland, Pharm. Res., 2001, 18, 859–866 CrossRef CAS.
- W. Cabri, P. Ghetti, G. Pozzi and M. Alpegiani, Org. Process Res. Dev., 2007, 11, 64–72 CrossRef CAS.
- G. M. Day, Crystallogr. Rev., 2011, 17, 3–52 CrossRef.
- S. L. Price, Chem. Soc. Rev., 2014, 43, 2098–2111 RSC.
- J. S. Chickos and W. E. Acree, J. Phys. Chem. Ref. Data, 2002, 31, 537–698 CrossRef CAS PubMed.
- L. Yu, J. Pharm. Sci., 1995, 84, 966–974 CrossRef CAS PubMed.
- L. Yu, G. A. Stephenson, C. A. Mitchell, C. A. Bunnell, S. V. Snorek, J. J. Bowyer, T. B. Borchardt, J. G. Stowell and S. R. Byrn, J. Am. Chem. Soc., 2000, 122, 585–591 CrossRef CAS.
- C.-H. Gu and D. J. W. Grant, J. Pharm. Sci., 2001, 90, 1277–1287 CrossRef CAS PubMed.
- J. K. Guillory and D. M. Erb, Pharm. Manuf., 1985, 2(9), 28–33 Search PubMed.
- M. A. Neumann, F. J. Leusen and J. Kendrick, Angew. Chem., Int. Ed., 2008, 47, 2427–2430 CrossRef CAS PubMed.
- A. Otero-de-la-Roza and E. R. Johnson, J. Chem. Phys., 2012, 137, 054103 CrossRef CAS PubMed.
- G. J. O. Beran and K. Nanda, J. Phys. Chem. Lett., 2010, 1, 3480–3487 CrossRef CAS.
- A. Gavezzotti and G. Filippini, J. Am. Chem. Soc., 1995, 117, 12299–12305 CrossRef CAS.
- B. P. van Eijck, J. Comput. Chem., 2001, 22, 816–826 CrossRef CAS PubMed.
- J. van de Streek and S. Motherwell, Acta Crystallogr., Sect. B: Struct. Sci., 2005, 61, 504–510 Search PubMed.
- J. van de Streek, Acta Crystallogr., Sect. B: Struct. Sci., 2006, 62, 567–579 Search PubMed.
- Z. F. Weng, W. S. Motherwell and J. M. Cole, J. Appl. Crystallogr., 2008, 41, 955–957 CrossRef CAS.
- A. J. Cruz-Cabeza and J. Bernstein, Chem. Rev., 2013, 114, 2170–2191 CrossRef PubMed.
- A. L. Spek, J. Appl. Crystallogr., 2003, 36, 7–13 CrossRef CAS.
- A. J. Stone and S. L. Price, J. Phys. Chem., 1988, 92, 3325–3335 CrossRef CAS.
- S. L. Price, M. Leslie, G. W. A. Welch, M. Habgood, L. S. Price, P. G. Karamertzanis and G. M. Day, Phys. Chem. Chem. Phys., 2010, 12, 8478–8490 RSC.
- A. Stone and M. Alderton, Mol. Phys., 2002, 100, 221–233 CrossRef.
- A. J. Stone, Distributed Multipole Analysis of Gaussian wavefunctions, GMDA version 2.2.02 Search PubMed.
- H. P. Thompson, E. O. Pyzer-Knapp and G. M. Day, 2015, Manuscript in preparation.
- E. O. Pyzer-Knapp, Ph.D. thesis, University of Cambridge, 2014 Search PubMed.
- D. E. Williams, J. Comput. Chem., 2001, 22, 1154–1166 CrossRef CAS PubMed.
- A. Abraha and D. E. Williams, Inorg. Chem., 1999, 38, 4224–4228 CrossRef CAS.
- G. M. Day and S. L. Price, J. Am. Chem. Soc., 2003, 125, 16434–16443 CrossRef CAS PubMed.
- A. Kazantsev, P. Karamertzanis, C. Pantelides and C. Adjiman, CrystalOptimizer: An Efficient Algorithm for Lattice Energy Minimization of Organic Crystals Using Isolated-Molecule Quantum Mechanical Calculations, 2010 Search PubMed.
- A. V. Kazantsev, P. G. Karamertzanis, C. S. Adjiman and C. C. Pantelides, J. Chem. Theory Comput., 2011, 7, 1998–2016 CrossRef CAS.
- M. J. Frisch, G. W. Trucks, H. B. Schlegel, G. E. Scuseria, M. A. Robb, J. R. Cheeseman, G. Scalmani, V. Barone, B. Mennucci, G. A. Petersson, H. Nakatsuji, M. Caricato, X. Li, H. P. Hratchian, A. F. Izmaylov, J. Bloino, G. Zheng, J. L. Sonnenberg, M. Hada, M. Ehara, K. Toyota, R. Fukuda, J. Hasegawa, M. Ishida, T. Nakajima, Y. Honda, O. Kitao, H. Nakai, T. Vreven, J. A. Montgomery, Jr., J. E. Peralta, F. Ogliaro, M. Bearpark, J. J. Heyd, E. Brothers, K. N. Kudin, V. N. Staroverov, R. Kobayashi, J. Normand, K. Raghavachari, A. Rendell, J. C. Burant, S. S. Iyengar, J. Tomasi, M. Cossi, N. Rega, J. M. Millam, M. Klene, J. E. Knox, J. B. Cross, V. Bakken, C. Adamo, J. Jaramillo, R. Gomperts, R. E. Stratmann, O. Yazyev, A. J. Austin, R. Cammi, C. Pomelli, J. W. Ochterski, R. L. Martin, K. Morokuma, V. G. Zakrzewski, G. A. Voth, P. Salvador, J. J. Dannenberg, S. Dapprich, A. D. Daniels, O. Farkas, J. B. Foresman, J. V. Ortiz, J. Cioslowski and D. J. Fox, Gaussian 09 Revision A.02, 2009, Gaussian Inc.Wallingford CT, 2009 Search PubMed.
- B. Fultz, Prog. Mater. Sci., 2010, 55, 247–352 CrossRef CAS PubMed.
- M. Born and K. Huang, Dynamical theory of crystal lattices, Clarendon Press Oxford, vol. 188, 1954 Search PubMed.
- S. Califano, Lattice dynamics and intermolecular forces, Academic Press, vol. 55, 1975 Search PubMed.
- N. Neto, R. Righini, S. Califano and S. Walmsley, Chem. Phys., 1978, 29, 167–179 CrossRef CAS.
- S. Califano, V. Schettino and N. Neto, Lattice dynamics of molecular crystals, Springer-Verlag Berlin, vol. 26, 1981 Search PubMed.
- G. M. Day, S. L. Price and M. Leslie, J. Phys. Chem. B, 2003, 107, 10919–10933 CrossRef CAS.
- G. M. Day, Ph.D. thesis, University College London, 2003 Search PubMed.
- G. M. Day, J. A. Zeitler, W. Jones, T. Rades and P. F. Taday, J. Phys. Chem. B, 2006, 110, 447–456 CrossRef CAS PubMed.
- R. Li, J. A. Zeitler, D. Tomerini, E. P. J. Parrott, L. F. Gladden and G. M. Day, Phys. Chem. Chem. Phys., 2010, 12, 5329–5340 RSC.
- M. D. Eddleston, K. E. Hejczyk, E. G. Bithell, G. M. Day and W. Jones, Chem. – Eur. J., 2013, 19, 7874–7882 CrossRef CAS PubMed.
- M. D. Eddleston, K. E. Hejczyk, A. M. C. Cassidy, G. M. Day, H. P. G. Thompson and W. Jones, Manuscript in preparation.
- J. Nyman, In Silico Predictions of Porous Molecular Crystals and Clathrates, 2014, M. Phil thesis, University of Southampton Search PubMed.
- H. P. Thompson and G. M. Day, Chem. Sci., 2014, 5, 3173–3182 RSC.
- P. G. Karamertzanis, G. M. Day, G. W. A. Welch, J. Kendrick, F. J. J. Leusen, M. A. Neumann and S. L. Price, J. Phys. Chem. B, 2008, 128, 244708 CrossRef PubMed.
- B. P. van Eijck, Phys. Chem. Chem. Phys., 2002, 4, 4789–4794 RSC.
- M. Habgood, R. Grau-Crespo and S. L. Price, Phys. Chem. Chem. Phys., 2011, 13, 9590–9600 RSC.
- A. J. Cruz-Cabeza, G. M. Day and W. Jones, Phys. Chem. Chem. Phys., 2011, 13, 12808–12816 RSC.
- B. Legendre and S. L. Randzio, Int. J. Pharm., 2007, 343, 41–47 CrossRef CAS PubMed.
- A. Katrusiak, Acta Crystallogr., Sect. B: Struct. Sci., 2001, 57, 697–704 CAS.
- J. P. M. Lommerse, W. D. S. Motherwell, H. L. Ammon, J. D. Dunitz, A. Gavezzotti, D. W. M. Hofmann, F. J. J. Leusen, W. T. M. Mooij, S. L. Price, B. Schweizer, M. U. Schmidt, B. P. van Eijck, P. Verwer and D. E. Williams, Acta Crystallogr., Sect. B: Struct. Sci., 2000, 56, 697–714 CAS.
- C. B. Aakeröy, M. Nieuwenhuyzen and S. L. Price, J. Am. Chem. Soc., 1998, 120, 8986–8993 CrossRef.
- D. A. Bardwell, C. S. Adjiman, Y. A. Arnautova, E. Bartashevich, S. X. M. Boerrigter, D. E. Braun, A. J. Cruz-Cabeza, G. M. Day, R. G. Della Valle, G. R. Desiraju, B. P. van Eijck, J. C. Facelli, M. B. Ferraro, D. Grillo, M. Habgood, D. W. M. Hofmann, F. Hofmann, K. V. J. Jose, P. G. Karamertzanis, A. V. Kazantsev, J. Kendrick, L. N. Kuleshova, F. J. J. Leusen, A. V. Maleev, A. J. Misquitta, S. Mohamed, R. J. Needs, M. A. Neumann, D. Nikylov, A. M. Orendt, R. Pal, C. C. Pantelides, C. J. Pickard, L. S. Price, S. L. Price, H. A. Scheraga, J. van de Streek, T. S. Thakur, S. Tiwari, E. Venuti and I. K. Zhitkov, Acta Crystallogr., Sect. B: Struct. Sci., 2011, 67, 535–551 CAS.
- G. M. Day, J. Chisholm, N. Shan, W. D. S. Motherwell and W. Jones, Cryst. Growth Des., 2004, 4, 1327–1340 CAS.
- G. M. Day, W. D. S. Motherwell and W. Jones, Cryst. Growth Des., 2005, 5, 1023–1033 CAS.
- S. L. Price, Acta Crystallogr., Sect. B: Struct. Sci., Cryst. Eng. Mater., 2013, 69, 313–328 CrossRef CAS PubMed.
- A. T. Anghel, G. M. Day and S. L. Price, CrystEngComm, 2002, 4, 348–355 RSC.
- G. M. Day, T. G. Cooper, A. J. Cruz-Cabeza, K. E. Hejczyk, H. L. Ammon, S. X. M. Boerrigter, J. S. Tan, R. G. Della Valle, E. Venuti, J. Jose, S. R. Gadre, G. R. Desiraju, T. S. Thakur, B. P. van Eijck, J. C. Facelli, V. E. Bazterra, M. B. Ferraro, D. W. M. Hofmann, M. A. Neumann, F. J. J. Leusen, J. Kendrick, S. L. Price, A. J. Misquitta, P. G. Karamertzanis, G. W. A. Welch, H. A. Scheraga, Y. A. Arnautova, M. U. Schmidt, J. van de Streek, A. K. Wolf and B. Schweizer, Acta Crystallogr., Sect. B: Struct. Sci., 2009, 65, 107–125 CAS.
- A. J. Cruz-Cabeza, G. M. Day and W. Jones, Chem. – Eur. J., 2008, 14, 8830–8836 CrossRef CAS PubMed.
- A. Gavezzotti, J. Am. Chem. Soc., 2000, 122, 10724–10725 CrossRef CAS.
- P. Raiteri, R. Martonák and M. Parrinello, Angew. Chem., Int. Ed., 2005, 44, 3769–3773 CrossRef CAS PubMed.
- P. G. Karamertzanis, P. Raiteri, M. Parrinello, M. Leslie and S. L. Price, J. Phys. Chem. B, 2008, 112, 4298–4308 CrossRef CAS PubMed.
- P. J. Bygrave, N. L. Allan and F. R. Manby, J. Phys. Chem., 2012, 137, 164102 CrossRef CAS PubMed.
- J. Yang, W. Hu, D. Usvyat, D. Matthews, M. Schütz and G. K.-L. Chan, Science, 2014, 345, 640–643 CrossRef CAS PubMed.
Footnote |
| † Electronic supplementary information (ESI) available: List of included polymorphs, a description of co-prime splitting for phonon k-point sampling, additional vibrational energy convergence results, force field parameters and energy distributions split by hydrogen bonding. See DOI: 10.1039/c5ce00045a |
| This journal is © The Royal Society of Chemistry 2015 |

