
 Open Access Article
 This Open Access Article is licensed under a Creative Commons Attribution-Non Commercial 3.0 Unported Licence
Two polymorphs of 4-hydroxypiperidine with different NH configurations†‡
Cindy
Döring
a,
Christian
Näther
b,
Inke
Jess
b,
Kerstin
Ibrom
c and
Peter G.
Jones
*a
aInstitut für Anorganische und Analytische Chemie, Technische Universität Braunschweig, Postfach 3329, D-38023 Braunschweig, Germany. E-mail: p.jones@tu-bs.de; Fax: +49 531 5387; Tel: +49 531 5382
bInstitut für Anorganische Chemie, Christian-Albrechts-Universität zu Kiel, Max-Eyth-Str. 2, D-24118 Kiel, Germany
cNMR-Laboratorium der Chemischen Institute, Technische Universität Braunschweig, Postfach 3329, D-38023 Braunschweig, Germany
First published on 5th February 2015
Abstract
4-Hydroxypiperidine 1 exists in two crystal forms, tetragonal 1t, space group P![[4 with combining macron]](https://www.rsc.org/images/entities/char_0034_0304.gif) 21c and orthorhombic 1o, space group Fdd2, both with one molecule in the asymmetric unit. The latter form was obtained only rarely and in small quantities. In form 1t, the NH hydrogen is axial, whereas in 1o it is equatorial; the OH group is equatorial in both structures. The packing of both forms involves one hydrogen bond N–H⋯O and one O–H⋯N. In solution, NMR spectra indicate the presence of separate axial and equatorial forms (with respect to the OH group) below ca. −53 °C; however, not even at −104 °C, the lowest temperature reached, could any freezing out of the inversion at nitrogen be observed, implying that the energy barrier for this process is (as expected) small. We were unable to convert 1t, which appears to be the more stable form over the whole temperature range up to the melting point, to 1o by heating or via melting and re-cooling (or by any other method), perhaps because the hydrogen-bonding pattern is resistant to change. The crystalline forms 1t and 1o, despite being polymorphs of 1 with different NH configurations, should not be described as “configurational polymorphs” because of the facile interconversion in solution.
21c and orthorhombic 1o, space group Fdd2, both with one molecule in the asymmetric unit. The latter form was obtained only rarely and in small quantities. In form 1t, the NH hydrogen is axial, whereas in 1o it is equatorial; the OH group is equatorial in both structures. The packing of both forms involves one hydrogen bond N–H⋯O and one O–H⋯N. In solution, NMR spectra indicate the presence of separate axial and equatorial forms (with respect to the OH group) below ca. −53 °C; however, not even at −104 °C, the lowest temperature reached, could any freezing out of the inversion at nitrogen be observed, implying that the energy barrier for this process is (as expected) small. We were unable to convert 1t, which appears to be the more stable form over the whole temperature range up to the melting point, to 1o by heating or via melting and re-cooling (or by any other method), perhaps because the hydrogen-bonding pattern is resistant to change. The crystalline forms 1t and 1o, despite being polymorphs of 1 with different NH configurations, should not be described as “configurational polymorphs” because of the facile interconversion in solution.
Introduction
As witnessed by the appearance of this special edition of CrystEngComm, the phenomenon of polymorphism, the ability of a chemical compound to exist in more than one crystalline form, is the focus of much current interest and has been the subject of many books and review articles.1 A famous specific case is that of benzamide, for which the structure of a second polymorph was established some 170 years after it was first observed, and the existence of a third polymorph has recently been established.2One particular aspect of polymorphism research is the attempt to classify various types of polymorphism. A fascinating recent review article, for example,3 presents many examples of conformational polymorphism, whereby the two or more forms of a compound differ significantly in one or more torsion angles. However, as the authors make clear, there are also a great number of cases of polymorphism involving virtually identical molecular conformations.3
If conformational polymorphism is an established feature, one might provocatively ask if configurational polymorphism could also exist. Since different configurations such as cis/trans imply different isomers and thus different compounds,4 this appears to rule out the term polymorph for configurational isomers. What happens, however, if the energy barrier is not too great, so that the isomers might be interconvertible in solution, in the melt or even in the solid state? In this connection we note that the philosopher C. E. M. Joad was famous for answering every question with “It depends what you mean by …”; exact definitions are important, and we return to this principle below.
It is not easy to create polymorphs to order.5 We too are interested in polymorphism (see e.g.ref. 6–8), whereby we have generally depended on serendipity and the recognition of alternative crystal habits as a precondition for more detailed investigations. Our chemical and crystallographic interests, including studies of amine complexes of gold9 and solvates/adducts of urea derivatives,10 have provided numerous examples. The most recent of these is 4-hydroxypiperidine (1), which we present here. The two crystalline forms differ in the configuration at the nitrogen-bonded hydrogen atom.
Substituted piperidines can in principle change their ring conformation by ring inversion and can also undergo inversion at the nitrogen atom. Relevant energy terms for such processes are the free energy difference ΔΔG between the mutually inverted forms and the free energy of activation (ΔG‡) for the inversion processes. The conformations of piperidines in solution have been the subject of several NMR spectroscopic studies (e.g.ref. 11–20). Piperidine itself prefers the chair conformation with a barrier to ring inversion of 10.4 kcal mol−1.15 Initially there was a controversial discussion about the axial–equatorial NH equilibrium in piperidine.15a,16 Anet and Yavari,17 however, were able to determine ΔG‡ for nitrogen inversion as 6.1 ± 0.2 kcal mol−1 in a 1H and 13C NMR study at very low temperatures down to −174 °C, with ΔΔG only 0.36 kcal mol−1. They concluded that the more stable orientation of the NH proton is probably equatorial.
Abraham and Medforth18 studied the conformational equilibria of piperidine and some of its simple derivatives, including 1, with a bulky cobalt(III)–porphyrin shift reagent that binds specifically to the amine nitrogen atom. The spin–spin coupling constants in the 1H NMR spectra of the resulting complexes revealed that the equatorial position of the OH group in 1 was, as expected, favoured over the axial position, whereas the amine proton necessarily takes the axial position at nitrogen in both conformers, to allow the central atom of the shift reagent to coordinate at the equatorial position. This conformational equilibrium of 1 has also been analysed with the J-value method,19,20 with similar conclusions; the equatorial conformer with respect to the OH group is some 0.8 kcal mol−1 more stable than the axial (perhaps surprisingly, this preference is reversed for the corresponding piperidinium cation).
The important conclusion for this paper is that the various conformations and configurations of substituted piperidines are generally closely similar in energy. We note also, trivially, that commercially available piperidine derivatives are never listed by suppliers as displaying a particular configuration, again implying a delicate energy balance between axial and equatorial forms, with facile interconversion at least in solution; despite the interconverting configurations, it is clear that only one compound is involved.
Experimental
Crystal growth
Our studies of amine complexes of gold(I) have shown that the use of undiluted liquid amines is generally necessary for successful syntheses.9 However, because we had access to a sample of 4-hydroxypiperidine 1, a solid at room temperature, we decided to attempt the synthesis of the corresponding AuCl complex. As we had feared, all crystals thus obtained proved to be the unchanged starting material 1, but optically there seemed to be two different habits. Thus, a mixture of thtAuCl (40 mg, 0.125 mmol) in 1 ml dichloromethane and 1 (300 mg, 2.96 mmol) in 1.5 ml dichloromethane was overlayered with various precipitants in small test-tubes (diameter ca. 5 mm). With pentane or heptane, form 1t (later shown to be tetragonal) was obtained as colourless needles. Crystals of form 1o (orthorhombic) were obtained with petrol ether as colourless blocks. Both crystal forms are shown in Fig. 1.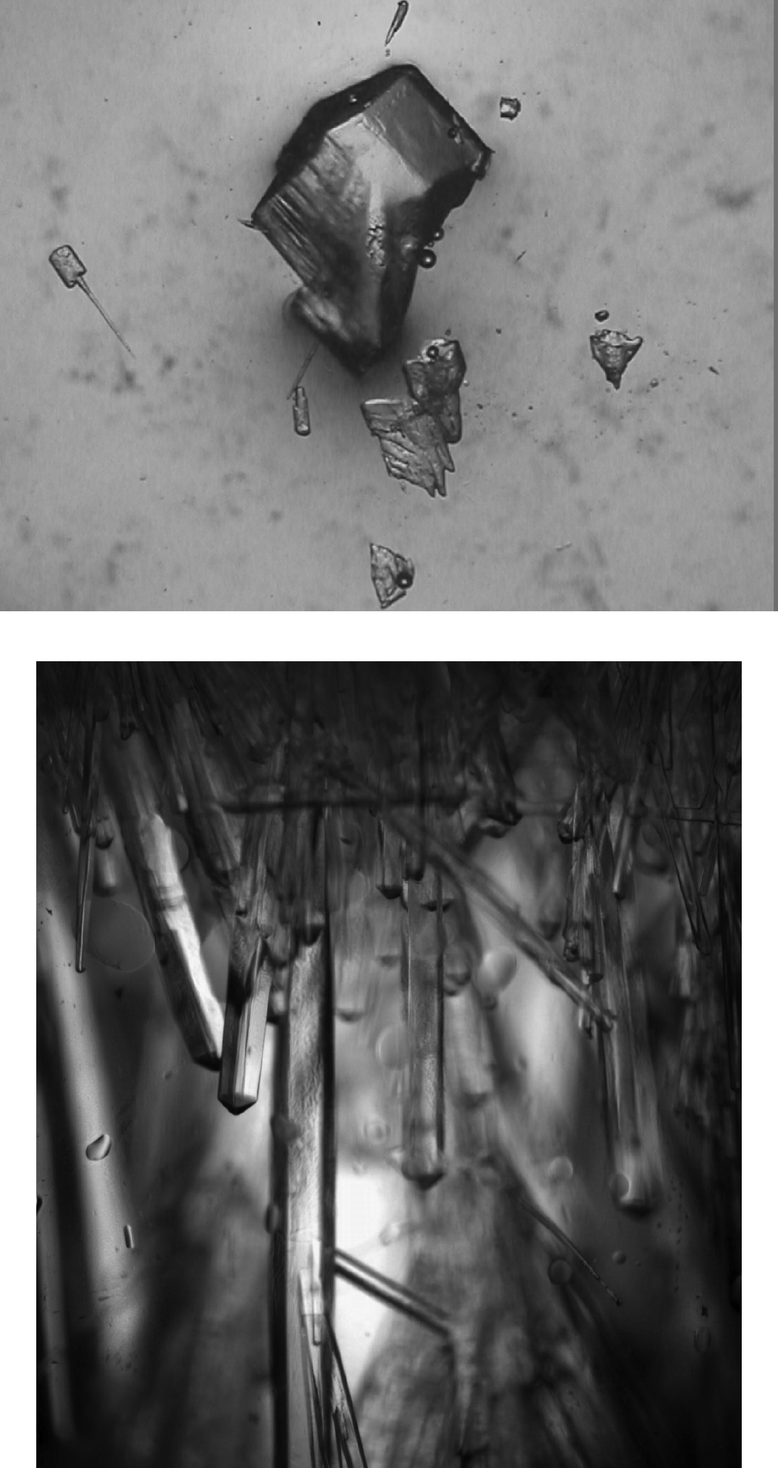 | ||
| Fig. 1 Crystals of the two forms of compound 1. Above: orthorhombic form 1o, part of the crystal actually measured (max. linear dimension ca. 0.4 mm). Below: tetragonal form 1t as grown in the test-tube with pentane precipitant (total width ca. 2 mm). | ||
Frustratingly, the production of these polymorphs via the chemically passive gold “precursor” proved not to be generally reproducible. Form 1o was obtained on just one further occasion by overlaying a solution of 1 (150 mg, 1.48 mmol) in 2 ml 3-picoline with pentane. After this initial brief success, it was never again obtained pure, but only as the occasional crystal in samples consisting mostly of 1t. The polymorphs are thus concomitant, but the yields of 1o become almost vanishingly small. This is not an unusual observation, and more extreme cases correspond to the known phenomenon of “disappearing polymorphs”;21 even if 1o does not entirely disappear, it does conceal itself very effectively.
The corresponding hydrochloride 2 (4-hydroxypiperidinium chloride) was deliberately prepared for attempts to obtain crystalline 1o by neutralisation. Single crystals of 2 in the form of colourless blocks were obtained by drying a solution of 1 (300 mg, 2.96 mmol) in 1.5 ml water and 0.5 ml conc. HCl over solid sodium hydroxide in a desiccator.
Further derivatives of 1 were obtained by chance from other crystallization attempts. Bis(4-hydroxypiperidinyl)methane 3, presumably resulting from nucleophilic displacement of chloride from dichloromethane, was obtained as single crystals in the form of colourless blocks by overlaying a mixture of thtAuCl (40 mg, 0.125 mmol) in 1 ml dichloromethane and 1 (300 mg, 2.96 mmol) in 1.5 ml dichloromethane with petrol ether.
The CO2 adduct 4 (4-hydroxypiperidinium 4-hydroxypiperidine-1-carboxylate) was reproducibly obtained as single crystals in the form of colourless blocks by overlaying a solution of 1 (150 mg, 1.48 mmol) in 2 ml pyridine with diisopropyl ether. It is well known that some amines can absorb CO2 from the air to form carbamates, especially when crystallization tubes stand undisturbed for months.22 Structures of 2–4 are presented briefly for the sake of completeness.
X-ray crystallography
Details of intensity measurements and refinements are given in Table 1. Crystals were mounted in inert oil on glass fibres. Data were measured with an Oxford Diffraction Xcalibur E diffractometer using monochromated Mo Kα radiation;23 multi-scan absorption corrections were performed. The structures were solved with direct methods using SHELXS-97, and structure refinement was performed with full-matrix least-squares on F2 using SHELXL-97.24 NH and OH hydrogens were identified clearly in difference maps and refined freely (for one exception see below), other hydrogens using a riding model. Molecular graphics were prepared with XP.25| Solvate | 1t | 1o | 2 | 3 | 4 |
|---|---|---|---|---|---|
| Chemical formula | C5H11NO | C5H11NO | (C5H12NO)+Cl− | C11H22N2O2 | (C5H12NO)+ (C6H10NO3)− |
| M r | 101.15 | 101.15 | 137.61 | 214.31 | 227.28 |
| Crystal system, space group | Tetragonal, P21c |
Orthorhombic, Fdd2 | Monoclinic, P21/n | Orthorhombic, Pca21 | Triclinic, P![[1 with combining macron]](https://www.rsc.org/images/entities/char_0031_0304.gif) |
| Temperature (K) | 100 | 100 | 100 | 100 | 100 |
| a (Å) | 12.0295(4) | 21.3459(7) | 5.3800(2) | 11.5417(12) | 10.4947(10) |
| b (Å) | 12.0295(4) | 18.6413(6) | 20.4924(11) | 5.0515(5) | 11.9000(11) |
| c (Å) | 8.0824(4) | 5.93539(19) | 6.4026(3) | 21.0649(15) | 16.836(2) |
| α (°) | 90 | 90 | 90 | 90 | 76.943(10) |
| β (°) | 90 | 90 | 101.745(5) | 90 | 81.326(10) |
| γ (°) | 90 | 90 | 90 | 90 | 68.873(9) |
| V (Å3) | 1169.59 | 2361.78 | 691.10 | 1228.13 | 1905.0 |
| d calc (g/cm−3) | 1.149 | 1.138 | 1.323 | 1.159 | 1.288 |
| Z | 8 | 16 | 4 | 4 | 6 |
| Radiation, wavelength | Mo Kα, λ = 0.71073 Å | Mo Kα, λ = 0.71073 Å | Mo Kα, λ = 0.71073 Å | Mo Kα, λ = 0.71073 Å | Mo Kα, λ = 0.71073 Å |
| F(000) | 448 | 896 | 296 | 472 | 804 |
| μ (mm−1) | 0.08 | 0.08 | 0.46 | 0.08 | 0.10 |
| Crystal size (mm) | 0.2 × 0.2 × 0.1 | 0.35 × 0.35 × 0.35 | 0.35 × 0.35 × 0.15 | 0.2 × 0.2 × 0.1 | 0.25 × 0.15 × 0.08 |
| Transmissions | No abs. corr. | No abs. corr. | 0.98–1.00 | 0.96–1.00 | 0.98–1.00 |
| 2θmax (°) | 53.5 | 61.6 | 61.6 | 56.6 | 51.2 |
| No. of measured and independent reflections | 9202, 729 | 20![[thin space (1/6-em)]](https://www.rsc.org/images/entities/char_2009.gif) 678, 987 678, 987 |
18001, 2057 |
23143, 1565 |
10054 |
| Completeness | 100% | 99.3% to 2θ 61° | 98.9% to 2θ 61° | 99.9% | 99.9% |
| R int | 0.040 | 0.026 | 0.040 | 0.087 | — |
| wR(F2) all refl., R1 [F > 4σ(F)], S(F2) | 0.072, 0.031, 1.07 | 0.069, 0.027, 1.06 | 0.069, 0.030, 1.05 | 0.088, 0.040, 1.04 | 0.114, 0.054, 0.91 |
| No. of parameters/restraints | 72/0 | 72/1 | 85/0 | 144/2 | 491/21 |
| Δρmax,min (e Å−3) | 0.18, −0.15 | 0.24, −0.16 | 0.37, −0.22 | 0.18, −0.17 | 0.52, −0.33 |
X-ray powder diffraction
X-Ray powder diffraction measurements were performed using a STOE STADI P transmission powder diffractometer from STOE & CIE with an Mythen K1 detector using CuKα1 radiation (λ = 1.540598 Å).Differential thermal analysis and thermogravimetry
DTA-TG measurements were performed in Al2O3 crucibles using an STA-409CD thermobalance from Netzsch. Several measurements under nitrogen (purity 5.0) and air atmospheres with different heating rates were performed. All measurements employed a flow rate of 75 mL min−1 and were corrected for buoyancy and current effects. The instruments were calibrated using standard reference materials.Differential scanning calorimetry
DSC investigations were performed with the DSC 204/1/F from Netzsch and the DSC 1 Star System with STARe Excellence Software from Mettler-Toledo AG. The measurements were performed in Al pans with different heating rates under nitrogen. The instruments were calibrated using standard reference materials.Thermomicroscopy
Thermomicroscopic measurements were performed using a hot stage FP82 from Mettler and a microscope (BX60) from Olympus using the Analysis software package from Mettler. The calibration was checked using benzoic acid.NMR-spectroscopy
1H NMR (399.83 MHz) spectra were recorded in tetrahydrofuran-d8 (THF-d8) solution on a Bruker Avance DRX400 spectrometer. Internal chemical shift standards were tetramethylsilane (TMS, for 1H, δH = 0.00 ppm) or, in the F1 dimension of an H,C-HSQC spectrum, the solvent signal (C-2/-3 of THF-d8 for 13C, δC = 25.31 ppm). For the low temperature measurements of 1, 1H NMR spectra were acquired between 24 °C and −104 °C. The temperature display of the spectrometer was calibrated against the standard methanol sample (4% methanol in methanol-d4).26 H,H-COSY, H,H-NOESY and H,C-HSQC were acquired at −84 °C to verify signal assignment. Chemical exchange in the 1H NMR spectrum of 1 between the conformers with an equatorial and an axial OH group was observed by means of a H,H-NOESY spectrum at −84 °C, a mixing time of 500 ms was used. Standard Bruker pulse programs were used throughout.Results and discussion
Crystal structures of 1t and 1o
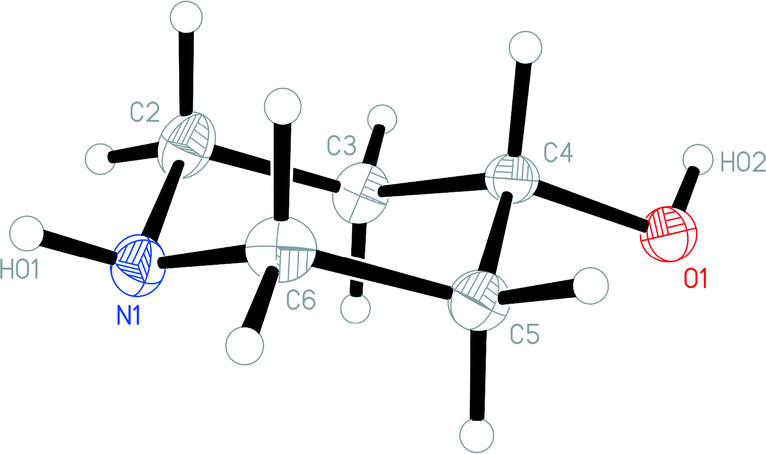
The molecule of 1t is shown in Fig. 2. The ring shows the typical chair form and the OH substituent is, as expected, equatorially oriented (this is also true for all other structures presented here except 4, see below). More surprising perhaps is the axial orientation of the N-bonded hydrogen; it seems that packing effects, presumably associated with the hydrogen bond pattern, override the slight preference for the equatorial orientation observed in solution. One might speculate that, similarly to the behaviour of the shift reagent mentioned above,18 the donor molecule acts as a bulky group and thus preferentially occupies the equatorial site at the acceptor nitrogen. A search of the Cambridge Database27 provided just five structures28 of mono-4-substituted piperidines with no further substituents; in all cases the 4-substituent was equatorial (torsion angle C–C–C–X ca. 180°), but the configuration of the NH group varied, being equatorial in five fragments and axial (absolute torsion angle C–C–N–H ca. 60°) in two. This implies that both configurations are of similar energy, consistent with the various NMR studies discussed in this paper. | ||
| Fig. 2 The molecule of 1t in the crystal. Ellipsoids correspond to 50% probability levels. | ||
The molecular packing of 1t involves two classical hydrogen bonds (Table 2). The interaction O1–H02⋯N1 links the molecules to form chains parallel to the a and b axes (Fig. 3), and these chains are linked in the c direction by N1–H01⋯O1.
| D–H⋯A | d(D–H) | d(H⋯A) | d(D⋯A) | <(DHA) | |
|---|---|---|---|---|---|
| a Symmetry transformations used to generate equivalent atoms: (i) x − 0.5, −y + 1.5, −z + 0.5; (ii) y, −x + 1, −z. | |||||
| 1 | O1–H02⋯N1i | 0.86(2) | 1.89(3) | 2.7464(18) | 172(2) |
| 2 | N1–H01⋯O1ii | 0.90(2) | 2.17(2) | 2.9794(19) | 150.1(18) |
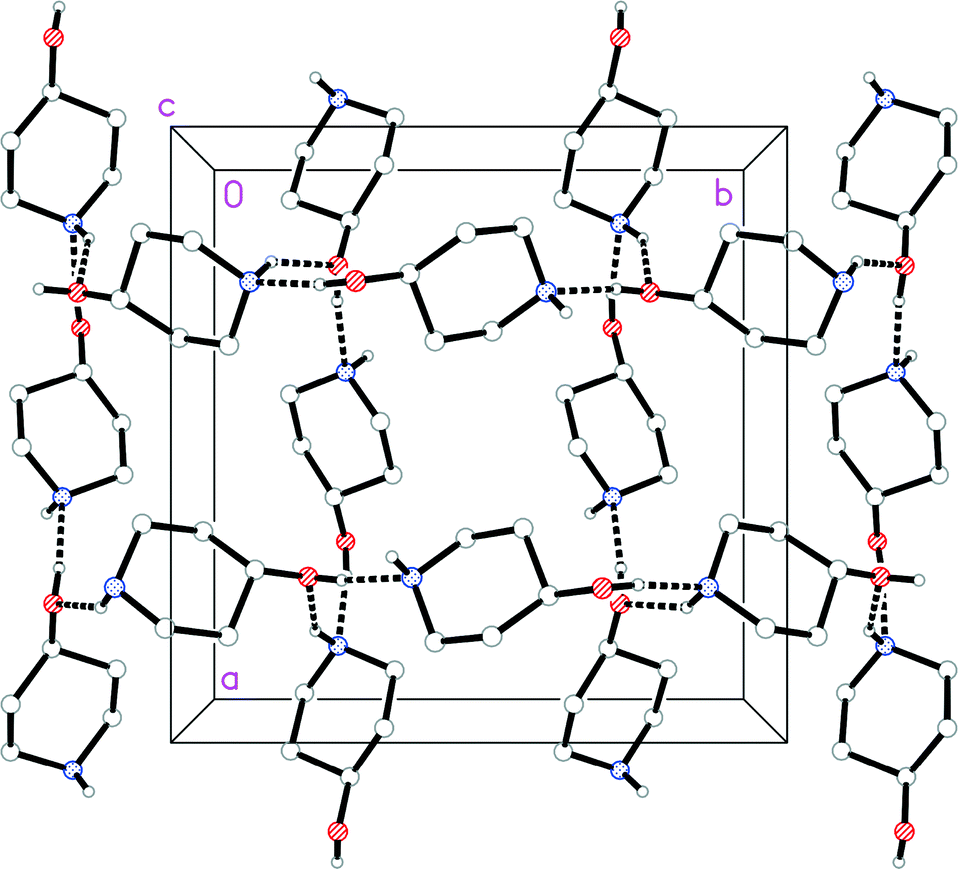 | ||
| Fig. 3 Packing diagram of 1t with view direction parallel to the c axis. Classical hydrogen bonds are drawn as thick dashed lines. Nitrogen atoms are drawn blue and oxygens red. | ||
The molecular structure of 1o is shown in Fig. 4. In contrast to 1t, the N-bonded hydrogen is equatorial; we stress that the OH group is also equatorial (as in 1t), so that 1o and 1t are not related by a simple conformational change, but by the “umbrella” inversion at nitrogen. The molecular packing of 1o involves two classical hydrogen bonds (Table 3), which qualitatively are the same as for 1t. The interaction O1–H02⋯N1 links the molecules to form helical chains parallel to [01], and the interaction N1–H01⋯O1 forms helical chains parallel to [101]. The simplest resulting pattern is a layer parallel to (11) (Fig. 5), but three-dimensional crosslinking occurs via symmetry-equivalent chains (packing diagrams in Fdd2 are seldom simple).
 | ||
| Fig. 4 The molecule of 1o in the crystal. Ellipsoids correspond to 50% probability levels. | ||
| D–H⋯A | d(D–H) | d(H⋯A) | d(D⋯A) | <(DHA) | |
|---|---|---|---|---|---|
| a Symmetry transformation used to generate equivalent atoms: (i) −x + 0.75, y + 0.75, z − 0.25; (ii) x − 0.25, −y + 0.25, z − 0.25. | |||||
| 1 | O1–H02⋯N1i | 0.87(2) | 1.88(2) | 2.7461(13) | 171.6(18) |
| 2 | N1–H01⋯O1ii | 0.862(17) | 2.161(18) | 3.0079(14) | 167.1(18) |
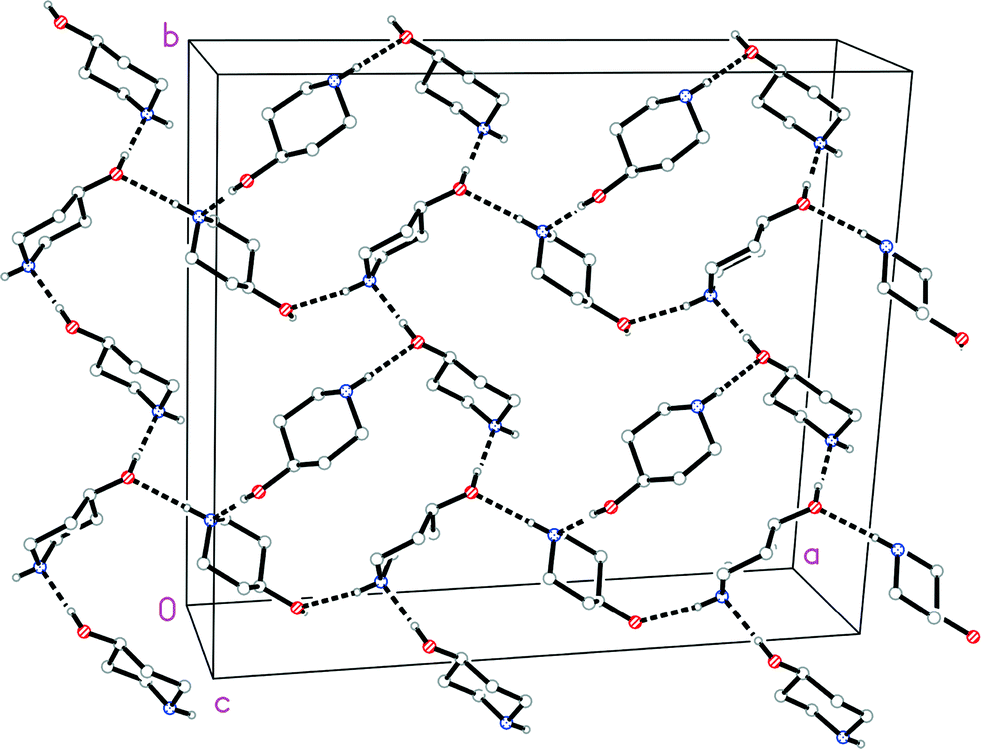 | ||
| Fig. 5 Packing diagram of 1o with view direction perpendicular to the plane (11). Classical hydrogen bonds are drawn as thick dashed lines. The two types of helical chain mentioned in the text run horizontally (two chains) and vertically (three chains). | ||
Having established that there are two crystal forms of 1, the question arises whether these should be described as polymorphs. Strictly speaking they represent different configurations and thus different isomers, at least in the “frozen” form in the solid state, but interconversion should occur via a modest energy barrier, and thus be feasible at least in solution (or in the melt). It should however be remembered that other factors may be important in the solid state. An early publication16 noted that the equatorial form of unsubstituted piperidine is some 0.4 kcal mol−1 more stable than the axial form, but that in other derivatives this preference could be affected by strong hydrogen bonding or further heterosubstituents. Mechanisms of solid-state phase changes have not often been investigated for molecular compounds; it might be expected that a complete rearrangement of the hydrogen bond system for 1 (because the OH donor would have to change from an equatorial acceptor site at nitrogen in 1t to an axial acceptor site in 1o) would be unfavourable. Such arguments are necessarily speculative in the absence of detailed solid-state energy calculations. We attempted in an earlier publication to give a tentative explanation for phase changes on cooling in two urea-lutidine adducts, in which the degree of rearrangement was however limited.8
Further studies were therefore carried out to address three problems: (1) is it possible to obtain a reliable supply of the less common form 1o? (2) Can the solid state forms 1o and 1t be interconverted? (3) Do the different configurations interconvert readily in solution, as would be expected?
Corresponding studies are presented below. These were made more difficult by the highly hygroscopic nature of 1, and also by its tendency to form amorphous or gelatinous phases. One possibility of accessing phase 1o seemed to be available via the aqueous solution that was formed on exposure of 1 to moist air, but the solutions thus formed deposited only crystals of 1t and small amounts of a yellow powder that we were unable to identify. Another possibility was to neutralise the hydrochloride 2, but storing a solution of this above sodium hydroxide in a desiccator only yielded crystalline 2. Many attempts to grow single crystals of 1o from various solvent mixtures only yielded (apart from 1t) crystals of the methylene-bridged “dimer” 3 and the carbamate 4. The structures of 2, 3 and 4 are presented briefly in the next section.
Crystal structures of 4-hydroxypiperidine derivatives 2, 3 and 4
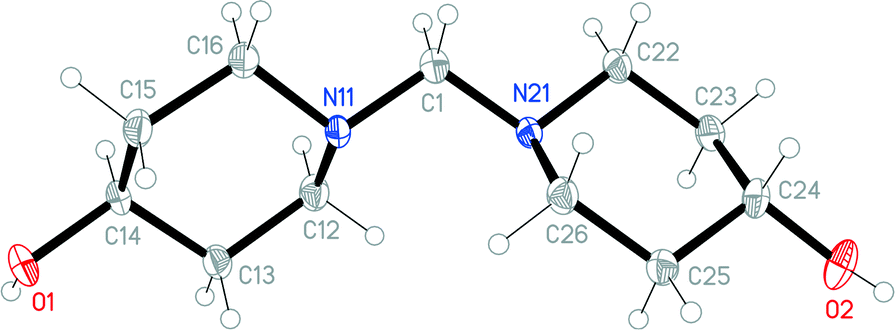
The structures of the hydrochloride 2, the methylene-bridged “dimer” 3 and the carbamate 4 are shown in Fig. 6–8. Structures 2 and 3 display no unusual features, except perhaps that the OH group in 2 is equatorial, in contrast to NMR evidence that the axial form should be slightly more stable (see discussion elsewhere in this paper); presumably hydrogen bonding effects are responsible, but this is difficult to prove. The structure of 4 is complex, involving three independent formula units; in one of the cations and two of the anions, the OH group is axial. All the carboxylate groups are approximately coplanar with the adjacent ring C–N–C moieties; whereby the N–Ccarboxylate bonds are ca. 0.1 Å shorter than the N–Cring bonds.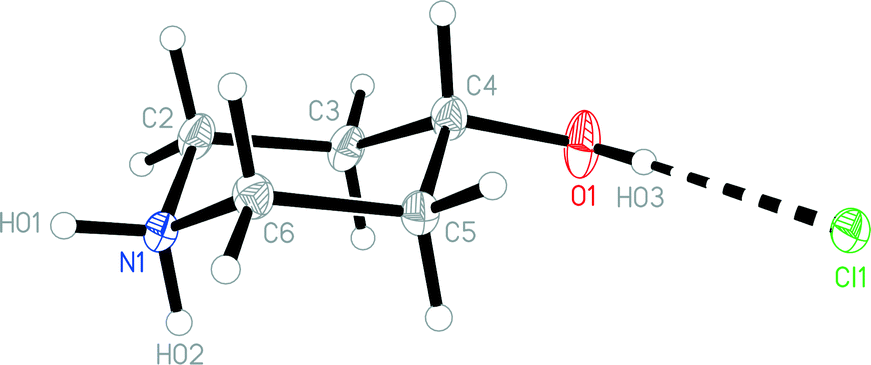 | ||
| Fig. 6 The formula unit of hydrochloride 2 in the crystal. Ellipsoids correspond to 50% probability levels. | ||
 | ||
| Fig. 7 The molecule of methylene-bridged “dimer” 3 in the crystal. Ellipsoids correspond to 50% probability levels. The molecule displays non-crystallographic twofold symmetry (r.m.s. deviation 0.01 Å). | ||
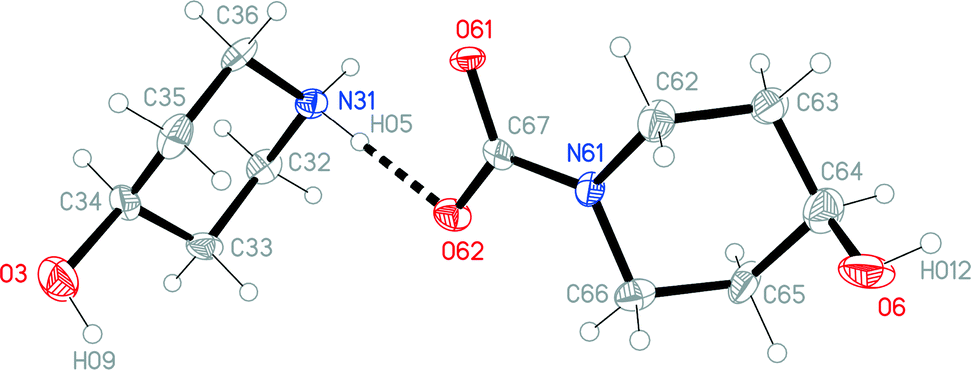 | ||
| Fig. 8 One of three independent formula units of carbamate 4 in the crystal. Ellipsoids correspond to 50% probability levels. The dashed line represents a classical hydrogen bond. | ||
The packing diagrams for 2 and 3, involving classical hydrogen bonds, are presented in the ESI.‡
Polymorphism of compound 1: physico-chemical investigations of forms 1t and 1o
The commercially available material (obtained from Fluka and Acros) was investigated by X-ray powder diffraction; a comparison of the experimental pattern with that calculated for both forms from single crystal data proves that it consists of form 1t exclusively (Fig. S1; all Fig. and Tables denoted “S” are to be found in the ESI‡). As noted above, only a few crystals of form 1o were available from one of the crystallization experiments. In this batch these crystals were embedded in large amount of a colorless, gelatinous residue, which also contained crystals of form 1t. Therefore, most of the following experiments were performed in the hope of accessing larger and if possible purer samples of form 1o. Because compound 1 is extremely hygroscopic, the material was pre-dried at 60 °C for all quantitative measurements.If form 1t is investigated by differential scanning calorimetry (DSC) at 1 °C min−1, an endothermic peak is observed at an onset temperature To of 88.9 °C, corresponding to the melting point of this form (Fig. 9). There is no indication of any polymorphic or other solid-to-solid transition before melting. On cooling, solidification is observed at To = 27.7 °C. The enthalpy for the crystallization in this DSC run is significantly lower that the heat of fusion in the first heating cycle, which indicates that some of the material has been transformed into an amorphous phase. If the solidified melt is reheated, the melting peak becomes broader and the heat of fusion is much lower than for the first heating. On cooling, strong supercooling is again observed.
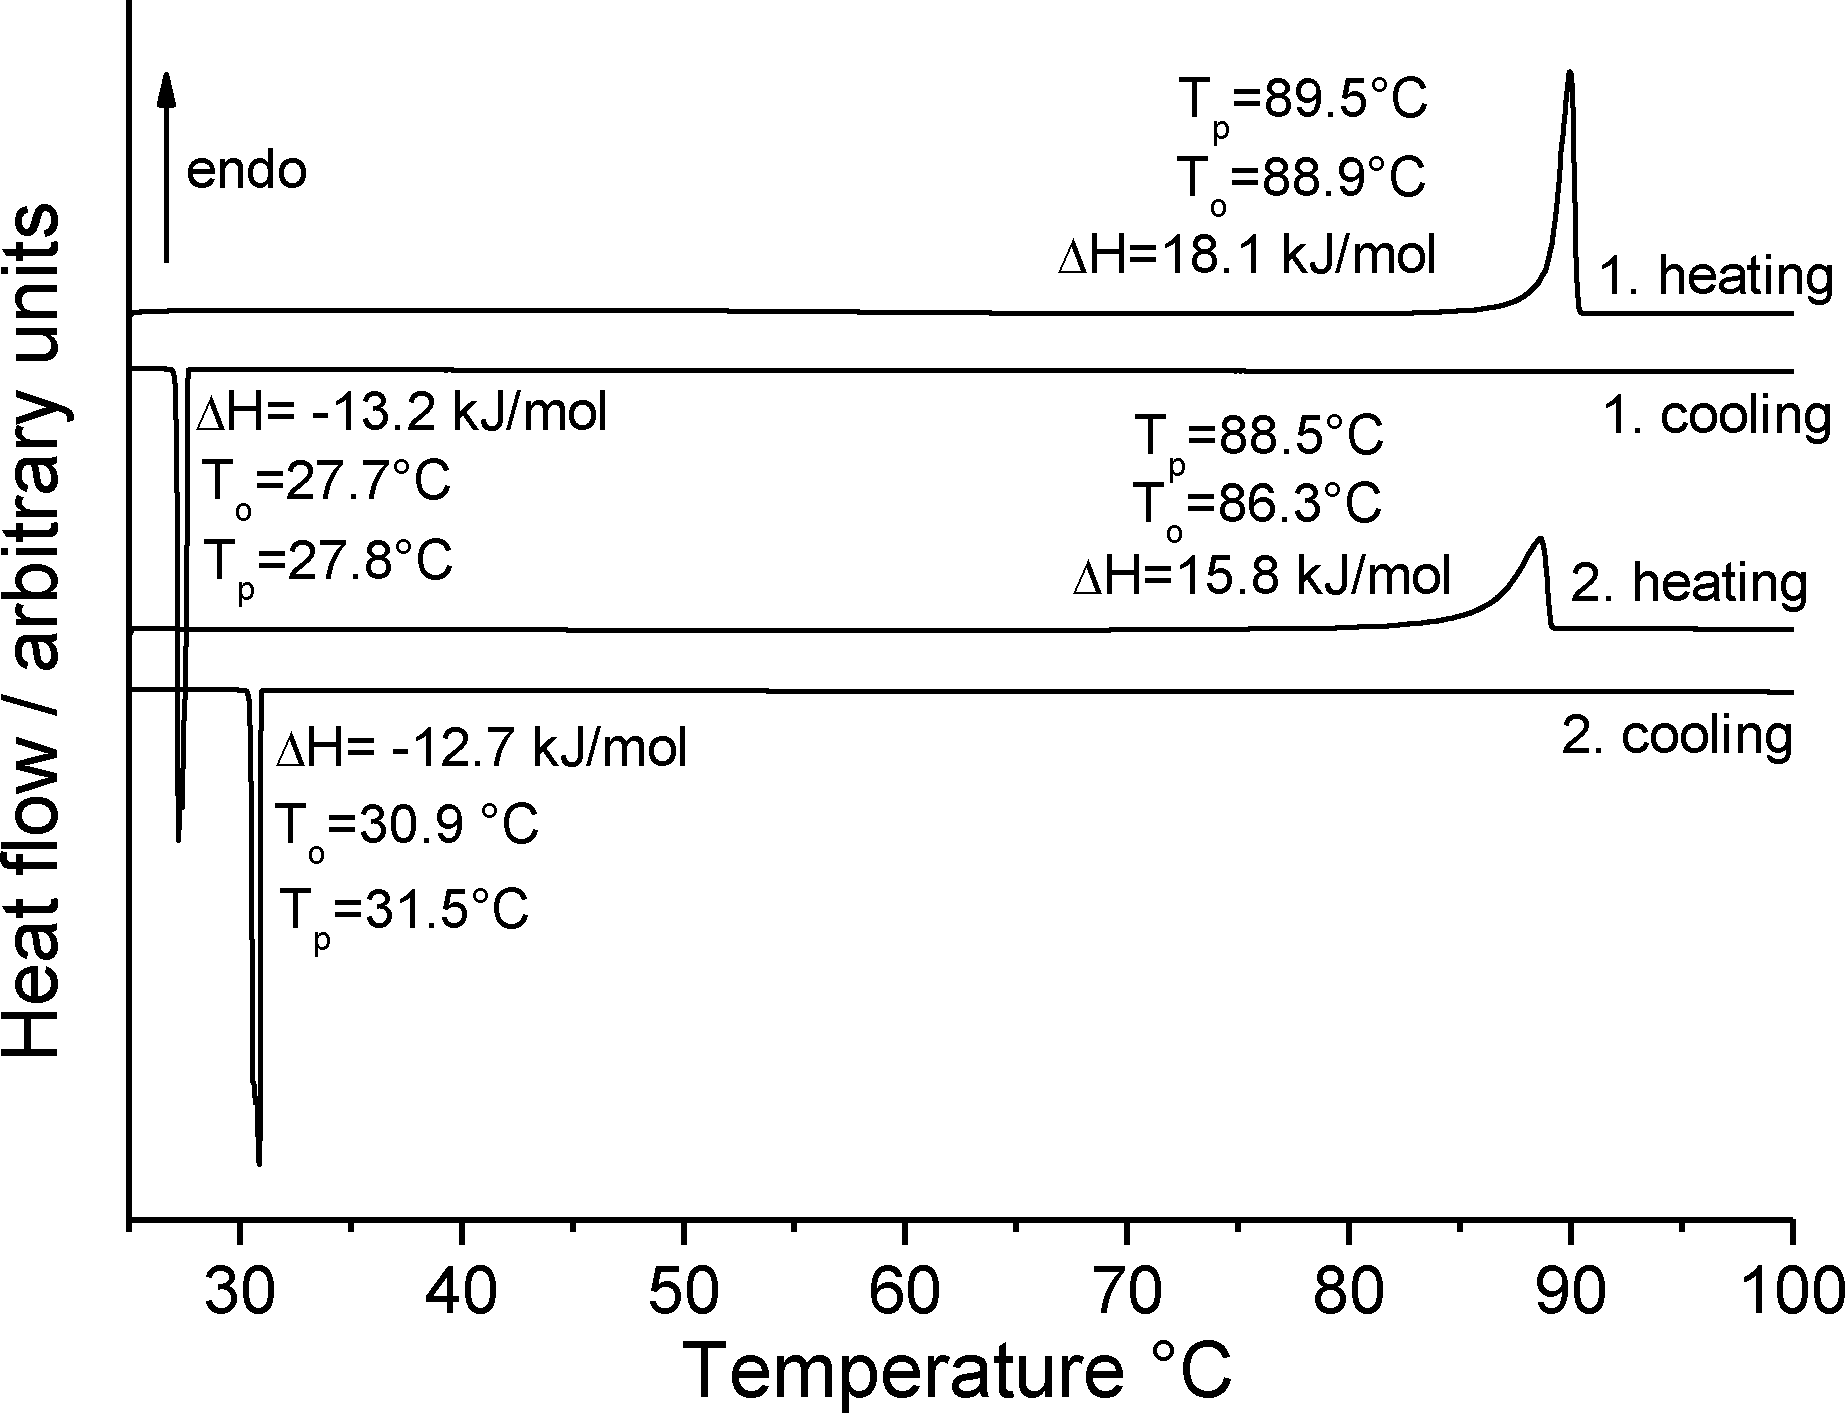 | ||
| Fig. 9 DSC heating and cooling curves for form 1t at 1 °C min−1; the peak (Tp) and onset (To) temperatures are given in °C and the enthalpy ΔH in kJ mol−1. | ||
If a similar measurement is performed at 3 °C min−1 a similar behavior is observed in the first heating cycle but on cooling, no crystallization takes place. If the solidified melt is heated and cooled again, no signals are detected in the DSC curve, which shows that no crystallization of the amorphous phase on cooling is observed (Fig. S2‡). To rule out decomposition during melting, the IR spectra of the pristine material and the amorphous residue obtained after cooling were compared but no differences were found (Fig. S3‡). Additional DSC runs at higher heating rates are similar and in all cases amorphous residues are obtained. The enthalpy of fusion was determined from 4 DSC runs at 10 °C min−1 to be 18.3 kJ mol−1 (Table S1‡).
In our studies of the polymorphism of trimethylthiourea,6 we found that an initially elusive second polymorph could be obtained reproducibly by solidification of the melt. In a further DSC run of 1 at 1 °C min−1, the crystalline residue as obtained after cooling the melt was investigated by X-ray powder diffraction, which proves that form 1t is obtained exclusively (Fig. 10). Surprisingly, this residue is of very good crystallinity and there are no indications of any amorphous content. Because no crystallization takes place at faster cooling rates, there is no chance to obtain form 1o or additional forms by kinetic control.
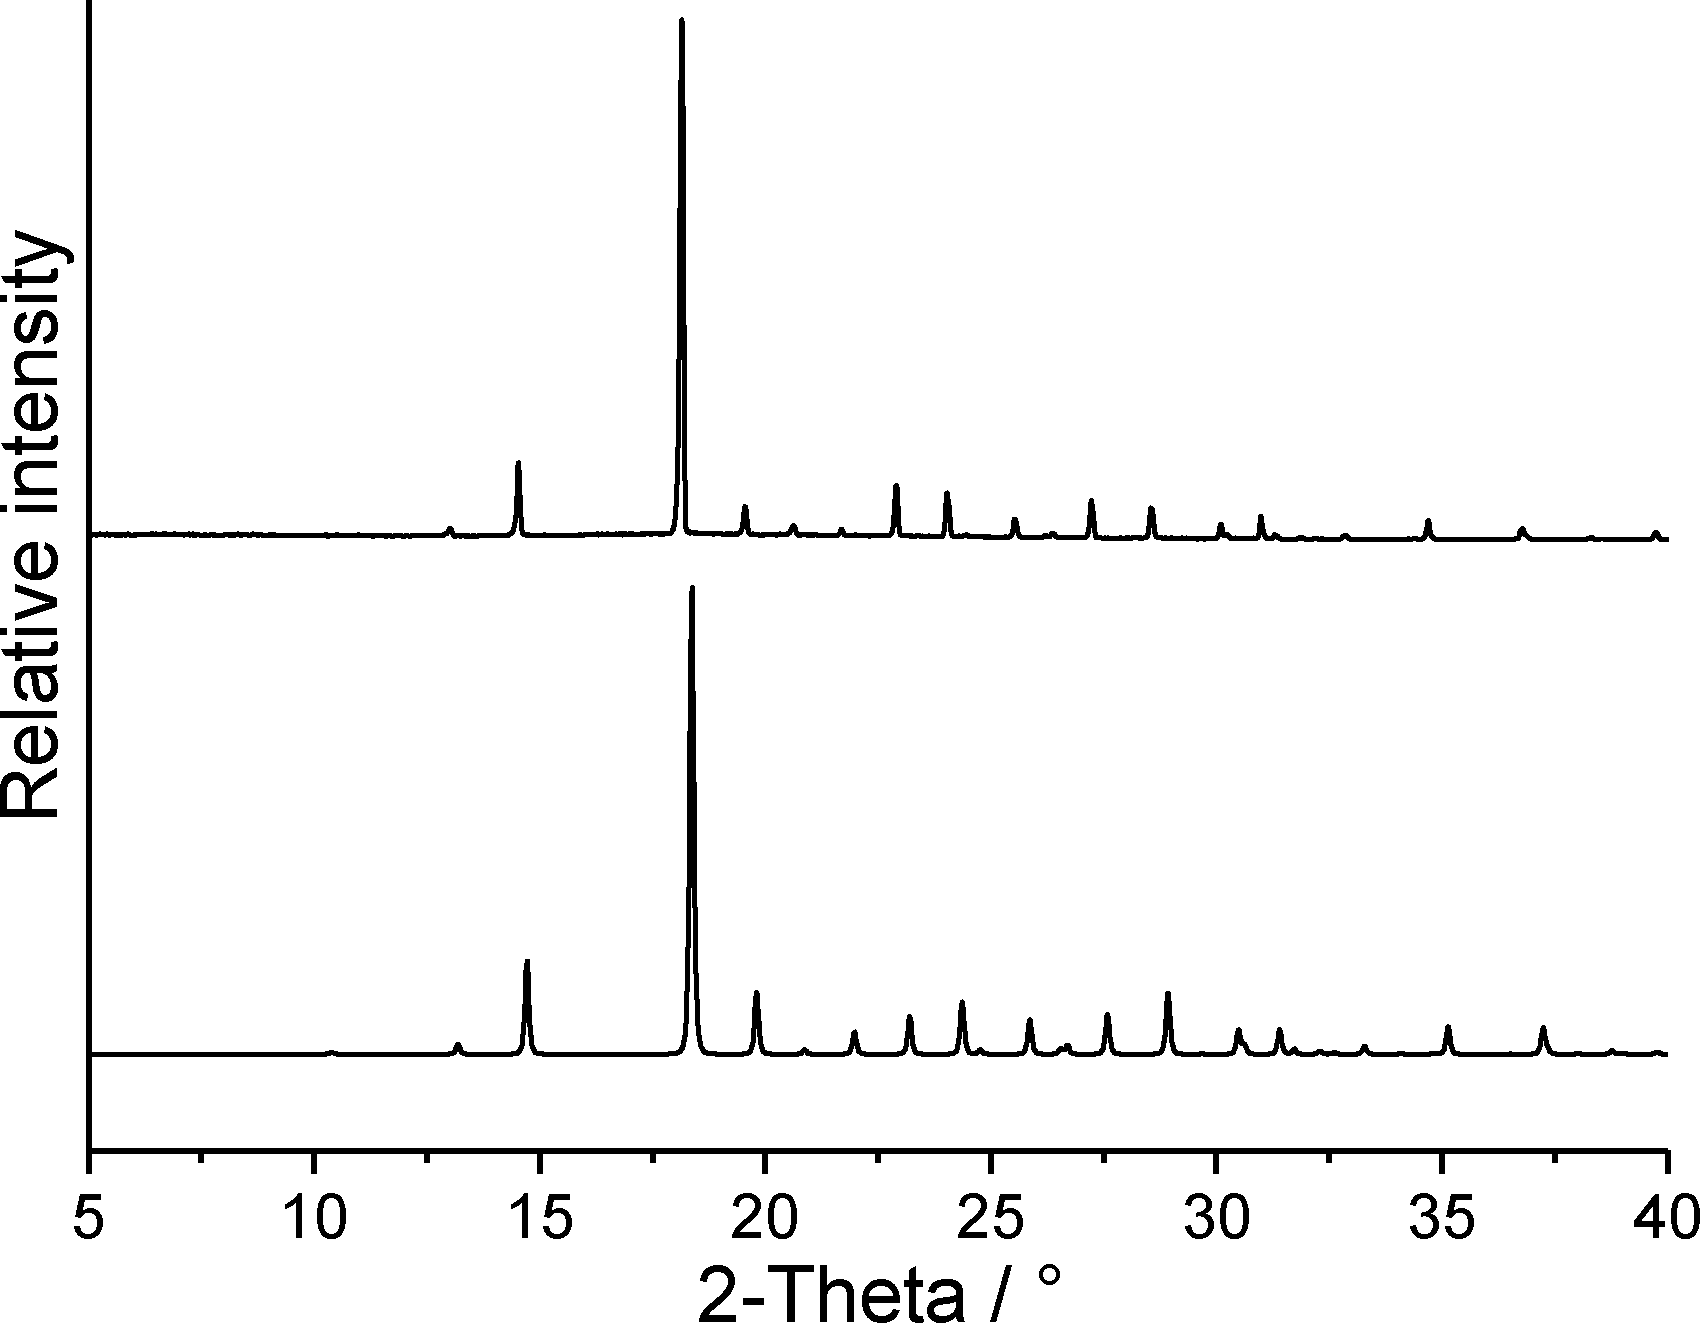 | ||
| Fig. 10 Experimental X-ray powder pattern of the solidified melt of form 1t (top) and calculated powder pattern for form 1t (bottom). | ||
Additional measurements on form 1t using simultaneous differential thermoanalysis and thermogravimetry show no significant mass loss before melting and thus, sublimation of some amount of this form can be excluded under these conditions (Fig. 11). There are also no indications for significant amounts of water in the original material. After melting, the complete sample vaporizes on heating to 300 °C.
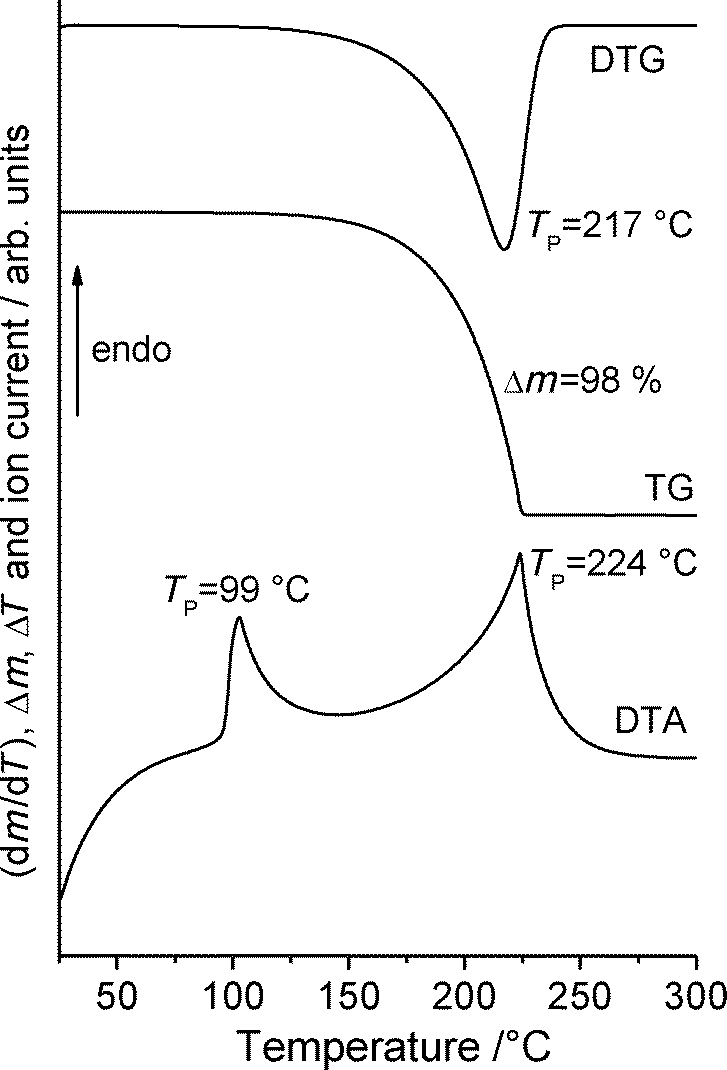 | ||
| Fig. 11 DTA, TG and DTG curve for form 1t at 4 °C min−1 in a nitrogen atmosphere. | ||
To test whether solvates are accessible that might transform into form 1o on solvent removal, a saturated solution of form 1t with an additional amount of solid was stirred in a number of solvents for one week and afterwards all residues were investigated by X-ray powder diffraction. In some solvents crystalline residues are difficult to obtain because always amorphous residues are formed. In several cases a large amount of 1 can be added to the solution because gelatinous systems are formed. In practically no solvents does any transformation take place and therefore, form 1t is always re-isolated (Fig. S4‡). Therefore, form 1t can be concluded to represent the thermodynamically stable form at room temperature. However, in 2-butanol a powder pattern is obtained that indicates the presence of an additional crystalline phase. If this residue is investigated by simultaneous differential thermoanalysis and thermogravimetry a mass loss of about 5.5% is observed before melting, indicating the presence of a solvate (Fig. S5‡). If the residue formed after solvent removal is investigated by XRPD, it is shown that modification 1t has formed exclusively (Fig. S6‡).
If form 1t is stirred in dichloromethane, a residue is formed that exhibits a powder pattern also different from that of 1t. Further analysis shows that this pattern is identical to that calculated for the hydrochloride 2 (Fig. 12). Curiously, only form 1t is obtained if the commercial compound is stirred in concentrated hydrochloric acid. This observation is difficult to understand but we have repeated these experiments several times with consistent results. If the hydrochloride is investigated by DTA-TG measurements, it starts to decompose at about 170 °C and on further heating a smooth decrease of the sample mass is observed (Fig. S7‡). There is no distinct step corresponding to the removal of HCl and therefore, there is no chance of obtaining a pure form of 1.
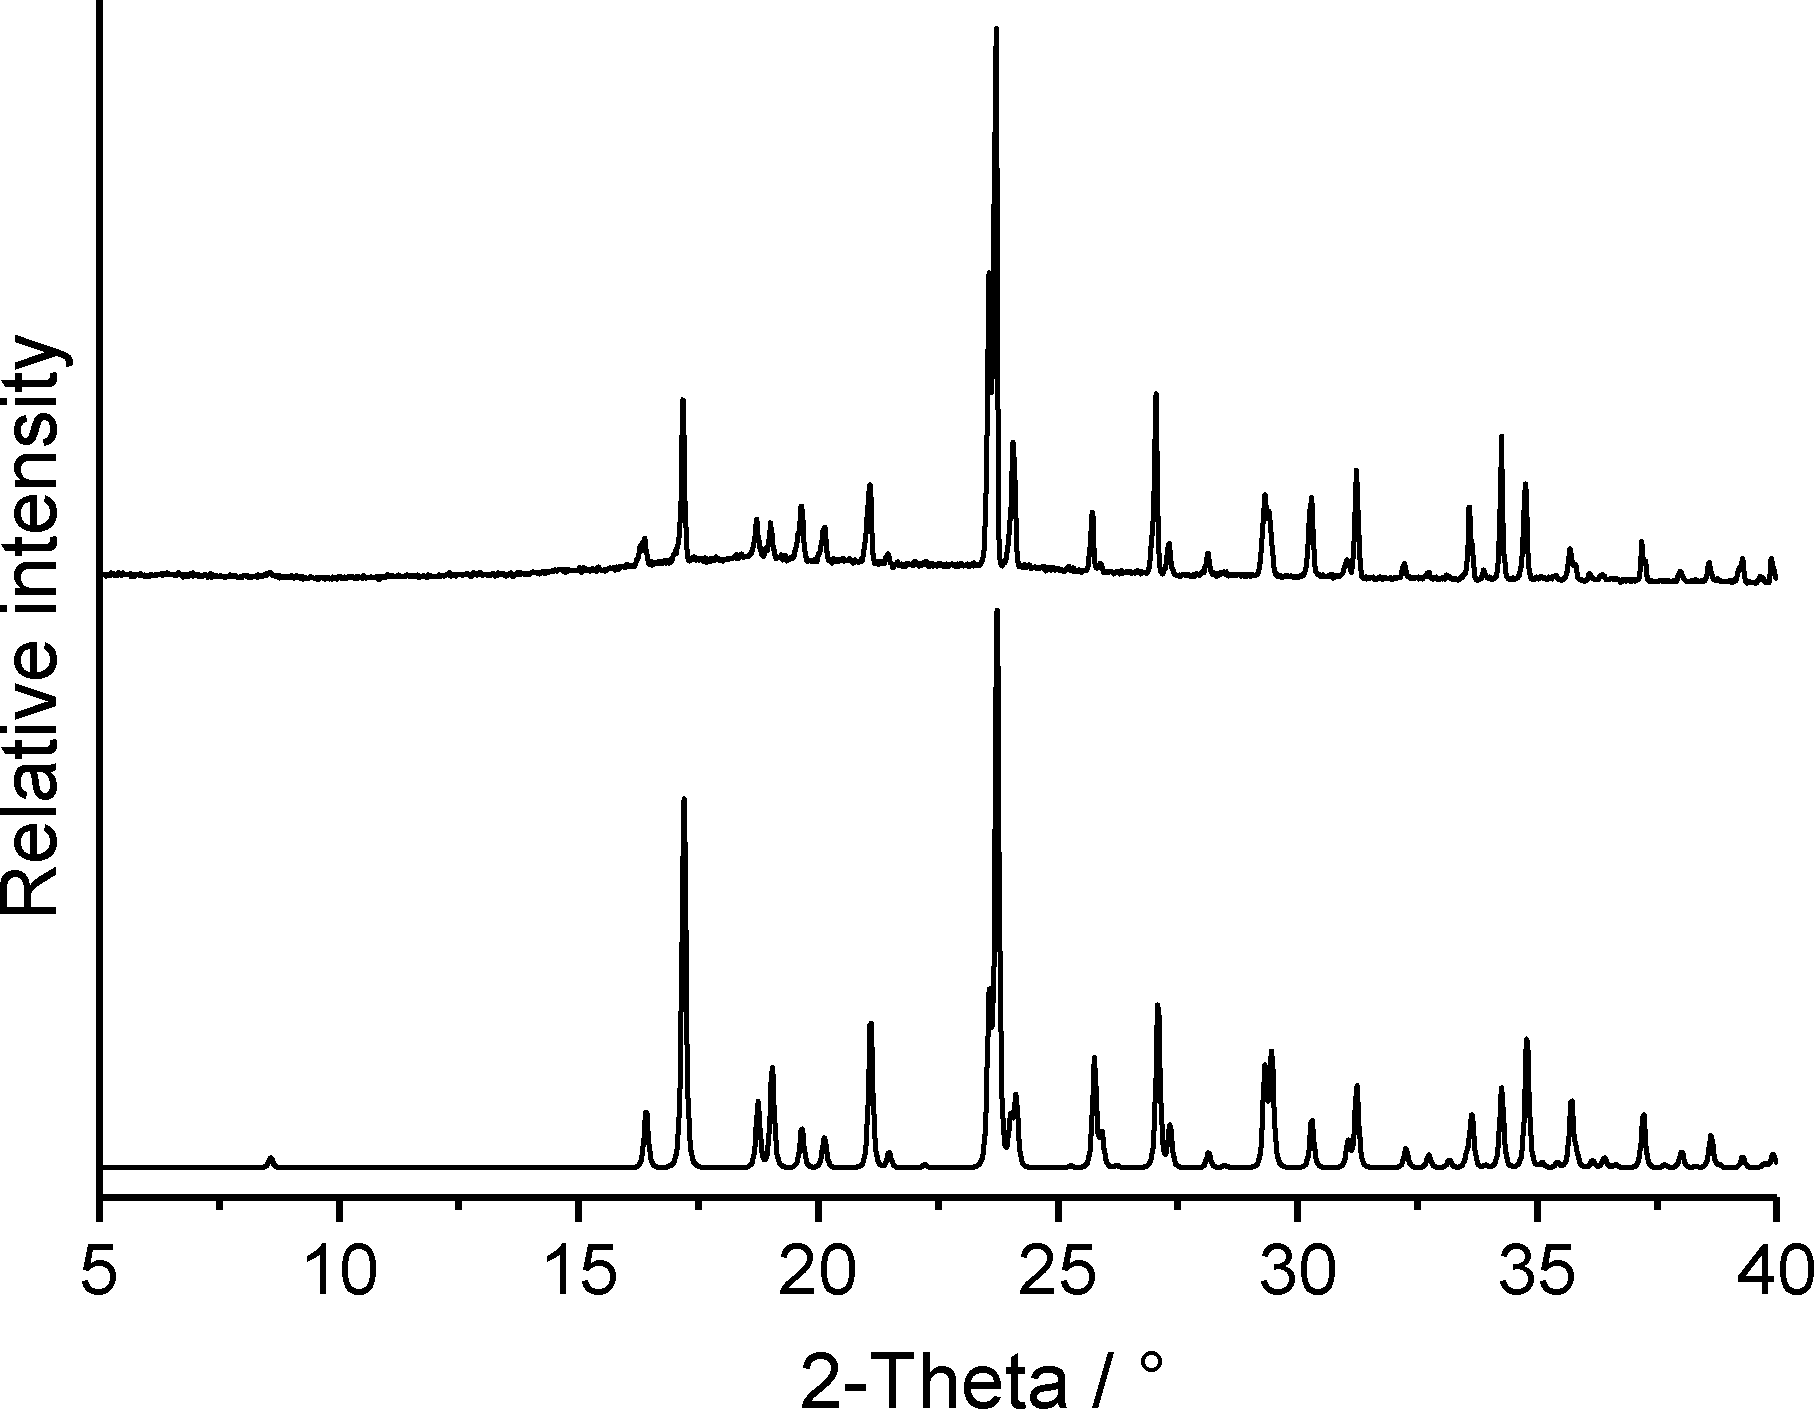 | ||
| Fig. 12 Experimental X-ray powder pattern of the residue obtained from dichloromethane (top) and calculated powder pattern for the hydrochloride 2 (bottom). | ||
Finally, we also performed several crystallization experiments under kinetic control, e.g. by rapid solvent removal, but in none of these experiments were even traces of form 1o obtained.
To obtain at least some information on the thermodynamic relation between 1t and 1o, we tried to measure a DSC curve of some crystals of form 1o, which were selected by hand from the batch consisting of both forms. Unfortunately, because of the low sample mass only a very noisy DSC curve was obtained, which consisted of a broad maximum at a temperature where melting is expected. From this experiment one cannot decide which of the two forms melts at the higher temperature. Moreover, because these crystals are always coated with the gelatinous residue associated with this batch, the exact sample mass was unknown and thus, no reliable values for the heat of fusion were obtained. Therefore, with the last crystals available of form 1o, two thermomicroscopic measurements were performed. Beforehand, the identity of these crystals was confirmed by single crystal structure analysis, and only afterwards were they prepared for the measurement.
On heating both forms at 1 °C min−1, the crystal of form 1t became continuously smaller and at about 86 °C it disappeared completely (Fig. S8‡). In contrast, the crystal of form 1o melted at about 89 °C, which is in the range observed for the melting of form 1t in the DSC experiments. This experiment indicates that form 1t sublimes under these conditions, which might be possible because a relatively low heating rate was used and, in contrast to the DSC measurements, the sample was not enclosed. The fact that the crystal of form 1o is still present after sublimation of form 1t does not mean that it is more stable, because it is embedded in the gelatinous residue.
To avoid sublimation, a second measurement was performed at 3 °C min−1. No sublimation was observed, and it is clear that form 1o melts at significantly lower temperatures than 1t (Fig. 13). This experiment proves that form 1t is also more stable up to the melting point. Moreover, because the density of form 1t (1.149 g cm−3) is significantly higher than that of 1o (1.138 g cm−3) it can also be assumed that form 1t is more stable at low temperatures.29 In this case it is highly likely that 1t is the thermodynamically stable form over the complete temperature range and that both forms are thus monotropically related.
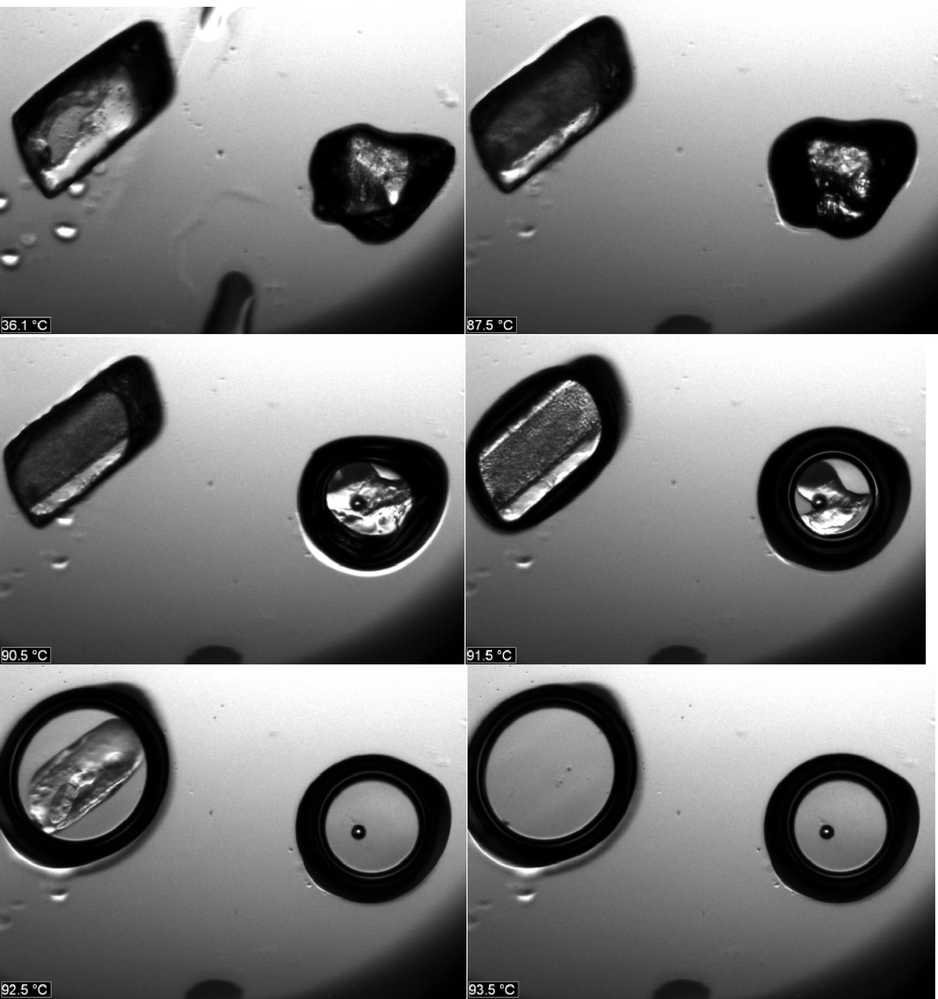 | ||
| Fig. 13 Microscopic images at various temperatures (36.1, 87.5, 90.5, 91.5, 92.5, 93.5 °C) obtained by thermomicroscopy with form 1t (crystal on left) and form 1o (crystal on right). | ||
Solution NMR studies of compound 1
We wished to find out whether the distinctive crystallographic features of forms 1o and 1t are in any way reflected in the solution 1H and 13C NMR spectra. Hence we undertook NMR experiments at low temperature in THF-d8 solution. As 1 is very hygroscopic, however, we were not able to obtain a sample free of water. Proton exchange between water and the amine and hydroxyl groups, as well as signal overlap with the water signal, considerably complicated the 1H NMR spectra, even at low temperature where exchange is slow. As already known, the conformer with an equatorial hydroxyl group dominates at room temperature, as can be straightforwardly deduced from the 1H NMR splitting patterns and coupling constants. Lowering the temperature decelerates ring inversion. Between −53 °C and −104 °C a second set of signals can be observed, corresponding to the conformer with an axial hydroxyl group, as expected. Lower temperatures that could have furnished more information about nitrogen inversion were unfortunately not accessible to us, irrespective of the solvent used. Within the temperature range studied (room temperature to −104 °C) no NMR-spectroscopic peculiarities were observed.Conclusions
Compound 1 presents an unusual case in which two different configurational isomers, axial or equatorial with respect to the NH group, are observed in the two crystalline forms 1t and 1o respectively, where the configurations are “frozen” in the solid state; the hydrogen bonding patterns are necessarily different. To assess the stereochemical relevance of this observation, we now return to the Joad principle as mentioned in the introduction; how exactly do we define the stereochemical terms involved?The standard definition states that conformational isomers (or conformers), in contrast to configurational isomers, differ only by rotations about single bonds and thus are readily interconvertible (and represent the same substance). One standard text on stereochemistry,30 however, reminds us that “the distinction between configuration and conformation is subtle and … not universally agreed upon” and takes the definition further: “Conformation can be changed by rapid rotation around single bonds (and in the definition of some, by rapid inversion at trigonal pyramidal centres)” (our italics). Following this principle, the two forms of molecule 1, although strictly speaking showing a configurational difference, are “only” conformers because they readily interconvert in solution, even at low temperature, by inversion at nitrogen. Thus the two crystalline forms certainly represent different polymorphs of 1, but it would be unsafe and probably misleading to describe them as “configurational polymorphs”. Indeed, this category of polymorphs can then never, by definition, exist; configurational isomers that do not readily interconvert are different compounds, whereas those with facile interconversion are redefined as conformers.
This is however a definition of convenience, and furthermore is incomplete; what exactly does “readily” or “facile” mean? How high must the energy barrier become before the conformers become separable configurational isomers and the polymorphs thus become different compounds, and at what temperature will the separation be possible? Is it even sensible to tie the definition to this energy value? The studies reported here underline the importance of these questions, but exact answers may not be possible and borderline cases will probably be discovered.
Acknowledgements
We thank Prof. Dr. Wolfgang Bensch for granting access to his powder diffractometer. Three referees assisted us by providing challenging and constructive criticism that enabled us to improve the manuscript significantly.Notes and references
- (a) D. Braga and F. Grepioni, Making Crystals by Design: Methods, Techniques and Applications, Wiley-VCH Verlag GmbH & Co. KGaA, Weinheim, 2007 Search PubMed; (b) R. Hilfiker, Polymorphism in the Pharmaceutical Industry, WILEY-VCH, 2006 Search PubMed; (c) W. C. McCrone, Polymorphism in Physics and Chemistry of the Organic Solid State, ed. D. Fox, M. M. Labes and A. Weissenberg, Interscience, New York, 1965, vol. II, pp. 725–767 Search PubMed; (d) G. R. Desiraju, Crystal Engineering, Mat. Sci. Monogr., Elsevier, Amsterdam, 1989 Search PubMed; (e) J. Bernstein, Polymorphism in Molecular Crystals, Clarendon Press, Oxford, 2002 Search PubMed; (f) J. Bernstein, R. Davey and O. Henck, Angew. Chem., Int. Ed., 1999, 38, 3440–3461 CrossRef; (g) G. Brittain, Polymorphism in Pharmaceutical Solids, Marcel Dekker Inc., New York, 1999, vol. 23 Search PubMed; (h) B. Moulton and M. J. Zaworotko, Chem. Rev., 2001, 101, 1629–1658 CrossRef CAS PubMed.
- C. Butterhof, T. Martin, P. Ector, D. Zahn, P. Niemietz, J. Senker, C. Näther and J. Breu, Cryst. Growth Des., 2013, 12, 5365–5372 CAS; J. Thun, L. Seyfarth, C. Butterhof, J. Senker, R. E. Dinnebier and J. Breu, Cryst. Growth Des., 2009, 9, 2435–2441 Search PubMed , and references therein.
- A. J. Cruz-Cabeza and J. Bernstein, Chem. Rev., 2014, 114, 2170–2191 CrossRef CAS PubMed.
- e.g. ref. 1b, p. 22.
- R. K. R. Jetti, R. Boese, J. A. R. P. Sarma, L. S. Reddy, P. Vishweshwar and G. R. Desiraju, Angew. Chem., 2003, 115, 2008–2012 CrossRef CAS; R. K. R. Jetti, R. Boese, J. A. R. P. Sarma, L. S. Reddy, P. Vishweshwar and G. R. Desiraju, Angew. Chem., Int. Ed., 2003, 42, 1963–1967 CrossRef PubMed.
- C. Näther, I. Jess, P. G. Jones, C. Taouss and N. Teschmit, Cryst. Growth Des., 2013, 13, 1676–1684 Search PubMed.
- C. Näther, C. Döring, I. Jess, P. G. Jones and C. Taouss, Acta Crystallogr., Sect. B: Struct. Sci., Cryst. Eng. Mater., 2013, 69, 70–76 Search PubMed.
- C. Taouss and P. G. Jones, CrystEngComm, 2014, 16, 5695–5704 RSC.
- e.g. C. Döring and P. G. Jones, Z. Naturforsch., B: J. Chem. Sci., 2013, 68, 474–492 CrossRef; C. Döring and P. G. Jones, Z. Naturforsch., B: J. Chem. Sci., 2014, 69, 1315–1320 CrossRef.
- e.g. P. G. Jones, C. Taouss, N. Teschmit and L. Thomas, Acta Crystallogr., Sect. B: Struct. Sci., Cryst. Eng. Mater., 2013, 69, 405–413 Search PubMed; C. Taouss, L. Thomas and P. G. Jones, CrystEngComm, 2013, 15, 6829–6836 RSC.
- H. Booth and D. V. Griffiths, J. Chem. Soc., Perkin Trans. 2, 1973, 842–844 RSC.
- H. Booth and J. R. Everett, J. Chem. Soc., Chem. Commun., 1979, 34–35 RSC.
- J. M. Bailey, H. Booth, H. A. R. Y. Al-Shirayda and M. L. Trimble, J. Chem. Soc., Perkin Trans. 2, 1984, 737–743 RSC.
- E. L. Eliel, D. Kandasamy, C. Yen and K. D. Hargrave, J. Am. Chem. Soc., 1980, 102, 3698–3707 CrossRef CAS.
- (a) J. B. Lambert, R. G. Keske, R. E. Carhart and A. P. Jovanovich, J. Am. Chem. Soc., 1967, 89, 3761–3767 CrossRef CAS; (b) Calculation in ref. 17.
- I. D. Blackburne, A. R. Katritzky and Y. Takeuchi, Acc. Chem. Res., 1975, 6, 300–306 CrossRef.
- F. A. L. Anet and I. Yavari, J. Am. Chem. Soc., 1977, 99, 2794–2796 CrossRef CAS.
- (a) R. J. Abraham and C. J. Medforth, J. Chem. Soc., Chem. Commun., 1987, 1637–1638 RSC; (b) R. J. Abraham and C. J. Medforth, Magn. Reson. Chem., 1988, 26, 334–344 CrossRef CAS.
- Y. Terui and K. Tori, J. Chem. Soc., Perkin Trans. 2, 1975, 127–133 RSC.
- R. J. Abraham, C. J. Medforth and P. E. Smith, J. Comput.-Aided Mol. Des., 1991, 5, 205–212 CrossRef CAS.
- J. D. Dunitz and J. Bernstein, Acc. Chem. Res., 1995, 28, 193–200 CrossRef CAS.
- M. Freytag and P. G. Jones, Acta Crystallogr., Sect. C: Cryst. Struct. Commun., 1999, 55, 1874–1877 Search PubMed.
- Agilent, CrysAlis PRO, Agilent Ltd., Yarnton, England, 2014 Search PubMed.
- (a) G. M. Sheldrick, Acta Crystallogr., Sect. A: Found. Crystallogr., 2008, 64, 112–122 CrossRef CAS PubMed; (b) SHELXL-1997, a Program for refining Crystal Structures, G. M. Sheldrick, University of Göttingen, Germany, 1997 Search PubMed.
- Siemens XP, version 5.03, Siemens Analytical X–Ray Instruments, Madison, Wisconsin, U.S.A, 1994 Search PubMed.
- Bruker AM Series User Manual, Bruker Analytische Messtechnik, Rheinstetten, Germany, 1987 Search PubMed.
- CCDC Version 5.35; F. H. Allen, Acta Crystallogr., Sect. B: Struct. Sci., 2002, 58, 380–388 CrossRef PubMed.
- CCDC refcodes ICANIK, JARCOV, JARCUB, LIPXOX and POWZAD. We believe that the NH hydrogen position of POWZAD may be in error, and it was not considered in our discussion.
- (a) A. I. Kitaigorodski, Organic Chemical Crystallography, Consultants Bureau, New York, U.S.A., 1961 Search PubMed; (b) A. Burger and R. Ramberger, Mikrochim. Acta, Suppl., 1979, 2, 259–271 CrossRef CAS.
- E. L. Eliel and S. H. Wilen, Stereochemistry of Organic Compounds, Wiley-Interscience, 1994, see in particular pp. 18 and 1195 Search PubMed.
Footnotes |
| † This paper is dedicated to the memory of Dr. Frank Allen, a much respected colleague and friend. |
| ‡ Electronic supplementary information (ESI) available: Further supplementary material to this paper includes packing diagrams for structures 2 and 3 and additional figures from the physico-chemical investigations of 1. CCDC 1037209 (1t), 1037210 (1o), 1037211 (2), 1037212 (3), 1037213 (4) contain the supplementary crystallographic data for this paper. For ESI and crystallographic data in CIF or other electronic format see DOI: 10.1039/c4ce02477j |
| This journal is © The Royal Society of Chemistry 2015 |