
 Open Access Article
 This Open Access Article is licensed under a
 Creative Commons Attribution 3.0 Unported Licence
Influence of alkali metal cations on the formation of zeolites under hydrothermal conditions with no organic structure directing agents
Antony
Nearchou
and
Asel
Sartbaeva
*
Department of Chemistry, University of Bath, Claverton Down, Bath, BA2 7AY, UK. E-mail: a.sartbaeva@bath.ac.uk
First published on 17th February 2015
Abstract
Alkali metal cations play an important role in directing formation of zeolite frameworks in the absence of organic structure directing agents. The interplay between Na and Cs cations in directing formation of zeolite RHO is the main focus of this study. Depending on the ratio of Na and Cs in the precursor gel, with no organic structure directing agents, several different zeolites form during synthesis. This indicates that pure zeolite RHO can only be obtained at a very specific Cs to Na ratio. More generally, this may shed light on the bigger question of how zeolite pores form in the absence of organic structure directing agents.
Introduction
Zeolites are crystalline aluminosilicates with microporous structure. Due to internal porosity and the existence of strong catalytic sites they can be used as molecular sieves, solid state catalysts, ion-exchangers, adsorbents, gas separators, sensors and more.1–6 The framework structure of zeolites consists of oxygen sharing tetrahedra of silica and alumina arranged into secondary building units (SBU). These form highly crystalline three dimensional channels and cages.6 The presence of tetra-coordinated aluminium atoms in the zeolite framework makes a net anionic charge, requiring the presence of cations within the structure for charge neutrality. Most commonly these are monovalent alkali metal cations such as sodium and potassium.Alkali metal cations have been shown to dominate the aluminosilicate gel chemistry in the hydrothermal synthesis of zeolites. The smaller alkali metal cations show structure forming properties, whereas the larger cations show structure breaking properties, based on the strength of their hydration spheres. It is commonly seen that the presence of larger structure breaking cations retards the crystallisation process. Meise et al.7 reported that for zeolite A (LTA) the inclusion of larger cations impeded the nucleation step and the use of smaller cations reduced the crystallisation time. However, work by Burkett et al., showed that alongside sodium, addition of larger secondary cations favoured the formation of different zeolite frameworks such as CHA and OFF, rather than impeding crystallisation as a process altogether.8 Here, we investigate further this relationship between the size of cations and formation of zeolites during hydrothermal synthesis, using as an example the formation of zeolite RHO, where it was shown previously that the presence of Cs cations is a necessary criterion for formation of this zeolite.11–17
Zeolite RHO is a synthetic zeolite. The RHO framework is related to faujasite and Linde Type A zeolites (Fig. 1).9 It consists of LTA cages and D8R secondary building units. Amongst zeolites, RHO is known for having a flexible and collapsible framework,10 allowing the accommodation of different sized cations and adsorbents, while still maintaining a degree of selectivity. The Si/Al ratio of the RHO framework has been reported as 3 by Chatelain et al.11 and 3.5 by Araki et al.12 Both of these methods involved the use of 18-crown-6 ether as an organic template for the RHO framework.
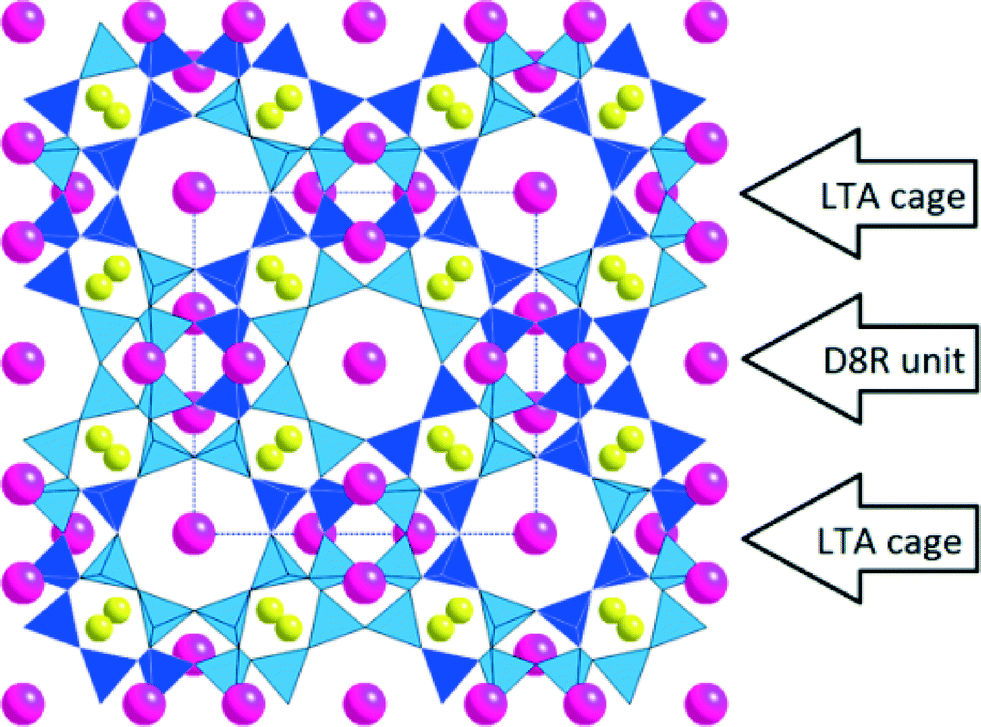 | ||
| Fig. 1 Zeolite RHO, Si and Al tetrahedral units are represented by blue and light blue tetrahedra, Cs atoms are in pink and Na atoms are yellow. LTA and D8R secondary building units are labelled. In this representation, there are 8 LTA cages in each corner and one in the middle, and 8 D8R units connecting the corner LTA units. | ||
For the synthesis of zeolite RHO, the use of caesium cations has been shown to be integral to formation of the RHO framework.11–17 The exact mechanism by which the cation promotes the formation of the framework has not been directly explained, however it is believed that it is the cation's size which directs the formation of a more open structure. A general mechanism of the crystallisation of zeolite RHO has been described by Araki et al.12 using 18-crown-6 ether as organic template, but it does not explain the role of the caesium cation. It is known that the caesium cation plays a part in templating the double 8 ring (D8R) channels between α-cages in the framework.13 Robson et al.14 established that a mixture of sodium and caesium cations in the precursor gel is necessary to crystallise the zeolite RHO. This work by Robson et al. was conducted without 18-crown-6 ether, showing the structure directing properties of the cations alone. A low concentration of caesium cations in the gel was shown to co-crystallise faujasite (FAU) framework zeolites, and a high concentration promoted the co-crystallisation of chabazite (CHA) and analcime (ANA) zeolites. It is known that caesium cations also favour ANA framework zeolites, as shown by Vaughan and Strohmaier18 Hydrothermal treatment with higher temperatures and longer crystallization periods have also been shown to promote the formation of ANA framework zeolites.13 This is understood with Ostwald's rule of successive transformations, whereby hydrothermal conditions and formulations initially produce kinetically stable products such as zeolite RHO before transforming to more thermodynamically stable ones such as analcime.18
In this work, we aim to further investigate the influence of the caesium cation content of the precursor aluminosilicate gel on the zeolite structures crystallized using hydrothermal treatment with no organic templates. More specifically, we intend to see the ideal caesium content which will produce the most pure RHO zeolite, with the least degree of co-crystallisation. This should give a more coherent understanding as to how caesium and sodium cations impact the crystallisation process. We prepared samples using varying caesium cation contents under identical hydrothermal treatment. We also prepared samples with 18-crown-6 ether for comparison. We then analysed the sample's identity using powder X-ray diffraction (PXRD), followed by field emission scanning electron microscopy (FE-SEM) as well as magic-angle spinning, solid state nuclear magnetic resonance spectroscopy (SS NMR).
1. Experimental
1.1 Materials
Sodium aluminate (NaAlO2) as a source of alumina, colloidal silica (LUDOX® HS-40, 40 wt% SiO2 suspension in water) as a source of silica, sodium hydroxide (NaOH) as base and cation source, aqueous caesium hydroxide (CsOH, 50 wt% solution in water), and distilled water were used for preparing samples. The materials used were purchased from Sigma-Aldrich.1.2 Synthesis method
We prepared the zeolite samples using a hydrothermal method, as reported by Chatelain et al.11 In the absence of caesium, the reagent molar ratio was 1Al2O3/1.86NaOH/9.60SiO2/92.00H2O. The method described by Chatelain et al. included the addition of 18-crown-6 ether as organic template, however we did not use template to prepare our samples. The precursor Si/Al ratio before hydrothermal treatment in all samples was constant at 4.8. Addition of caesium hydroxide to the precursor gel required molar substitution with sodium hydroxide, ensuring that the sum of moles of caesium hydroxide and sodium hydroxide is the same in all samples. The degree of substitution, or caesium cation content (Cs%) was calculated using equation:| Cs% = CsOH(mol)/CsOH(mol) + NaOH(mol) | (1) |
The precursor was prepared by first dissolving the sodium hydroxide and caesium hydroxide solution in distilled water under magnetic stirring. The sodium aluminate was added and the solution stirred until the sodium aluminate was homogenously mixed. The colloidal silica was then added slowly, forming the precursor gel which was left to stir for approximately 24 hours at room temperature. The gel was then transferred to a tightly sealed 125 ml Teflon Jar (Naglene) and left in a 100 °C oven for 7 days to crystallise under hydrothermal conditions. Post-treatment, the crystallised material was separated using vacuum filtration, and washed with distilled water until of neutral pH. The sample was then dried in a 100 °C oven overnight, followed by grinding, weighing and characterization. Resulting samples were in a white powder form.
1.3 Characterisation
Powder X-ray diffraction patterns were obtained using a BRUKER D8-Advance X-ray powder diffractometer with a Cu Kα (λ = 1.5418 Å) X-ray radiation source. Estimation of the crystallinity and abundance of zeolite RHO, zeolite Na–X and analcime were performed using the peaks at 2θ: 25.14°, 6.12° and 25.96° respectively. Low resolution micrographs were taken using a JEOL SEM6480LV scanning electron microscope with back scattering electrons (BSE). EDX data was acquired using an Oxford INCA X-ray analyser attached to the microscope. High resolution micrographs were taken using the JEOL FESEM6301F field emission scanning electron microscope at the University of Bath. Magic-angle spinning SS NMR spectra on the 29Si, 27Al and 133Cs nuclei were obtaining using the EPSRC-sponsored Solid State NMR service run at Durham University using a Varian VNMRS 400 spectrometer. The Si/Al ratios of zeolite samples were calculated using equation: | (2) |
Here, n is the number of adjacent aluminium atoms and I is the relative integral intensity of each environment peak (Q0–Q4) after deconvolution.
2. Results and discussion
Here we present results for seven samples, all prepared using hydrothermal methods. Six samples were made with no structure directing agents, one – with 18-crown-6 ether.2.1 PXRD data
Table 1 lists the samples run, with varying caesium cation content from 0% to 25%, in addition to the sample framework identities from PXRD. The XRD patterns of the samples are shown in Fig. 2. As can be seen, there is a transition of the zeolite crystallised upon increasing the caesium content of the precursor gel. At low concentrations of caesium, 5% and lower, the only zeolite observed using PXRD was zeolite Na–X, which has a FAU framework. Moving from 0% to 5% caesium content, it can clearly be seen that peak intensities decrease, suggesting that the zeolite Na–X product is less crystalline. We propose that this is most likely due to the large caesium cations perturbing the FAU framework, which forms preferentially in sodium cation rich environments, not caesium.| Sample | Cs% | Hydrothermal conditions | PXRD results | |
|---|---|---|---|---|
| Time/days | Temperature/°C | |||
| 1 | 0 | 8 | 100 | FAU |
| 2 | 5 | 8 | 100 | FAU |
| 3 | 10 | 8 | 100 | RHO/FAU |
| 4 | 15 | 8 | 100 | RHO/(FAU) |
| 5 | 20 | 8 | 100 | RHO/(GIS) |
| 6 | 25 | 8 | 100 | RHO/ANA |
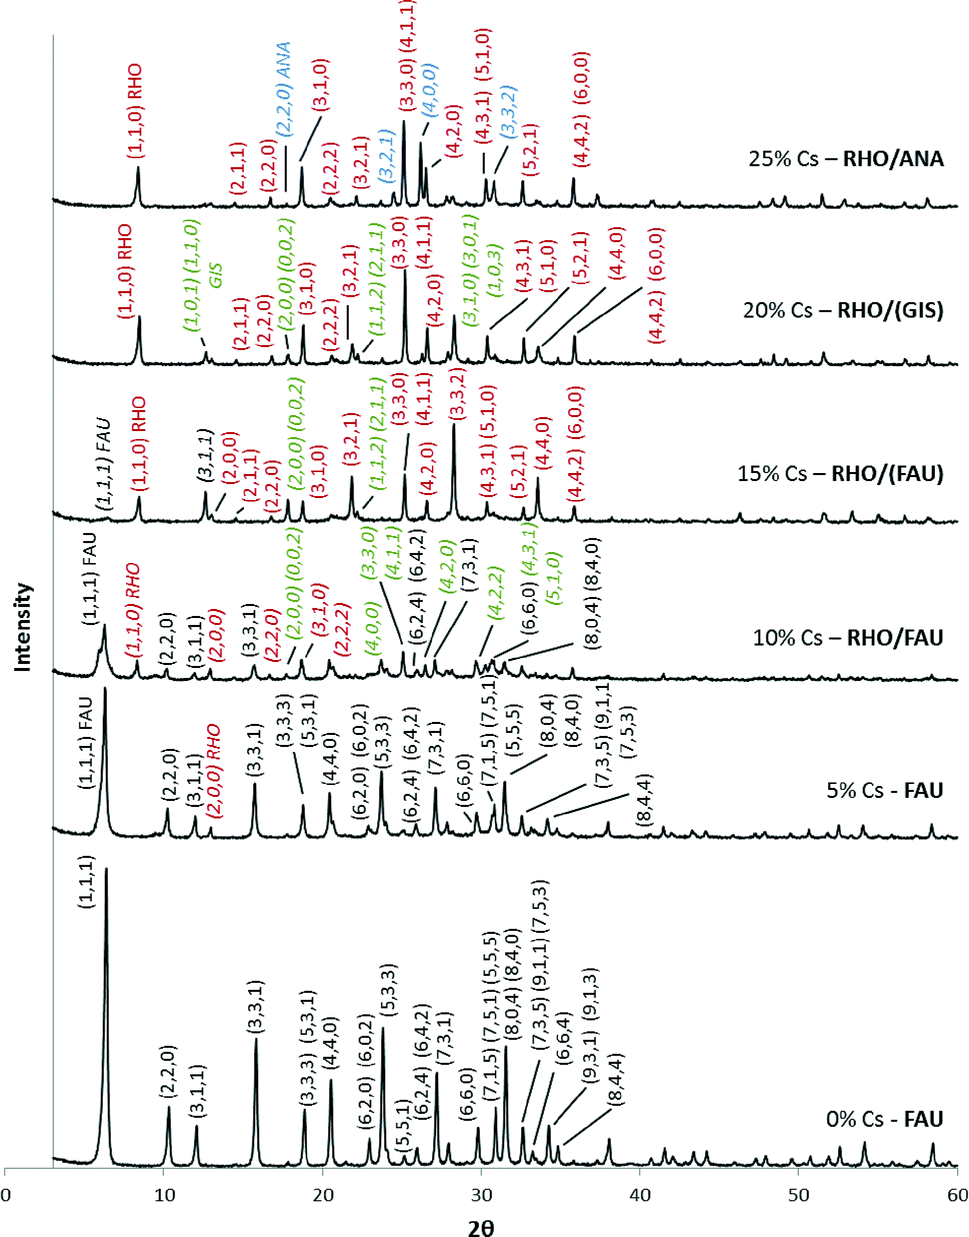 | ||
| Fig. 2 PXRD spectra for samples 1–6. The (h, k, l) labels are shown in different colours to indicate the peaks assigned to the different zeolites present. | ||
The zeolite RHO begins to appear at 10% caesium cation content. At this point there appears to be a superposition of both zeolite RHO and Na–X in the XRD pattern. The intensity of zeolite Na–X peaks is greater than the intensity of zeolite RHO peaks, suggesting that the Na–X component of the sample is more crystalline. At 15% caesium cation content both zeolites are present, however, based on peak intensity, zeolite RHO appears to be much more crystalline and abundant, while the Na–X component is present as an impurity. With a 20% caesium content sample, the zeolite RHO is still present in the majority; however in this case there is a small impurity of zeolite Na–P1 (GIS framework). It is this sample which we have deemed as being the most pure zeolite RHO, as it contains the least degree of cocrystallisation of other zeolites. At 25% caesium content the zeolite RHO is still present; however the appearance of the more thermodynamically stable state is apparent, zeolite analcime (ANA). As mentioned previously, this is explained by the strong preference of the caesium cations to promote ANA frameworks in a caesium rich gel.13
The schematic phase diagram in Fig. 3 is an approximation of the abundance of each zeolite in the crystallized material. The diagram was constructed making the following assumptions. First, the peak in the PXRD pattern that has been reported in literature19 to have 100% intensity for a zeolite is relatively representative of how much of that zeolite is present. The second assumption is that only zeolite Na–X and zeolite RHO are present. All impurities such as zeolite Na–P1 and zeolite analcime are ignored. The diagram is read by going up from the required caesium content to where the boundary line is reached. For example, at 10% caesium content the boundary is at 65%, meaning the composition is 65% zeolite Na–X and 35% zeolite RHO. The dotted line represents an approximation from data at 10 and 15%.
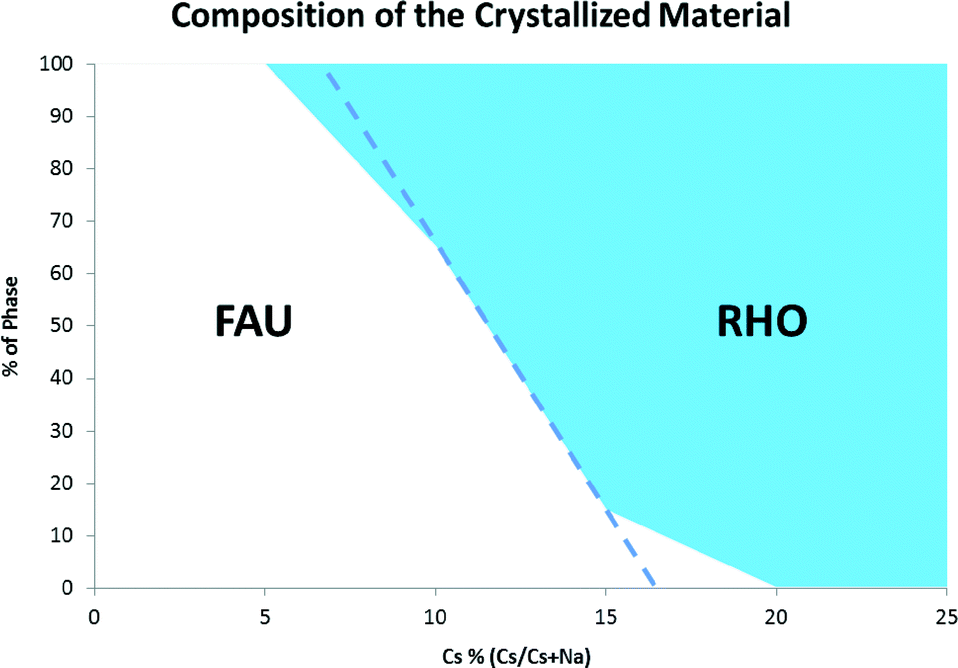 | ||
| Fig. 3 A schematic phase diagram showing the estimated % of each zeolite (zeolites RHO and Na–X (FAU)) at different cation contents. | ||
2.2 SEM data
An FE SEM micrograph of a zeolite RHO sample synthesised by hydrothermal methods using 18-crown-6 ether as an organic template is shown in Fig. 4. The image shows that the particles have a specific polyhedral geometry. This has been described by Mousavi et al.15 and is known as a rhombic dodecahedron geometry. | ||
| Fig. 4 An SEM image of a zeolite RHO sample synthesised using 18-crown-6 ether as organic template. Although some crystals are not smooth, the overall rhombic dodecahedral geometry can be seen. Scale bar is equal to 1 micrometer. | ||
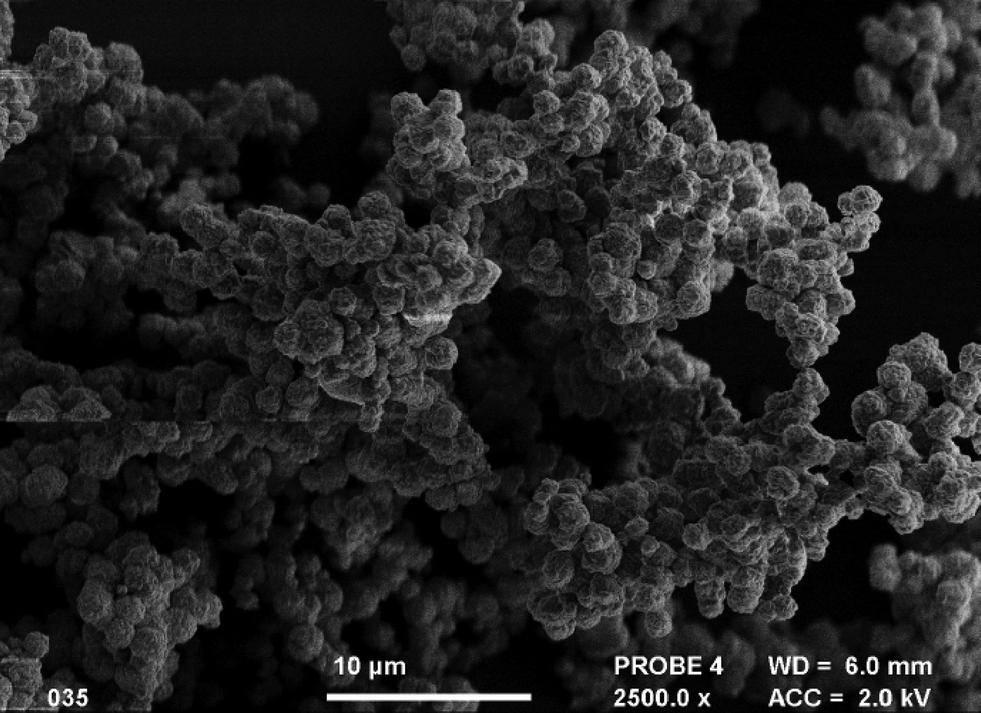
Representative FE SEM micrographs for the samples without organic template are shown in Fig. 5 and 6. Fig. 5, showing a micrograph of the 0% caesium, zeolite Na–X sample shows uniform particle morphology and an average size of 1.57 μm. The particles themselves appear as almost spherical aggregates, typical of zeolite Na–X. With the addition of caesium to 5% content, we noticed that the morphology drastically changed, as shown in Fig. 6(a). Two different particle species are present. The smaller spherical aggregates appear just as the zeolite Na–X particles did in the 0% caesium sample, so it was believed that these were the zeolite Na–X seen in the PXRD. Larger particles with a more angular and striated morphology are also present. The average size of the two particle species were 1.59 μm and 5.59 μm. Using back-scattered electrons, it was seen that these larger particles have a greater average atomic mass, suggesting that the caesium is present in these species. We propose that these larger particles are the precursors to the zeolite RHO forming. This contrasts with the rhombic dodecahedron geometry that has been seen with zeolite RHO synthesised with organic template.
 | ||
| Fig. 5 SEM micrographs for sample 1, 0% of Cs, where faujasite zeolite can be seen. The scale bar is 10 micrometres. | ||
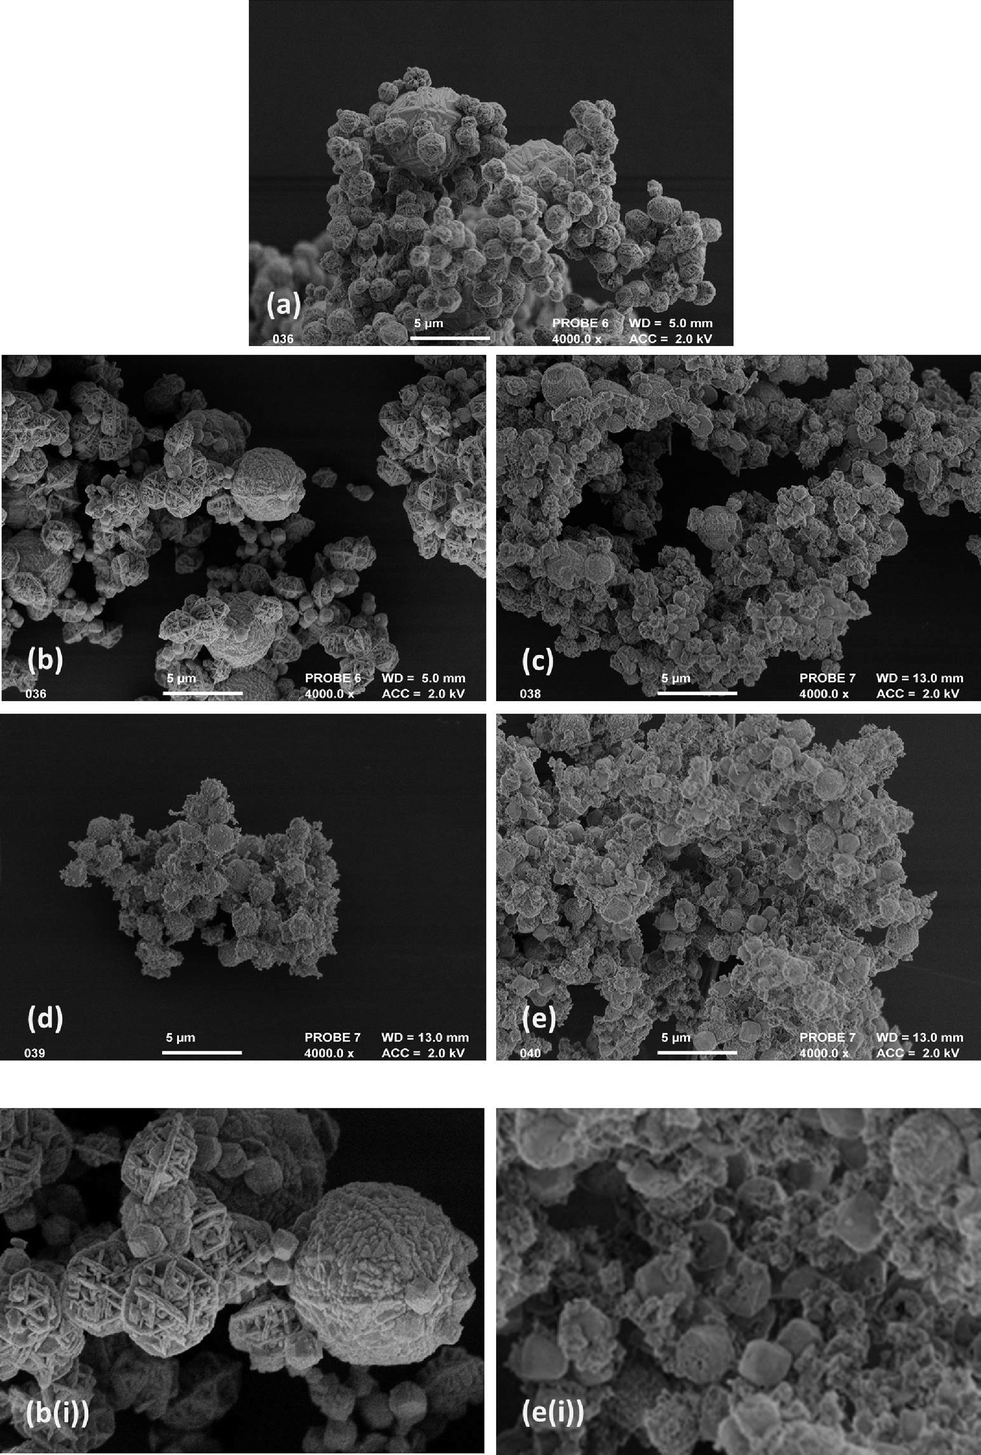 | ||
| Fig. 6 SEM micrographs for samples 2–6: a) 5% of Cs, faujasite zeolite; b) 10% of Cs, a mixture of RHO and faujasite zeolites; c) 15% of Cs, mainly zeolite RHO, with faujasite impurity; d) 20% of Cs, predominantly zeolite RHO; e) 25% of Cs, mainly zeolite RHO with analcime impurity. The scale bar is 5 micrometres. Figures b(i) and e(i) are to scale zoomed in micrographs of figures b and e respectively. There is a clear distinction of morphology in these micrographs. | ||
Increasing the caesium content further to 10% and 15%, it can be seen in micrographs 6(b) and 6(c) that the larger particle species are more common. At 10% the average particles sizes are 4.71 μm and 2.21 μm, and at 15% the sizes are 2.58 μm and 1.2 μm. This shows the decrease in the size of the larger caesium rich particles upon addition of caesium. We believe that at these higher caesium contents, more zeolite RHO nuclei are capable of growing, meaning that competition of growth between nuclei restricts the particle size available. It is worth noting that in these samples a third particle species can be seen. In the 10% sample small polyhedral particles are present, which appear to be of rhombic dodecahedral geometry, as can be seen in Fig. 7. This is the known geometry of zeolite RHO particles as reported by Mousavi et al.15 and shown in Fig. 4.
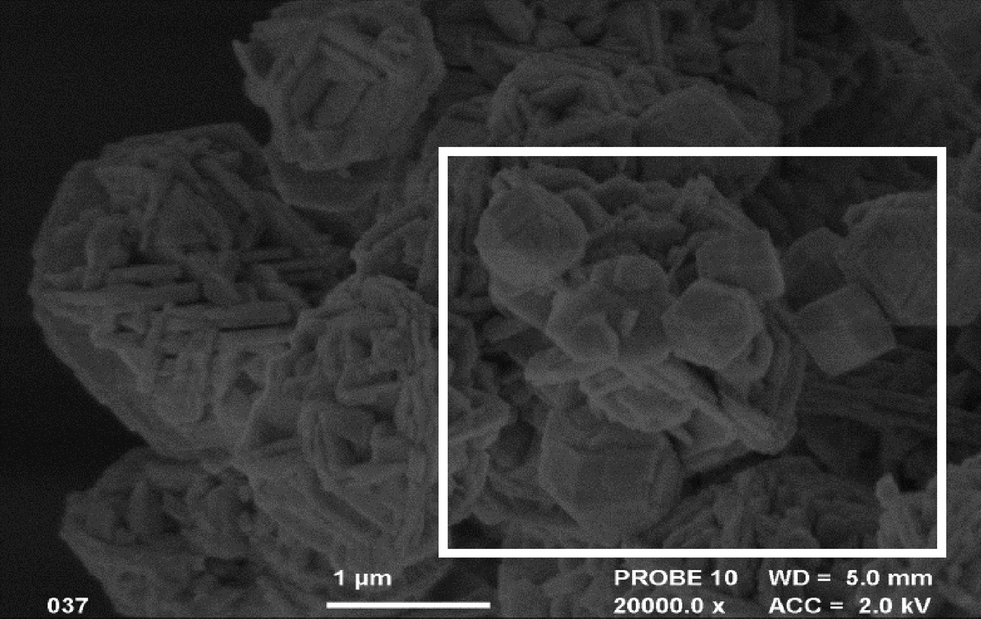 | ||
| Fig. 7 An SEM image of the 10% caesium sample, showing the third particle species – nanoscale polyhedrons which are highlighted by the white box. Scale bar is equal to 1 micrometer. | ||
In the 20% caesium sample, as shown in micrograph 6(d), only one particle size species is now seen, which agrees with the PXRD data indicating that this sample is predominantly zeolite RHO. These particles appear to be relatively uniform, spherical and smooth and have an average size of 1.51 μm. Although not showing a distinct geometry, these particles are similar to the ones described by Araki et al.12 We believe that further hydrothermal treatment would produce the rhombic dodecahedron geometry particles expected. At 25% caesium content, upon the appearance of analcime the average particle size is 1.39 μm. This is shown in micrographs 6(e) and 6(e(i)). The particles appear to be less uniform and more angular than those seen in the 20% sample. Therefore these particles could be showing the transformation of zeolite RHO to zeolite analcime as seen in the PXRD data.
Taking measurements from the SEM micrographs, particle size analysis was performed to observe how the particle species sizes vary with caesium content. Fig. 8 shows the particle size (mean and standard deviation) versus Cs content. For the average particle size of all the particles in the SEM micrograph, it can be seen that the value fluctuates around the 1.57 μm mark. In the absence of caesium cations, where the sample is pure FAU, the particles appear to be reasonably uniform, showing little variation in size as evidenced by the standard error.
 | ||
| Fig. 8 Average size of particles calculated from SEM data for samples 1–6. | ||
From this information, estimation on the morphology of RHO during the growth process with increasing caesium content can be made. The average sizes are not a true description, as the number of RHO nuclei is believed to increase with caesium content, thus giving smaller particles. Initially the large, stepped topology particles form, having an average size of 5.59 μm, and pertaining to the early formation of the zeolite RHO. The particles then decrease to an average size of 4.71 μm, producing strips along its surface like a watermelon, and with the planes appearing more like aggregated bumps. The particle sizes then begins to decrease in size rapidly, to around 1.5 μm, retaining the bumpy topology, but this eventually smoothens out to an almost perfect spherical particle. Edges begin to form, as the particles becomes more angular, gaining its shape and geometry. The particles gain angularity and lose their smooth surface seen in the earlier steps. Lastly the particle forms a uniform rhombic dodecahedron shape, the characteristic morphology for RHO.
2.3 SS MAS NMR data
Solid State Magic Angle Spinning NMR data were collected at Durham University using EPSRC-run NMR National Facility.Table 2 shows the chemical shifts from the 27Al SS MAS NMR of the samples. Only one local environment for aluminium atoms was observed which is consistent with tetrahedral arrangement (Fig. 9).
| 0% | 5% | 10% | 15% | 20% | 25% | |
|---|---|---|---|---|---|---|
| 27Al δ/ppm | 60.9 | 60.9 | 59.5 | 58.5 | 59.0 | 58.5 |
 | ||
| Fig. 9 27Al SS MAS NMR data for all samples. | ||
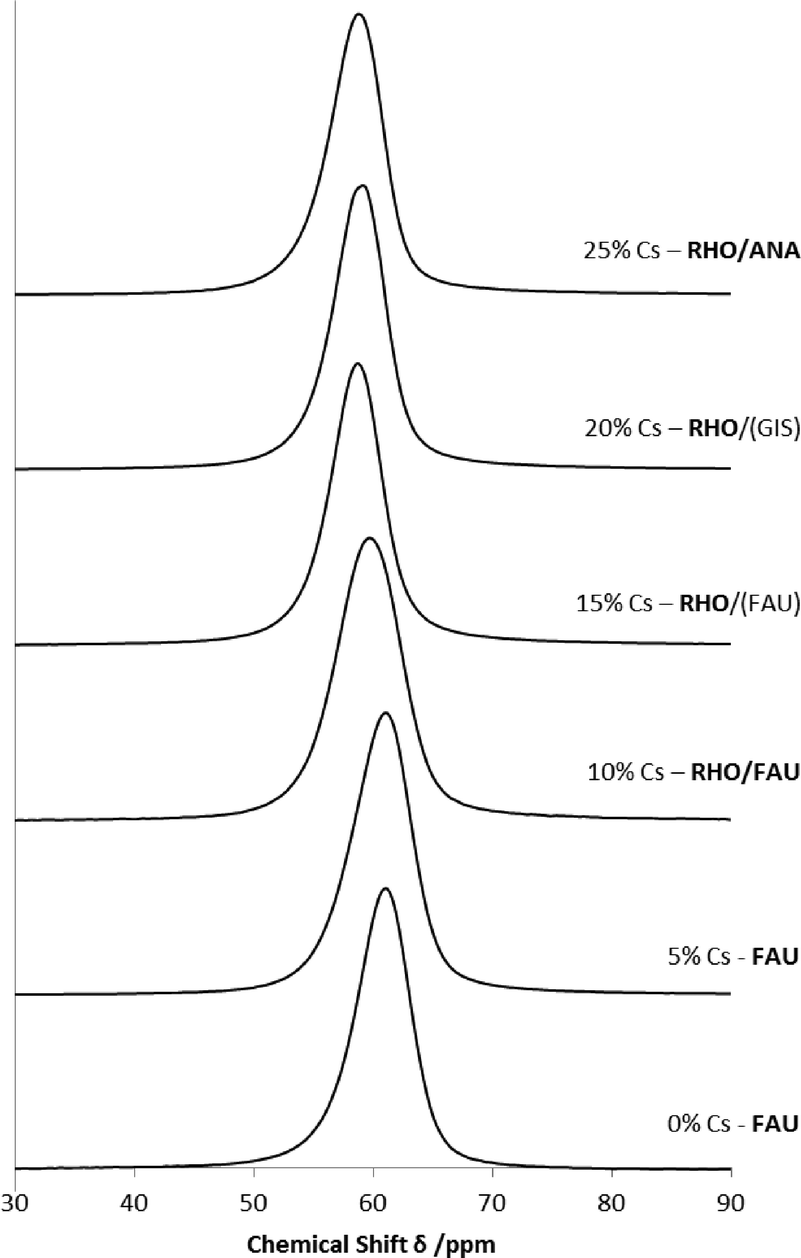
The chemical shifts of the peaks seen in the 133Cs SS MAS NMR spectra of the samples are shown in Table 3. It can been seen that increasing the caesium cation content of the gel, and the sample changing in zeolite composition, influences the local 133Cs environments in the structure. In the 5% caesium content sample, only two environments are seen at 15.7 ppm and 6.2 ppm. We understand that these environments are associated with the caesium cations incorporated into the zeolite Na–X framework. Due to the appearance of two different particle species in the FE-SEM (Micrograph 6(a)), it is possible that each shift could be associated with the different particles. Two peaks at approximately 16 ppm and 6 ppm are present together up to 15% caesium content. After 15% the 6 ppm shift is no longer seen, and a higher shift at 21 ppm is seen. Zeolite Na–X is only present up to 15% caesium content sample, agreeing with our proposal that they refer to environments in this zeolite framework.
| 5% | 10% | 15% | 20% | 25% | |
|---|---|---|---|---|---|
| 133Cs δ/ppm | 15.7 | 16.6 | 18.3 | 21.3 | 21.3 |
| 6.2 | 5.2 | 5.7 | |||
| 11.1 | 12* | ||||
| −16.9 | −16.6 | −15.0 | −16.2 |
Zeolite RHO begins to appear at the 10% caesium content sample, and becomes the more abundant and crystalline zeolite phase at 15%. We believe that this transformation leads to the increase in the chemical shift at around 16 ppm to 21 ppm. The shift at around – 16 ppm appears in the 10% caesium content sample as well. This has also been associated with an environment in RHO, as it continues to appear after 10% where the zeolite RHO is present.
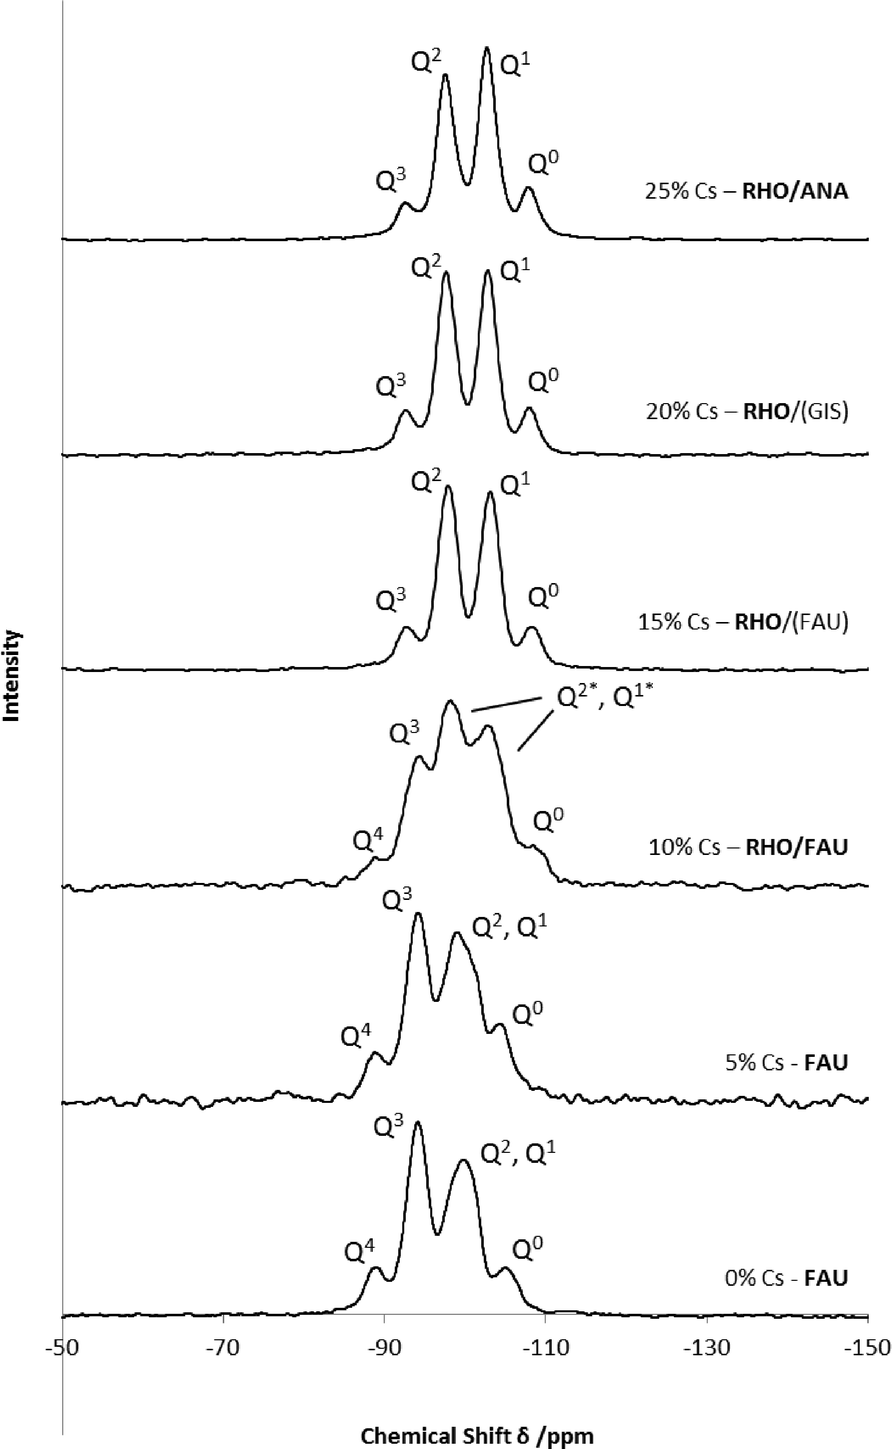
The 29Si SS MAS NMR chemical shift assignment was performed following Lippmaa et al.20 and is shown in Table 4. The spectra show signals at approximately −89, −93, −98, −102 and −107 ppm which have been assigned to the Q4, Q3, Q2, Q1 and Q0 environments respectively (Fig. 10). These environments refer to the number of alumina surrounding a silicon atom.
| 0% | 5% | 10% | 15% | 20% | 25% | |
|---|---|---|---|---|---|---|
| Q4 | −88.8 | −88.6 | −88.6 | |||
| Q3 | −94.0 | −93.9 | −94.1 | −92.7 | −92.4 | −92.5 |
| Q2 | −97.3 | −97.9 | −97.5 | −97.5 | ||
| −98.7 | −98.9 | −98.7 | ||||
| Q1 | −100.9 | −101.3 | −100.8 | |||
| −103.5 | −103.1 | −102.7 | −102.7 | |||
| Q0 | −105.1 | −104.5 | −108.5 | −108.3 | −108.0 | −108.0 |
 | ||
| Fig. 10 29Si SS MAS NMR data for all samples. | ||
From 0–5% caesium content, all five of the silicon environments are present, whereas from 15–25% caesium content the Q4 environment is absent. The data has been separated as seen in Table 4 to illustrate the distinction between the silicon environments between zeolite Na–X and zeolite RHO. This suggests that upon transformation from zeolite Na–X to RHO the Q4 environment is lost, meaning that in the zeolite RHO samples, there are no silicon atoms which are completely surrounded by aluminium atoms. In the 10% sample, 7 signals were seen in the spectra. We understood that this was due to the overlap of the zeolite RHO and Na–X systems seen in the XRD pattern. Assigning the environments, we propose that there were two Q2 and Q1 environments, belonging to both zeolites. The separation of the chemical shifts in Table 4 indicates which shifts belong to which zeolite.
The calculated Si/Al ratios in Table 5 show a gradual increase with caesium cation content. The standard Si/Al ratio for zeolite RHO is known to be 3,11 and for faujasite-type zeolites such as Na–X, it is known to be 2.0.21 This supports what is seen in Table 5, showing a distinction between the pure zeolites and between there is a gradual transformation from zeolite Na–X to RHO where the ratio changes. A Si/Al ratio could not be calculated for the 10% caesium content sample due to the overlapping of the Q2 and Q1 environments between zeolites Na–X and RHO preventing accurate deconvolution.
| 0% | 5% | 10% | 15% | 20% | 25% | |
|---|---|---|---|---|---|---|
| Si/Al ratio | 1.84 | 2.00 | — | 2.63 | 2.69 | 2.91 |
3. Conclusions
In the absence of caesium cations, faujasite zeolite preferentially crystallized. Increasing the content of caesium promoted the crystallization of zeolite RHO with pure RHO crystallizing at 15% of Cs. Further increase of Cs content leads to crystallization of RHO with analcime zeolite. We concluded that the range in which zeolite RHO could be synthesised was relatively small due to it being less stable than zeolite Na–X and analcime. From SEM microscopy we deduced that at low caesium contents the caesium cations collect together, producing large caesium rich particles which would crystallize into zeolite RHO. The exclusion of caesium therefore led to the crystallization of small particles of zeolite Na–X. The zeolite RHO and zeolite Na–X particles were seen to grow separately, as opposed to intergrowths. Increasing the caesium content gave a more uniform distribution across the sample, causing the large and small particles to become more similar in size. Once the particle sizes were uniform, pure zeolite RHO was crystallized. Increasing the caesium content above the pure zeolite RHO threshold, we concluded that analcime was preferentially crystallized over zeolite RHO. The morphological description of zeolite RHO formation upon increasing caesium content was discussed as growing spheres with topological steps, to bumpy aggregates, to smooth spheres which gained angularity and formed the rhombic dodecahedron shape. Due to the close relationship between zeolite RHO and analcime, it was deduced that analcime could follow a similar process.We anticipate that there is a potential for the use of RHO and faujasite-type zeolite mixtures to be used as catalysts in industrial processes. The possibility of using mixed RHO and faujasite-type zeolite catalysts has been supported by the work of Garces et al.22 in organic synthesis.
Acknowledgements
A.S. thanks the Royal Society for funding. We thank John Mitchel and Ursula Potter for help with collecting SEM data and Fraser Markwell for collecting SS NMR data at the EPSRC-funded SS NMR facility at Durham University.Notes and references
- D. W. Breck and J. V. Smith, Molecular Sieves, Sci. Am., 1959, 200(1), 85 CrossRef PubMed.
- A. Dyer, Ion-Exchange Properties of Zeolites and Related Materials, Introduction to Zeolite Science and Practice, 2007, vol. 168, pp. 525–553 Search PubMed.
- S. Bhatia, Zeolite Catalysts: Principles and applications, CRC Press, 1990, p. 304 Search PubMed.
- G. Bellussi and P. Pollesel, Industrial applications of zeolite catalysts: production and uses of light olefins, Molecular Sieves: From Basic Research to Industrial Applications, Pts A and B, 2005, vol. 158, pp. 1201–1212 Search PubMed.
- G. Bellussi, Zeolite catalysts for the production of chemical commodities: BTX derivatives, Recent Advances in the Science and Technology of Zeolites and Related Materials, Pts A - C, 2004, vol. 154, pp. 53–65 Search PubMed.
- C. Baerlocher, W. M. Meier and D. H. Olson, Atlas of zeolite framework types, Elsevier, 5th edn, 2001 Search PubMed.
- W. Meise and F. E. Schwocho, Kinetic Studies on Formation of Zeolite-A, Adv. Chem. Ser., 1973, 121, 169–178 CrossRef CAS PubMed.
- S. L. Burkett and M. E. Davis, Microporous Mater., 1993, 1, 265–282 CrossRef CAS.
- J. M. Newsam, D. E. W. Vaughan and K. G. Strohmaier, J. Phys. Chem., 1995, 99, 9924–9932 CrossRef CAS.
- A. Sartbaeva, S. A. Wells, M. M. J. Treacy and M. F. Thorpe, Nat. Mater., 2006, 5, 962–965 CrossRef CAS PubMed.
- T. Chatelain, J. Patarin, E. Fousson, M. Soulard, J. L. Guth and P. Schulz, Microporous Mater., 1995, 4, 231–238 CrossRef CAS.
- S. Araki, Y. Kiyohara, S. Tanaka and Y. Miyake, J. Colloid Interface Sci., 2012, 376, 28–33 CrossRef CAS PubMed.
- S. Z. Liu, P. Zhang, X. Meng, D. Liang, N. Xiao and F. Xiao, Microporous Mesoporous Mater., 2010, 132, 352–356 CrossRef CAS PubMed.
- H. E. Robson, D. P. Shoemaker, R. A. Ogilvie and P. C. Manor, Adv. Chem. Ser., 1973, 121, 106–115 CrossRef CAS PubMed.
- S. F. Mousavi, M. Jafari, M. Kazemimoghadam and T. Mohammadi, Ceram. Int., 2013, 39, 7149–7158 CrossRef CAS PubMed.
- S Araki, Y. Kiyohara, S. Tanaka and Y. Miyake, J. Colloid Interface Sci., 2012, 388, 185–190 CrossRef CAS PubMed.
- M. Park, S. H. Kim, N. H. Heo and S. Komarneni, 151–155, J. Porous Mater., 1996, 3 Search PubMed.
- D. E. W. Vaughan and K. G. Strohmaier, Abstr. Pap. Am. Chem. Soc., 1991, 202, 37 Search PubMed.
- M. M. J. Treacy and J. B. Higgins, Collection of Stimulated XRD Powder Patterns For Zeolites, Elsevier, 4th edn, 2001 Search PubMed.
- E. Lippmaa, M. Maegi, A. Samoson, M. Tarmak and G. Engelhardt, J. Am. Chem. Soc., 1981, 103, 4992–4996 CrossRef CAS.
- A. Sartbaeva, N. H. Rees, P. P. Edwards, A. J. Ramirez-Cuesta and E. Barney, J. Mater. Chem. A, 2013, 1, 7415–7421 CAS.
- L. J. Garces, V. D. Makwana, B. Hincapie, A. Sacco and S. L. Suib, J. Catal., 2003, 217, 107–116 CAS.
| This journal is © The Royal Society of Chemistry 2015 |