 Open Access Article
Creative Commons Attribution 3.0 Unported Licence
Solvent-starved conditions in confinement cause chemical oscillations excited by passage of a cathodic delamination front
Danish
Iqbal
,
Adnan
Sarfraz
,
Martin
Stratmann
and
Andreas
Erbe
*
Max-Planck-Institut für Eisenforschung GmbH, Max-Planck-Str. 1, 40237 Düsseldorf, Germany. E-mail: a.erbe@mpie.de; aerbe@arcor.de; Fax: +49 211 6792 218; Tel: +49 211 6792 890
First published on 26th August 2015
Abstract
After passage of a delamination front at a polymer/zinc interface, pH oscillations and oscillations in the quantity of corrosion products are observed. The reason for these oscillations is the low quantity of water in the confined reaction volume, water consumption by oxygen reduction, and water regeneration after precipitation of ZnO.
Confinement enables chemical processes which are not possible in bulk solution. Catalyst particles exhibit different catalytic activities inside carbon nanotubes compared to free particles.1,2 The inside of other carbon nanostructures,3–5 and silica networks can be used as “nanoreactors”.6,7 Spatial confinement was used to synthesize nanosheets.8,9 The ability to create confinement may have been crucial in the origin of life on the earth.10 Confinement enables the control of the characteristics of metal (electro)catalysts.11–13 In O2 electrochemistry, confinement affects reaction rates.14,15 Corrosion works differently in confinement, e.g. in “crevice corrosion”,16 which has recently been monitored in real time.17 In corrosion protection, polymer coatings are frequently employed. During their deadhesion from the base metal substrate, a confined reaction volume is created, which shall be explored here. The most prominent mechanism of deadhesion of a polymer from steel and galvanised steel is the electrochemical process of cathodic delamination.18 Inspired from the wealth of precipitation patterns formed in chemical gardens,19 this work studies the corrosion of Zn in the confinement created after passage of a delamination front between Zn and delaminating poly(vinyl butyral) [PVB] as a model for a weakly protecting polymer coating.
The mechanism of cathodic delamination has been shown to start with the electrochemical O2 reduction (ORR) at a front, which propagates underneath the coating, with anodic metal dissolution and random formation of corrosion products following after the front.18,20–22 We will show that oscillations are observed in the quantity of corrosion products formed and in pH between a delaminating polymer and a Zn substrate after the passage of a cathodic delamination front.
For the experiments, zinc sheets (1 cm × 1 cm × 1.5 mm; purity 99.95%; Goodfellow, Cambridge, UK) were initially mechanically polished using 4000 grit polishing paper and then cleaned ultrasonically in ethanol. The polished zinc sheets were spin coated with 10 weight% solution of PVB in ethanol (Sigma Aldrich) followed by drying in an oven at 70 °C, to obtain ∼2–3 μm thick polymer layers. Afterwards, a small defect in the polymer coating was created at the edge of the sample and the sample was placed on a zinc base plate. Then a small reservoir was built around the edge of the sample with the help of a fast drying two component adhesive to place an electrolyte.
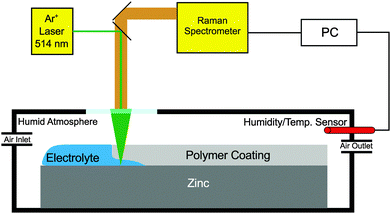
To carry out in situ and operando Raman measurements, the assembly of the sample mounted on a zinc substrate was introduced into a custom made chamber with a glass window opening to allow spectral acquisition (Fig. 1). To minimize electrolyte evaporation, the humidity was controlled at >90% by mixing humid and dry air with flow controllers. The in situ Raman spectra were recorded using a Horiba Jobin Yvon LabRAM confocal Raman microscope with an Argon ion laser source (emission at 514.342 nm) and a power output of 12 mW. The typical spectral acquisition time was in the range of 20 to 30 s. The measurements were performed in backscattering geometry with a long working distance 50×-objective (numerical aperture 0.5) for sample illumination and scattered light collection. The laser spot size on the sample surface was approximately 10 μm and it was focused roughly 2–3 mm away from the edge of the sample. To start the cathodic delamination process, the reservoir was filled with 1 M aqueous KCl solution. During the in situ measurements, the laser was focused on the same spot throughout the experiment. (Mapping of the sample surface, though desirable, failed because (a) it is difficult to keep the focus at the polymer/metal interface inside the in situ cell during mapping and (b) because during mapping, information on the temporal and spatial dependence are interleaved.)
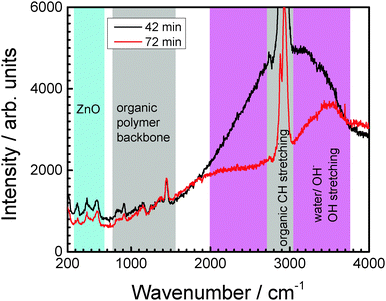
Raman spectra (examples in Fig. 2) show modes of the forming ZnO corrosion products, of H2O, and of the PVB polymer layer. Raman spectra are analysed in the regions containing ZnO modes (wavenumber ![[small nu, Greek, tilde]](https://www.rsc.org/images/entities/i_char_e0e1.gif) 360–660 cm−1) and water modes (3050–3800 cm−1). The ZnO region of the spectra is dominated by an E2 mode of wurzite ZnO at ∼440 cm−1, and its LO phonon at 570 cm−1.23,24 The LO phonon of single crystalline Wurzite ZnO is inactive in the backscattering geometry used here; its observation in the spectra therefore shows the presence of defects, e.g. oxygen or zinc vacancies.25,26 The peak positions are stable throughout the experiments, except for a shift of the LO peak to higher wavenumbers in the first minutes of the experiment. Consequently, the average environment inside the ZnO lattice is not changing, except in the initial phase of the experiment. The changes affect the environment of defect sites.
360–660 cm−1) and water modes (3050–3800 cm−1). The ZnO region of the spectra is dominated by an E2 mode of wurzite ZnO at ∼440 cm−1, and its LO phonon at 570 cm−1.23,24 The LO phonon of single crystalline Wurzite ZnO is inactive in the backscattering geometry used here; its observation in the spectra therefore shows the presence of defects, e.g. oxygen or zinc vacancies.25,26 The peak positions are stable throughout the experiments, except for a shift of the LO peak to higher wavenumbers in the first minutes of the experiment. Consequently, the average environment inside the ZnO lattice is not changing, except in the initial phase of the experiment. The changes affect the environment of defect sites.
 | ||
| Fig. 2 Examples of in situ Raman spectra after two different delamination times as indicated on the graph. Regions with contributions from the different species in the system are labelled. | ||
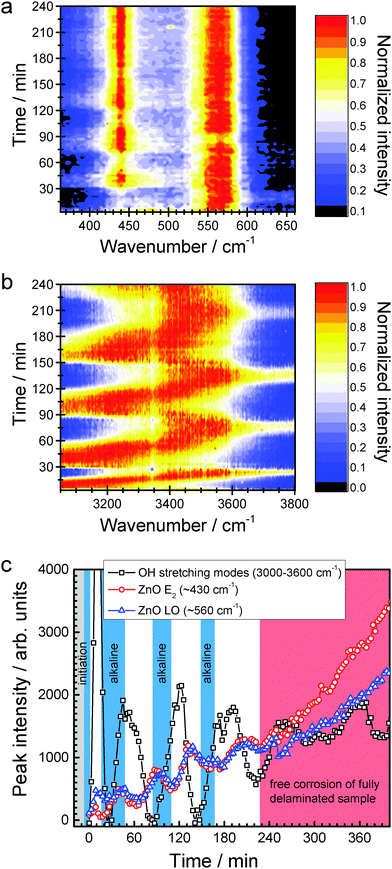
Normalised Raman intensities IN(![[small nu, Greek, tilde]](https://www.rsc.org/images/entities/i_char_e0e1.gif) ) shown in Fig. 3a and b have been obtained for each individual spectrum by setting the spectrum's minimum intensity Imin to zero and the spectrum's maximum intensity Imax to 1, i.e. as
) shown in Fig. 3a and b have been obtained for each individual spectrum by setting the spectrum's minimum intensity Imin to zero and the spectrum's maximum intensity Imax to 1, i.e. as
 | (1) |
Maxima of the OH stretching modes of H2O clearly show oscillations (Fig. 3b), between ≈3170 cm−1 during intervals with increasing intensity of the OH stretching modes and ≈3500 cm−1 during decreasing OH intensities. A shift of the maximum to lower wavenumbers is indicative of higher OH− concentration in water.27,28 Oscillations in intensity become obvious when plotting the Raman intensity at the maximum of the respective peak (Fig. 3c).
From scanning Kelvin probe investigations, a delamination rate of ≈3 mm h−1 has been determined. The oscillations terminate after ≈4 h, which coincides with the time for delamination of the full, 1 cm long coated area.
Chemical oscillations are encountered in a number of chemical systems far from equilibrium. Mostly, an autocatalytic step is involved in the reaction, e.g. because one reaction product or intermediate blocks or catalyses a follow-up reaction in a multistep process.29 Chemical oscillations have especially been observed and exploited in heterogeneous multi-phase systems.30,31 When coupled to oscillating reaction, interesting dynamics can be observed in follow-up processes.32–36 Oscillations in pH can lead to propagating fronts, when coupling to dynamic aggregation of nanoparticles.37,38 Even phase formation and dissolution can oscillate.39
No oscillations have so far been reported in delamination processes. In electrochemical systems, however, oscillations and pattern formation have been observed, e.g. during dissolution of n-type Si.40 On the example of CO electrooxidation, the mechanisms leading to oscillations involving several microelectrodes have been studied. With appropriate cooperativity, microscopic oscillations can be transformed into macroscopic patterns.41 In corrosion processes, local cathodes and local anodes are usually randomly distributed over the surface.21 Consequently, no oscillations are observed in a typical corrosion process. (Exceptions exist—oscillations in current and potential are observed e.g. in corrosion of stainless steels,42,43 of carbon steels or iron in acids,44–46 and copper,47 amongst others, mostly because of active–passive transitions.)
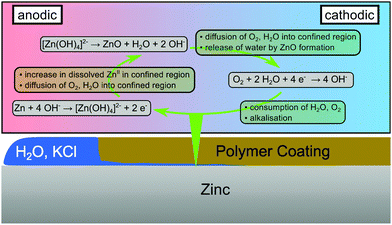
The proposed mechanism which leads to the oscillations observed here is summarised in Fig. 4. At a cathodic delamination front, ORR proceeds under water consumption,48,49
| O2 + 2H2O + 4e− → 4OH−. | (2) |
| Zn + 4OHaq− → [Zn(OH)4]aq2− + 2e−. | (3) |
| [Zn(OH)4]aq2− → ZnO + H2O + 2OHaq−, | (4) |
 | ||
| Fig. 4 Scheme of processes occurring consecutively after passage of a cathodic delamination front before complete delamination of the polymer coating. | ||
When the polymer coating is fully delaminated, the confined reaction volume disintegrates as no interaction prevents water from spreading on the metal. The consequence is an overall excess of water and the standard monotonous growth of corrosion products.
In conclusion, the ORR at a cathodic delamination front excites chemical oscillations, including an oscillating pH, on corroding Zn. The oscillations involve the formation of a solid ZnO phase. Because the solvent and reagent water is present in limited amounts (in analogy to the “crowded” situation in a cell),51 oscillations are sustained until the sample is fully delaminated. Consequently, after passage of the delamination front, not only the quantity of free water, but also the pH oscillates over a large range. It is unique in the investigated system that the solvent itself takes part in the feedback mechanism leading to oscillations. The observation of oscillations also shows that correlated and not random cathode–anode-structures are present in a delaminating system.18,21,22 In the field, full delamination is rarely observed, and confinement can be sustained for long times. Modern self-healing concepts are thus only viable if these oscillations are suppressed, or a redox-triggered self-healing mechanism is used.52
D.I. acknowledges a scholarship from the IMPRS SurMat. A.S. acknowledges support from the Max Planck Society through MaxNet Energy. This work is supported by the Cluster of Excellence RESOLV (EXC 1069) funded by the Deutsche Forschungsgemeinschaft.
References
- F. Zhang, X. Pan, Y. Hu, L. Yu, X. Chen, P. Jiang, H. Zhang, S. Deng, J. Zhang, T. B. Bolin, S. Zhang, Y. Huang and X. Bao, Proc. Natl. Acad. Sci. U. S. A., 2013, 110, 14861–14866 CrossRef CAS.
- J. Xiao, X. Pan, S. Guo, P. Ren and X. Bao, J. Am. Chem. Soc., 2015, 137, 477–482 CrossRef CAS.
- S. A. Miners, G. A. Rance and A. N. Khlobystov, Chem. Commun., 2013, 49, 5586–5588 RSC.
- G. A. Rance, W. A. Solomonsz and A. N. Khlobystov, Chem. Commun., 2013, 49, 1067–1069 RSC.
- C. Galeano, J. C. Meier, V. Peinecke, H. Bongard, I. Katsounaros, A. A. Topalov, A. Lu, K. J. J. Mayrhofer and F. Schüth, J. Am. Chem. Soc., 2012, 134, 20457–20465 CrossRef CAS.
- R. Gounder and E. Iglesia, Chem. Commun., 2013, 49, 3491–3509 RSC.
- S. Alberti, G. J. A. A. Soler-Illia and O. Azzaroni, Chem. Commun., 2015, 51, 6050–6075 RSC.
- S. C. Junggeburth, L. Diehl, S. Werner, V. Duppel, W. Sigle and B. V. Lotsch, J. Am. Chem. Soc., 2013, 135, 6157–6164 CrossRef CAS.
- H. Zhu, C. Xiao, H. Cheng, F. Grote, X. Zhang, T. Yao, Z. Li, C. Wang, S. Wei, Y. Lei and Y. Xie, Nat. Commun., 2014, 5, 3960 CAS.
- P. L. Urban, New J. Chem., 2014, 38, 5135–5141 RSC.
- L. Li, H. Zhao, J. Wang and R. Wang, ACS Nano, 2014, 8, 5352–5364 CrossRef CAS.
- C. Cui, L. Gan, M. Neumann, M. Heggen, B. Roldan Cuenya and P. Strasser, J. Am. Chem. Soc., 2014, 136, 4813–4816 CrossRef CAS.
- Y.-Z. Chen, Q. Xu, S.-H. Yu and H.-L. Jiang, Small, 2015, 11, 71–76 CrossRef CAS.
- J. Snyder, K. Livi and J. Erlebacher, Adv. Funct. Mater., 2013, 23, 5494–5501 CrossRef CAS.
- A. D. Doyle, J. H. Montoya and A. Vojvodic, ChemCatChem, 2015, 7, 738–742 CrossRef CAS.
- H. Kaesche, Corrosion of Metals: Physicochemical Principles and Current Problems, Springer, Berlin, Germany, 2003 Search PubMed.
- B. R. Shrestha, Q. Hu, T. Baimpos, K. Kristiansen, J. N. Israelachvili and M. Valtiner, J. Electrochem. Soc., 2015, 162, C327–C332 CrossRef CAS.
- G. Grundmeier and S. Alda, in Encyclopedia of Electrochemistry, ed. A. Bard, M. Stratmann and G. Frankel, Wiley-VCH, Weinheim, Germany, 2007, vol. 4, ch. Corrosion Protection by Organic Coatings, pp. 500–566 Search PubMed.
- F. Haudin, J. H. E. Cartwright, F. Brau and A. De Wit, Proc. Natl. Acad. Sci. U. S. A., 2014, 111, 17363–17367 CrossRef.
- W. Fürbeth and M. Stratmann, Corros. Sci., 2001, 43, 207–227 CrossRef.
- H. Leidheiser Jr., W. Wang and L. Igetoft, Prog. Org. Coat., 1983, 11, 19–40 CrossRef.
- J. H. W. de Wit, D. H. van der Weijde and G. Ferrari, in Corrosion Mechanisms in Theory and Practice, ed. P. Marcus, CRC Press, Boca Raton, USA, 3rd edn, 2012, ch. Organic Coatings, pp. 863-906 Search PubMed.
- T. C. Damen, S. P. S. Porto and B. Tell, Phys. Rev., 1966, 142, 570–574 CrossRef CAS.
- Ü. Özgür, Y. I. Alivov, C. Liu, A. Teke, M. A. Reshchikov, S. Doğan, V. Avrutin, S.-J. Cho and H. Morkoç, J. Appl. Phys., 2005, 98, 041301 CrossRef.
- Y. Y. Tay, T. T. Tan, M. H. Liang, F. Boey and S. Li, Appl. Phys. Lett., 2008, 93, 111903 CrossRef.
- Y. Chen, P. Schneider, B.-J. Liu, S. Borodin, B. Ren and A. Erbe, Phys. Chem. Chem. Phys., 2013, 15, 9812–9822 RSC.
- W. R. Busing and D. F. Hornig, J. Phys. Chem., 1961, 65, 284–292 CrossRef CAS.
- G. E. Walrafen and R. T. W. Douglas, J. Chem. Phys., 2006, 124, 114504 CrossRef.
- D. Kondepudi and I. Prigogine, Modern Thermodynamics, Wiley, Chichester, 1998 Search PubMed.
- G. Ertl, Angew. Chem., Int. Ed., 2008, 47, 3524–3535 CrossRef CAS.
- S. Mann, Nat. Mater., 2009, 8, 781–792 CrossRef CAS.
- J. R. Howse, P. Topham, C. J. Crook, A. J. Gleeson, W. Bras, R. A. L. Jones and A. J. Ryan, Nano Lett., 2006, 6, 73–77 CrossRef CAS.
- L. Donlon and K. Novakovic, Chem. Commun., 2014, 50, 15506–15508 RSC.
- Y. Chen and C. Mao, Small, 2008, 4, 2191–2194 CrossRef CAS.
- T. Liedl and F. C. Simmel, Nano Lett., 2005, 5, 1894–1898 CrossRef CAS.
- I. Molnar, K. Kurin-Csorgei, M. Orban and I. Szalai, Chem. Commun., 2014, 50, 4158–4160 RSC.
- I. Lagzi, B. Kowalczyk, D. Wang and B. A. Grzybowski, Angew. Chem., Int. Ed., 2010, 49, 8616–8619 CrossRef CAS.
- H. Nabika, T. Inumata, H. Kitahata and K. Unoura, Colloids Surf., A, 2014, 460, 236–239 CrossRef CAS.
- K. Kurin-Csörgei, I. R. Epstein and M. Orbán, Nature, 2005, 433, 139–142 CrossRef.
- K. Schönleber, C. Zensen, A. Heinrich and K. Krischer, New J. Phys., 2014, 16, 063024 CrossRef.
- D. A. Crespo-Yapur, A. Bonnefont, R. Schuster, K. Krischer and E. R. Savinova, ChemPhysChem, 2013, 14, 1117–1121 CrossRef CAS.
- S. Jones, K. Coley and J. Kish, Corrosion, 2013, 69, 543–550 CrossRef CAS.
- S. R. Street, W. Xu, M. Amri, L. Guo, S. J. M. Glanvill, P. D. Quinn, J. F. W. Mosselmans, J. Vila-Comamala, C. Rau, T. Rayment and A. J. Davenport, J. Electrochem. Soc., 2015, 162, C457–C464 CrossRef CAS.
- Y. Zhu, L. Li and C. Wang, Corros. Sci., 2015, 94, 445–451 CrossRef CAS.
- D. Sazou, A. Kominia and M. Pagitsas, J. Solid State Electrochem., 2014, 18, 347–360 CrossRef CAS.
- T. Kado and N. Kunitomi, J. Electrochem. Soc., 1991, 138, 3312–3321 CrossRef CAS.
- N. I. Potkonjak, Z. Nikolić, S. R. Anić and D. M. Minić, Corros. Sci., 2014, 83, 355–358 CrossRef CAS.
- A. Leng, H. Streckel and M. Stratmann, Corros. Sci., 1998, 41, 547–578 CrossRef.
- A. Leng, H. Streckel and M. Stratmann, Corros. Sci., 1998, 41, 579–597 CrossRef.
- X. G. Zhang, Corrosion and Electrochemistry of Zinc, Plenum Press, New York, USA, 1996 Search PubMed.
- D. Gnutt, M. Gao, O. Brylski, M. Heyden and S. Ebbinghaus, Angew. Chem., Int. Ed., 2015, 54, 2548–2551 CrossRef CAS.
- A. Vimalanandan, L.-P. Lv, T. H. Tran, K. Landfester, D. Crespy and M. Rohwerder, Adv. Mater., 2013, 25, 6980–6984 CrossRef CAS.
| This journal is © The Royal Society of Chemistry 2015 |


