 Open Access Article
Creative Commons Attribution 3.0 Unported Licence
Bright fluorogenic squaraines with tuned cell entry for selective imaging of plasma membrane vs. endoplasmic reticulum†
Mayeul
Collot
*a,
Rémy
Kreder
a,
Anatoliy L.
Tatarets
b,
Leonid D.
Patsenker
b,
Yves
Mely
a and
Andrey S.
Klymchenko
*a
aLaboratoire de Biophotonique et Pharmacologie, UMR 7213 CNRS, Université de Strasbourg, Faculté de Pharmacie, 74, Route du Rhin, 67401, Illkirch, France. E-mail: andrey.klymchenko@unistra.fr; mayeul.collot@unistra.fr
bThe State Scientific Institution “Institute for Single Crystals” of the National Academy of Sciences of Ukraine, 60, Lenin Ave., Kharkiv, 61001, Ukraine
First published on 29th September 2015
Abstract
A rational design of squaraine dyes with lipophilic and zwitterionic groups tunes cell entry, allowing for selective far-red/near-infrared imaging of plasma membrane vs. endoplasmic reticulum. They exhibit up to 110-fold fluorescence enhancement in biomembranes and enable cellular imaging at 1 nM concentration, which make them the brightest membrane probes to date.
Fluorescence imaging of living cells is a rapidly expanding research direction. It relies on the development of fluorescent probes,1 which are smart fluorescent tools built from organic molecules, proteins2 or nanoparticles.3 Of particular interest are probes for cell plasma membranes, because the latter delimit the cellular contour and thus enable a clear distinction between extra- and intracellular components. In addition to the basic function of the cell barrier, membranes are the turntables for crucial processes in neurobiology, muscle contraction, and cell signalling.4
Fluorescently labelled lectins, notably wheat germ agglutinin (WGA), are among the most popular fluorescent membrane probes.5 On the other hand, membrane probes based on small organic dyes, being less expensive and more chemically stable, present the unique possibility of being precisely located and oriented in the lipid bilayer,6 which are important for studies of the lateral lipid organization of biomembranes (lipid rafts),7–9 FRET with membrane proteins10 and super-resolution imaging.11,12 However, the widespread use of these probes is limited by their poor performance compared to labelled WGA. For instance, the well-known FM 4-64 internalizes rapidly in cells by endocytosis and its brightness is low.13,14 Long-chain cyanines, such as DiO, DiI, DiD, and DiR, due to poor solubility, stain plasma membranes inefficiently with a large amount of intracellular dotted fluorescence.15,16 Remarkably, cell staining with FM 4-64 or the cyanine probes requires 1–5 μM concentration, which is ∼100-fold larger than the concentration theoretically needed to achieve a probe/plasma membrane lipid ratio of 1/100 (for 106 cells per mL). Above this ratio, the probe may significantly perturb the biomembrane properties. Examples of highly specific plasma membrane probes working at low concentrations with long retention times appeared rather recently, notably using 3-methoxyflavones,17 Nile Red,18 and BODIPY.19,20 However, high-performance membrane probes in the far-red to near-infrared (NIR) regions are still missing. Such probes should be particularly interesting for both in vitro and in vivo imaging applications21 as well as for multi-colour imaging with the green and red fluorescent markers commonly used in biology. In this respect squaraine dyes are particularly attractive due to their absorption and emission in the far-red to NIR regions, exceptional molar extinction coefficients (around 300![[thin space (1/6-em)]](https://www.rsc.org/images/entities/char_2009.gif) 000 M−1 cm−1) and high quantum yields, which made them very popular for the development of fluorescent probes.22–27 However, so far squaraines have never been used to build a probe selective to cell plasma membranes.
000 M−1 cm−1) and high quantum yields, which made them very popular for the development of fluorescent probes.22–27 However, so far squaraines have never been used to build a probe selective to cell plasma membranes.
Herein, new squaraine-based membrane probes were designed with a long hydrocarbon chain and a zwitterionic group, which serve as anchors to fix the fluorophore at the interface and prevent the flip–flop of the probes between the leaflets, as we have shown earlier for 3-hydroxyflavone28 and Nile Red dyes.18 First, SQ8S was designed, where the squaraine dye bears a hydrophobic tail at one end and a zwitterionic polar head at the other end (Scheme 1). SQ8S was synthesised from the unsymmetrical squaraine 2, which was coupled to N,N-dimethylpropane-1,3-diamine and was subsequently reacted with 1,3-propane sultone (Scheme 1). In a second approach, SQ12S and dSQ12S were designed to bear the fluorophore and respectively one or two amphiphilic anchors. These anchors were composed of a hydrocarbon chain (C12) and an ammonium sulphate inner salt as a zwitterionic moiety, which should favour high affinity to the lipid membrane. SQ12S and dSQ12S were obtained from a block synthesis based on CuAAC click chemistry.29 The key amphiphilic zwitterionic block 9 was obtained by reacting N-methyldodecylamine with 1-azido-3-chloropropane followed by quaternisation with 1,3-propanesultone (Scheme S2, ESI†). Block 9 was then clicked to the unsymmetrical and symmetrical squaraines 6 and 12 (Scheme S1, ESI†) to respectively obtain SQ12S and dSQ12S (Scheme 1).
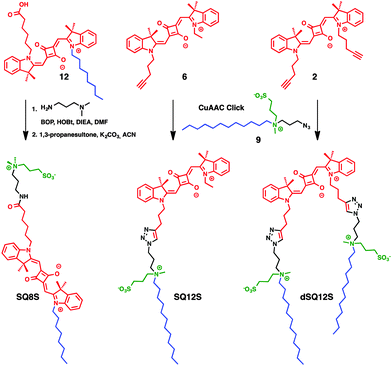 | ||
| Scheme 1 Structures and synthesis strategy of membrane probes consisting of a squaraine dye (red), a hydrocarbon chain (blue) and a zwitterionic moiety (green). | ||
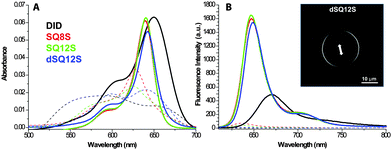
In order to investigate the ability of these fluorophores to probe lipophilic environments, spectroscopic analyses were performed in dioxane, methanol, DMSO, and phosphate buffer (20 mM, pH 7.4) and in Large Unilamelar Vesicles (LUVs) composed of 1,2-dioleoyl-sn-glycero-3-phosphocholine (DOPC). These data were systematically compared to a dye of similar colour: 1,1′-dioctadecyl-3,3,3′,3′-tetramethylindodicarbocyanine perchlorate (DiD), a commercially available plasma membrane tracer, consisting of cyanine-5 bearing two C-18 hydrocarbon chains.16 In organic solvents, the new dyes showed sharp absorption and emission bands with a quantum yield (QY) reaching 70% in apolar dioxane (Table 1). The QY values in methanol were significantly lower, which, in line with our earlier studies,25 show that squaraine dyes undergo some quenching in polar protic solvents. All new squaraine dyes showed very low fluorescence in water, while for DiD it was not even detectable. Their absorption spectra were very broad (Fig. 1), suggesting that in aqueous buffer the dyes form non-fluorescent aggregates. Upon binding to lipid membranes, squaraine probes showed a strong increase in fluorescence intensity with QY ranging between 49 and 70%. The absorption spectra suggested that in the presence of LUVs the dye aggregates were disrupted, so that the highly emissive molecular form was inserted into the bilayers. Importantly, imaging giant vesicles with polarized two-photon laser excitation revealed that all three probes presented parallel orientation with respect to the bilayer plane (Fig. 2, Fig. S4, ESI†), which was originally expected only for dSQ12S bearing two anchor groups.
| Probe | Solvent |
λ
Abs![[thin space (1/6-em)]](https://www.rsc.org/images/entities/char_2009.gif) max (nm) max (nm) |
ε at λAbs![[thin space (1/6-em)]](https://www.rsc.org/images/entities/char_2009.gif) max (M−1 cm−1) max (M−1 cm−1) |
λ
Em![[thin space (1/6-em)]](https://www.rsc.org/images/entities/char_2009.gif) max (nm) max (nm) |
QY (%) |
|---|---|---|---|---|---|
| a 20 mM, pH 7.4. b 200 μM DOPC in phosphate buffer (20 mM, pH 7.4). c No fluorescence was observed. d DiD in MeOH was used as a reference for the quantum yield (QY) measurements.30 | |||||
| DiD | Dioxane | 644 | 210![[thin space (1/6-em)]](https://www.rsc.org/images/entities/char_2009.gif) 000 000 |
664 | 80 |
| Methanol | 644 | 250![[thin space (1/6-em)]](https://www.rsc.org/images/entities/char_2009.gif) 000 000 |
664 | 33d | |
| DMSO | 650 | 276![[thin space (1/6-em)]](https://www.rsc.org/images/entities/char_2009.gif) 000 000 |
670 | 62 | |
| Phosphate buffera | 592 | 60![[thin space (1/6-em)]](https://www.rsc.org/images/entities/char_2009.gif) 800 800 |
N/Ac | N/Ac | |
| LUVs DOPCb | 650 | 210![[thin space (1/6-em)]](https://www.rsc.org/images/entities/char_2009.gif) 000 000 |
671 | 13 | |
| SQ8S | Dioxane | 639 | 267![[thin space (1/6-em)]](https://www.rsc.org/images/entities/char_2009.gif) 000 000 |
648 | 67 |
| Methanol | 631 | 300![[thin space (1/6-em)]](https://www.rsc.org/images/entities/char_2009.gif) 000 000 |
637 | 15 | |
| DMSO | 646 | 233![[thin space (1/6-em)]](https://www.rsc.org/images/entities/char_2009.gif) 000 000 |
654 | 46 | |
| Phosphate buffera | 628 | 166![[thin space (1/6-em)]](https://www.rsc.org/images/entities/char_2009.gif) 300 300 |
636 | 2.2 | |
| LUVs DOPCb | 640 | 305![[thin space (1/6-em)]](https://www.rsc.org/images/entities/char_2009.gif) 000 000 |
647 | 70 | |
| SQ12S | Dioxane | 638 | 272![[thin space (1/6-em)]](https://www.rsc.org/images/entities/char_2009.gif) 000 000 |
646 | 57 |
| Methanol | 629 | 296![[thin space (1/6-em)]](https://www.rsc.org/images/entities/char_2009.gif) 000 000 |
637 | 10 | |
| DMSO | 644 | 211![[thin space (1/6-em)]](https://www.rsc.org/images/entities/char_2009.gif) 000 000 |
653 | 40 | |
| Phosphate buffera | 626 | 188![[thin space (1/6-em)]](https://www.rsc.org/images/entities/char_2009.gif) 600 600 |
634 | 1.4 | |
| LUVs DOPCb | 640 | 314![[thin space (1/6-em)]](https://www.rsc.org/images/entities/char_2009.gif) 000 000 |
647 | 67 | |
| dSQ12S | Dioxane | 642 | 285![[thin space (1/6-em)]](https://www.rsc.org/images/entities/char_2009.gif) 000 000 |
649 | 73 |
| Methanol | 632 | 304![[thin space (1/6-em)]](https://www.rsc.org/images/entities/char_2009.gif) 000 000 |
640 | 17 | |
| DMSO | 646 | 215![[thin space (1/6-em)]](https://www.rsc.org/images/entities/char_2009.gif) 000 000 |
654 | 63 | |
| Phosphate buffera | 640 | 108![[thin space (1/6-em)]](https://www.rsc.org/images/entities/char_2009.gif) 000 000 |
637 | 0.46 | |
| LUVs DOPCb | 642 | 274![[thin space (1/6-em)]](https://www.rsc.org/images/entities/char_2009.gif) 000 000 |
649 | 49 | |
On the other hand, DiD failed to reach high quantum efficiency when added to LUVs (QY = 13%). We suppose that the direct addition of DiD from DMSO solution to an aqueous suspension of LUVs produced partial dye precipitation and thus inefficient binding to lipid membranes. Overall, the fluorogenic response of the new amphiphilic squaraines to lipid vesicles made these dyes promising as probes for biological membranes.
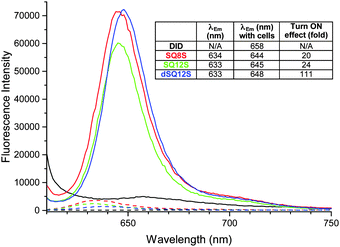
First, kinetic cell binding studies were performed, where the probes were added to a suspension of lymphocytes (Fig. S5, ESI†). Whereas the DiD probe did not exhibit any significant fluorescence enhancement in the presence of cells, the squaraine probes displayed a burst of fluorescence intensity in the first seconds. It was noteworthy that SQ8S and SQ12S rapidly reached the plateau, while the fluorescence intensity of dSQ12S increased slowly, probably due to a slower de-aggregation and membrane binding process. The emission spectra of the probes recorded after 15 min incubation with lymphocytes (Fig. 2) showed that DiD failed to stain efficiently the cells, whereas the squaraine-probes displayed an important fluorescence enhancement of 20–24-fold for SQ8S and SQ12S and up to 111-fold for dSQ12S, which are in good agreement with the results of DOPC vesicles (Table 1).
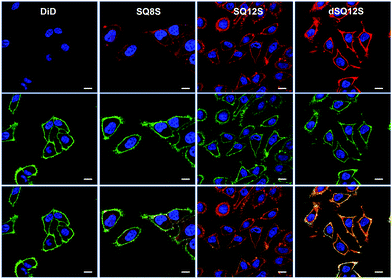
The ability of the new probes to stain cell membranes was then investigated by laser scanning confocal fluorescence microscopy using an adherent cell line (HeLa). HeLa cells were incubated with the squaraine probes at a concentration of 20 nM without the washing step and imaged at different times (Fig. S6, ESI†).
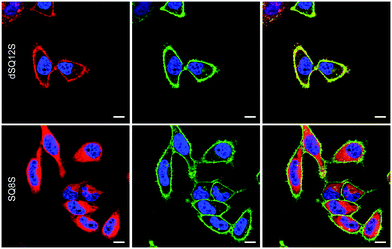
Even after 5–10 min of incubation squaraine probes displayed bright fluorescence in cell membranes with no background fluorescence (Fig. 3). Despite similarities in their structures and spectral properties, the new probes presented notable differences in their internalization and distribution within cells. Colocalisation experiments with WGA-488, a commercially available green membrane marker, showed that dSQ12S stained well the plasma membrane, whereas SQ8S accumulated rapidly in the cytoplasm. SQ12S had an intermediate behaviour as it was distributed both on the plasma membrane and the cytoplasm. Taking advantage of their exceptional brightness, the squaraine probes used at very low concentration (1 nM) provided excellent quality images (Fig. 4 and Fig. S7, ESI†) of cell plasma membranes (dSQ12S) or cytoplasm (SQ8S). Remarkably, clear plasma membrane staining with dSQ12S was observed even after 1 h of incubation.
In order to determine in which cytoplasmic compartment SQ8S and SQ12S accumulated, a colocalisation experiment with endoplasmic reticulum (ER)-tracker green was performed. The results showed clear colocalisation of SQ8S and SQ12S with the ER-tracker, whereas dSQ12S perfectly stained the plasma membrane with no sign of colocalisation (Fig. S8, ESI†).
In sharp contrast, commercial probe DiD at 20 nM showed no detectable fluorescence after 5–10 min (Fig. 3). Even after 1 hour, DiD failed in staining the cell membranes as dim fluorescence could only be detected in the form of dots (Fig. S9, ESI†). It is highly probable that DiD formed insoluble aggregates that penetrated into the cells by endocytosis. Data in the literature show that membrane staining requires much higher DiD concentrations15,16 and special delivery agents, as for instance in the case of the commercial kit Vybrant™ DiD. Our microscopy data with Vybrant™ DiD showed that at 20 nM it failed to stain cell membranes (Fig. S10, ESI†), while at 2 μM (recommended in the protocol), the staining was heterogeneous, so that many cells remained unlabeled (Fig. S11, ESI†). The other commercial membrane probe CellVue® Claret, which is derived from the PKH family,31 showed heterogeneous staining at 20 nM, where many cells also remained unlabeled. This uneven staining is probably related to the low concentration compared to that recommended in the protocol (2 μM). Moreover, CellVue® Claret required the use of a special low salt medium “diluant C” and did not work in a common saline buffer such as HBSS (Fig. S12, ESI†).
These results point out several key advantages of dSQ12S compared to the existing commercial fluorescent plasma membrane probes operating in the far-red to NIR regions: (a) dSQ12S works well at >1000-fold lower concentration (1 nM vs. 2 μM); (b) it stains homogeneously all cells even at nanomolar concentrations; and (c) it can be used with usual saline buffers. Moreover, compared to FM 4-64 and DiD, dSQ12S exhibits much more specific staining of cell plasma membranes with minimal internalization. It is also at least 10-fold brighter than other high-performance membrane probes based 3-methoxyflavones,17 Nile Red,18 and BODIPY19,20 operating in shorter-wavelength spectral region. Regarding SQ8S, it was successfully used at sub-nanomolar concentration (Fig. S13, ESI†), whereas the typical concentration for commercial ER trackers green and red recommended by the producer (Life Technologies) is 1 μM. Thus, dSQ12S and SQ8S are by far the brightest probes for cell membranes developed to date. This exceptional brightness can be explained by the molecular design that enables efficient staining of cell membranes as well as very high extinction coefficient (∼300![[thin space (1/6-em)]](https://www.rsc.org/images/entities/char_2009.gif) 000 M−1 cm−1) combined with good quantum yield (50–70%).
000 M−1 cm−1) combined with good quantum yield (50–70%).
In conclusion, we designed three amphiphilic squaraine probes containing hydrocarbon chains and zwitterionic polar head groups. Herein, we draw the attention on the molecular design of such probes, as small modifications lead to dramatic changes in their cell permeability and therefore their distribution in the cell. SQ8S, bearing an alkyl chain and a zwitterionic group at the opposite sides of the squaraine unit, quickly crossed the plasma membrane to efficiently stain the endoplasmic reticulum membranes. SQ12S containing an anchor moiety (a chain and a zwitterion) at one end of the squaraine unit was distributed in both plasma and ER membranes. Finally, dSQ12S due to the presence of two anchors stained specifically plasma membranes without significant internalization. To the best of our knowledge, SQ8S and dSQ12S, operating well at 1 nM concentration and compatible with two-photon excitation, are respectively the brightest molecular ER and plasma membrane fluorescent probes developed to date.
This work and RK were supported by ANR JCJC (ANR-11-JS07-014-01). MC would like to dedicate this work to the viola Maestro Serge Collot (1923–2015).
Notes and references
- B. N. G. Giepmans, S. R. Adams, M. H. Ellisman and R. Y. Tsien, Science, 2006, 312, 217–224 CrossRef CAS PubMed
.
- N. C. Shaner, R. E. Campbell, P. A. Steinbach, B. N. G. Giepmans, A. E. Palmer and R. Y. Tsien, Nat. Biotechnol., 2004, 22, 1567–1572 CrossRef CAS PubMed
.
- P. D. Howes, R. Chandrawati and M. M. Stevens, Science, 2014, 346, 53 CrossRef CAS PubMed
.
- D. Lingwood and K. Simons, Science, 2010, 327, 46–50 CrossRef CAS PubMed
.
- M. A. Model, J. L. Reese and G. C. Fraizer, Cytometry, Part A, 2009, 75, 874–881 CrossRef PubMed
.
- A. P. Demchenko, Y. Mély, G. Duportail and A. S. Klymchenko, Biophys. J., 2009, 96, 3461–3470 CrossRef CAS PubMed
.
- A. S. Klymchenko and R. Kreder, Chem. Biol., 2014, 21, 97–113 CrossRef CAS PubMed
.
- L. Jin, A. C. Millard, J. P. Wuskell, X. Dong, D. Wu, H. A. Clark and L. M. Loew, Biophys. J., 2006, 90, 2563–2575 CrossRef CAS PubMed
.
- D. M. Owen, D. J. Williamson, A. Magenau and K. Gaus, Nat. Commun., 2012, 3, 1256 CrossRef PubMed
.
- I. Ziomkiewicz, A. Loman, R. Klement, C. Fritsch, A. S. Klymchenko, G. Bunt, T. M. Jovin and D. J. Arndt-Jovin, Cytometry, Part A, 2013, 83, 794–805 CrossRef PubMed
.
- L. M. Solanko, A. Honigmann, H. S. Midtiby, F. W. Lund, J. R. Brewer, V. Dekaris, R. Bittman, C. Eggeling and D. Wustner, Biophys. J., 2013, 105, 2082–2092 CrossRef CAS PubMed
.
- A. Honigmann, V. Mueller, H. Ta, A. Schoenle, E. Sezgin, S. W. Hell and C. Eggeling, Nat. Commun., 2014, 5, 5412 CrossRef CAS PubMed
.
- Z. Darwich, A. S. Klymchenko, D. Dujardin and Y. Mély, RSC Adv., 2014, 4, 8481–8488 RSC
.
- S. Bolte, C. Talbot, Y. Boutte, O. Catrice, N. D. Read and B. Satiat-Jeunemaitre, J. Microsc., 2004, 214, 159–173 CrossRef CAS PubMed
.
- L. Heinrich, A.-M. Freyria, M. Melin, Y. Tourneur, R. Maksoud, J.-C. Bernengo and D. J. Hartmann, J. Biomed. Mater. Res., Part B, 2007, 81, 153–161 CrossRef PubMed
.
- M. G. Honig and R. I. Hume, J. Cell Biol., 1986, 103, 171–187 CrossRef CAS
.
- R. Kreder, S. Oncul, O. A. Kucherak, K. A. Pyrshev, E. Real, Y. Mely and A. S. Klymchenko, RSC Adv., 2015, 5, 22899–22905 RSC
.
- O. A. Kucherak, S. Oncul, Z. Darwich, D. A. Yushchenko, Y. Arntz, P. Didier, Y. Mély and A. S. Klymchenko, J. Am. Chem. Soc., 2010, 132, 4907–4916 CrossRef CAS PubMed
.
- X. Zhang, C. Wang, L. Jin, Z. Han and Y. Xiao, ACS Appl. Mater. Interfaces, 2014, 6, 12372–12379 CAS
.
- I. Lopez-Duarte, T. T. Vu, M. A. Izquierdo, J. A. Bull and M. K. Kuimova, Chem. Commun., 2014, 50, 5282–5284 RSC
.
- L. Yuan, W. Y. Lin, K. B. Zheng, L. W. He and W. M. Huang, Chem. Soc. Rev., 2013, 42, 622–661 RSC
.
- A. Ajayaghosh, Acc. Chem. Res., 2005, 38, 449–459 CrossRef CAS PubMed
.
- B. Oswald, L. Patsenker, J. Duschl, H. Szmacinski, O. S. Wolfbeis and E. Terpetschmg, Bioconjugate Chem., 1999, 10, 925–931 CrossRef CAS PubMed
.
- E. Arunkumar, A. Ajayaghosh and J. Daub, J. Am. Chem. Soc., 2005, 127, 3156–3164 CrossRef CAS PubMed
.
- I. A. Karpenko, A. S. Klymchenko, S. Gioria, R. Kreder, I. Shulov, P. Villa, Y. Mely, M. Hibert and D. Bonnet, Chem. Commun., 2015, 51, 2960–2963 RSC
.
- I. A. Karpenko, M. Collot, L. Richert, C. Valencia, P. Villa, Y. Mely, M. Hibert, D. Bonnet and A. S. Klymchenko, J. Am. Chem. Soc., 2015, 137, 405–412 CrossRef CAS PubMed
.
- J. Li, K. Guo, J. Shen, W. Yang and M. Yin, Small, 2014, 10, 1351–1360 CrossRef CAS PubMed
.
- V. V. Shynkar, A. S. Klymchenko, C. Kunzelmann, G. Duportail, C. D. Muller, A. P. Demchenko, J. M. Freyssinet and Y. Mely, J. Am. Chem. Soc., 2007, 129, 2187–2193 CrossRef CAS PubMed
.
- J. E. Hein and V. V. Fokin, Chem. Soc. Rev., 2010, 39, 1302–1315 RSC
.
- I. Texier, M. Goutayer, A. Da Silva, L. Guyon, N. Djaker, V. Josserand, E. Neumann, J. Bibette and F. Vinet, J. Biomed. Opt., 2009, 14, 054005 CrossRef PubMed
.
- P. K. Horan, M. J. Melnicoff, B. D. Jensen and S. E. Slezak, Methods Cell Biol., 1990, 33, 469–490 CrossRef CAS
.
Footnote |
| † Electronic supplementary information (ESI) available: All experimental protocols and additional cellular data. See DOI: 10.1039/c5cc06094j |
| This journal is © The Royal Society of Chemistry 2015 |

