
 Open Access Article
 This Open Access Article is licensed under a
 Creative Commons Attribution 3.0 Unported Licence
Characterization of a heterobimetallic nonheme Fe(III)–O–Cr(III) species formed by O2 activation†
Ang
Zhou
,
Scott T.
Kleespies
,
Katherine M.
Van Heuvelen‡
and
Lawrence
Que
Jr.
*
Department of Chemistry and Center for Metals in Biocatalysis, University of Minnesota, 207 Pleasant St. SE, Minneapolis, Minnesota 55455, USA. E-mail: larryque@umn.edu
First published on 6th August 2015
Abstract
We report the generation and spectroscopic characterization of a heterobimetallic [(TMC)FeIII–O–CrIII(OTf)4] species (1) by bubbling O2 into a mixture of Fe(TMC)(OTf)2 and Cr(OTf)2 in NCCH3. Complex 1 also formed quantitatively by adding Cr(OTf)2 to [FeIV(O)(TMC)(NCCH3)]2+. The proposed O2 activation mechanism involves the trapping of a Cr–O2 adduct by Fe(TMC)(OTf)2.
Oxygen activation is generally carried out by metalloenzymes with mononuclear or homodinuclear iron or copper active sites.1–3 However there are two notable exceptions to this generalization, namely the heme/copper center of cytochrome oxidase essential for mammalian respiration1,4,5 and the nonheme Fe–O–Mn center of Class 1c ribonucleotide reductases found in pathogenic bacteria.6,7 There has been significant progress in obtaining synthetic models for the heme/copper center of cytochrome oxidase,8–10 but less effort has been devoted to the synthesis of nonheme (μ-oxo)heterobimetallic complexes. In 1992 Wieghardt described a series of carboxylate-bridged (TACN)FeIII–O–M(Me3TACN) (M = CrIII or MnIII, TACN = 1,4,7-triazacyclononane, Me3TACN = 1,4,7-trimethyl-1,4,7-triazacyclononane) complexes obtained by hydrolysis between FeCl3(TACN) and MCl3(Me3TACN) precursors.11 More recently, Fukuzumi and Nam reported the crystal structure of a novel FeIII–O–ScIII complex, which was obtained from the reaction of [FeIV(O)(TMC)(NCCH3)]2+ (TMC = 1,4,8,11-tetramethylcyclam) with Sc(OTf)3.12 However, no synthetic nonheme Fe–O–M complex (where M is a non-iron metal) has thus far been generated by O2 activation. Here we report the characterization of [(TMC)FeIII–O–CrIII(OTf)4] (1) formed by oxygenating a mixture of Fe(TMC)(OTf)2 and Cr(OTf)2 in CH3CN at −40 °C or reacting [FeIV(O)(TMC)(NCCH3)]2+ with 1 eq. of Cr(OTf)2.
Bubbling O2 into a solution of 1 mM Fe(TMC)(OTf)2 and 1 mM Cr(OTf)2 in CH3CN at −40 °C rapidly elicited a UV-vis spectrum with bands at 358, 398, 447 and 558 nm (Fig. 1), suggesting the formation of a new species designated as 1. This spectral pattern was not observed in the absence of either Fe(TMC)(OTf)2 or Cr(OTf)2 from the reaction mixture; Fe(TMC)(OTf)2 simply did not react with O2, but the reaction of Cr(OTf)2 with O2 gave rise to features at 358 and 445 nm (Fig. 1), distinct from those of 1. Species 1 had a half-life of 10 h at −40 °C and rapidly decayed upon warming to RT. Taken together, these observations implicate both Fe and Cr in the formation of 1.
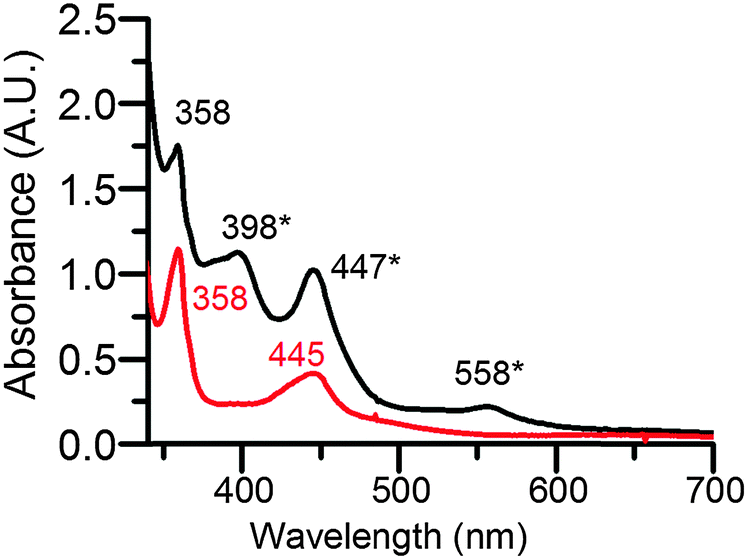 | ||
| Fig. 1 UV-vis spectra observed in CH3CN at −40 °C upon O2 exposure of 1 mM Cr(OTf)2 (red) and a mixture of 1 mM Fe(TMC)(OTf)2 and 1 mM Cr(OTf)2 (black). Bands with asterisks are associated with 1. | ||
ESI-MS analysis of the solution of 1 at −40 °C revealed dominant peaks at m/z 461.2 (positive mode) and 514.8 (negative mode) (Fig. S1, ESI†), which were not observed in oxygenated solutions lacking either Fe(TMC)(OTf)2 or Cr(OTf)2. The ions observed have masses and isotope distribution patterns that correspond to [Fe(TMC)(OTf)]+ and [CrO(OTf)3]−, respectively. Furthermore, the [CrO(OTf)3]− peak was upshifted by 2 units when 18O2 was used, showing the incorporation of an oxygen atom from O2 (Fig. S2, ESI†). Based on these results, we tentatively assign 1 as a heterobimetallic [(TMC)FeIII–O–CrIII(OTf)4] complex, which undergoes homolysis of the Fe–O bond to give rise to the observed mass spectral features.
To test this hypothesis, we investigated the reaction of [FeIV(O)(TMC)(NCCH3)]2+![[thin space (1/6-em)]](https://www.rsc.org/images/entities/char_2009.gif) 13 with Cr(OTf)2 in CH3CN at −40 °C as a more direct means of synthesizing putative species 1. As shown in Fig. 2, the addition of Cr(OTf)2 to [FeIV(O)(TMC)(NCCH3)]2+ in CH3CN solution caused the instantaneous disappearance of its characteristic 824 nm peak concomitant with the growth of bands at 398, 447, and 558 nm that are assigned to 1. Titration experiments (Fig. 2, inset) revealed that the transformation was complete upon addition of 1 eq. Cr(OTf)2, strongly suggesting a 1:1 Fe:Cr stoichiometry for 1. This solution also gave rise to ESI-MS spectra with the same dominant peaks as the complex generated by O2 activation. A control experiment between Cr(OTf)2 and PhIO did not elicit the same peaks as found in 1 (Fig. S3, ESI†), suggesting that [FeIV(O)(TMC)(NCCH3)]2+ acts more than just an oxygen atom donor to Cr(OTf)2. These results demonstrate that 1 can be generated by either O2 activation or inner-sphere electron transfer.
13 with Cr(OTf)2 in CH3CN at −40 °C as a more direct means of synthesizing putative species 1. As shown in Fig. 2, the addition of Cr(OTf)2 to [FeIV(O)(TMC)(NCCH3)]2+ in CH3CN solution caused the instantaneous disappearance of its characteristic 824 nm peak concomitant with the growth of bands at 398, 447, and 558 nm that are assigned to 1. Titration experiments (Fig. 2, inset) revealed that the transformation was complete upon addition of 1 eq. Cr(OTf)2, strongly suggesting a 1:1 Fe:Cr stoichiometry for 1. This solution also gave rise to ESI-MS spectra with the same dominant peaks as the complex generated by O2 activation. A control experiment between Cr(OTf)2 and PhIO did not elicit the same peaks as found in 1 (Fig. S3, ESI†), suggesting that [FeIV(O)(TMC)(NCCH3)]2+ acts more than just an oxygen atom donor to Cr(OTf)2. These results demonstrate that 1 can be generated by either O2 activation or inner-sphere electron transfer.
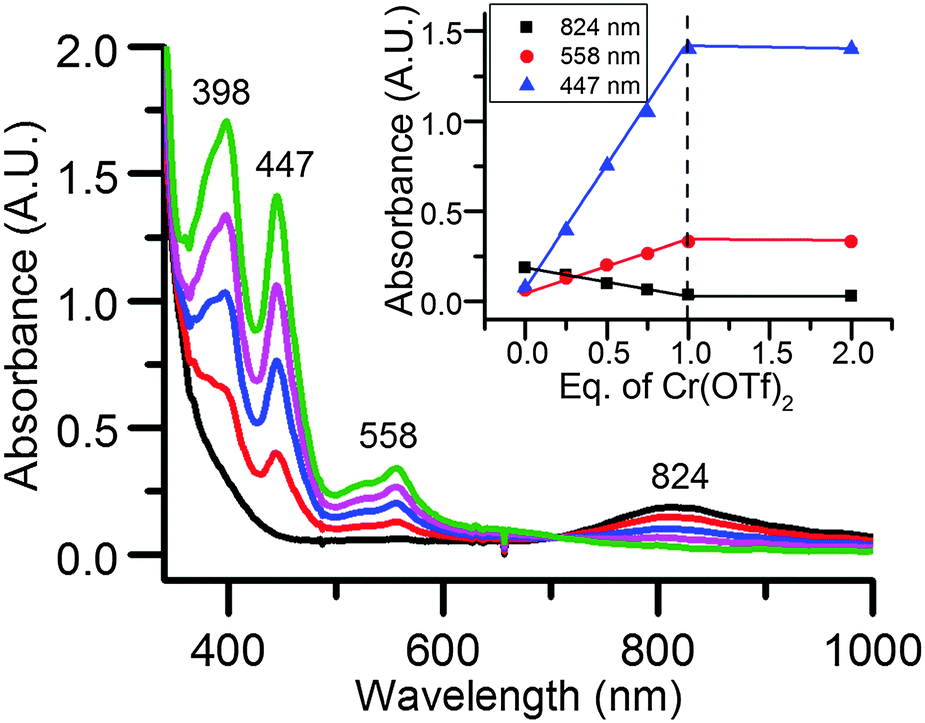 | ||
| Fig. 2 UV-vis spectral titration of 0.45 mM [FeIV(O)(TMC)(NCCH3)]2+ in CH3CN at −40 °C with Cr(OTf)2. Black, 0 eq.; red, 0.25 eq.; blue: 0.5 eq.; magenta, 0.75 eq.; green, 1 eq. Inset: Titration plot. Inset: Formation of 1vs. eq. Cr(OTf)2 added into 0.45 mM [FeIV(O)(TMC)(NCCH3)]2+ in CH3CN at −40 °C. | ||
In order to obtain structural insight, Fe K-edge X-ray absorption spectroscopy studies were carried out on 1. As shown in Fig. S4 (ESI†), the Fe K-edge of 1 was found at 7124.0 eV, which is comparable to those of known FeIII(TMC) and related complexes.14 Species 1 also exhibits a pre-edge feature that is associated with 1s-to-3d transitions with an area of 11 units. The Fourier-transformed EXAFS region revealed two prominent features at R + Δ ∼ 1.8 Å and 3.2 Å (Fig. 3, left). The best fit of the data (fit #8 in Table S1, ESI†) consisted of 1 O/N scatterer at 1.81 Å, 5 O/N scatterers at 2.17 Å, 4 C scatterers at 2.91 Å and a Cr scatterer at a distance of 3.65 Å. The 2.17 Å and 2.92 Å scatterers arise from the supporting TMC ligand, while the 1.81 Å scatterer has an Fe–O distance typically found for oxo bridges in FeIII–O–MIII complexes.15 The 3.2 Å feature corresponds to a Cr scatterer at 3.65 Å; its intensity derives from multiple scattering pathways due to a linear Fe–O–Cr core. Indeed, the Fe⋯Cr distance is typical of the metal–metal distances found for linear FeIII–O–M complexes12,16,17 and exemplified by [(py)(TPP)CrIII–O–FeIII(TMP)] (r(Fe⋯Cr) = 3.60 Å; py = pyridine; TPP = tetraphenylporphin dianion; TMP = tetramesitylporphin dianion).18 We thus propose that 1 has the structure shown in Fig. 3 right.
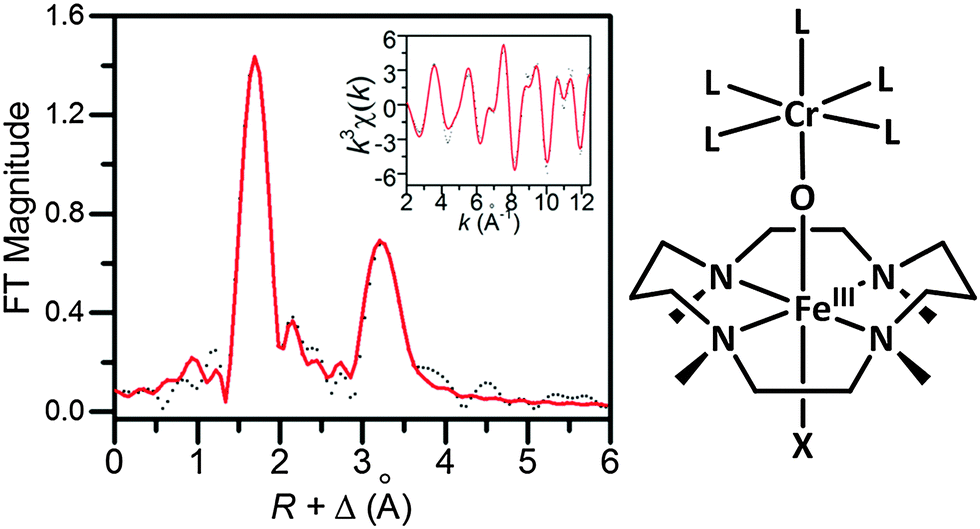 | ||
| Fig. 3 Left: Fourier-transformed Fe K-edge EXAFS data for 1 (dotted black line) and corresponding best fit (solid red line, fit #8 in Table S1, ESI†). Inset shows unfiltered k-space data and its fit. Right: Proposed structure for 1 (L = CH3CN or OTf; X = CH3CN, NCO or NCS). | ||
The proposed structure for 1 resembles that found in the crystal structures of the recently described [(TMC)FeIII–O–ScIII(OTf)4(L)] complex (2, L = H2O or NCCH3).12 However, they differ in several respects. Although the Fe⋯M distances are essentially identical for 1 and 2, the respective Fe–O and M–O distances are distinct. The Fe–O distance of 1.81 Å for 1 is 0.07 Å longer than that found for 2, while the Cr–O distance of 1.84 Å (deduced from the difference between the Fe⋯Cr and the Fe–O distances from the EXAFS analysis, assuming ∠Fe–O–Cr ∼ 180°) is 0.07 Å shorter than the Sc–O distance of 1.91 Å observed for 2 in its crystal structures. The distinct M–O distances in 1 and 2 presumably reflect the difference between the more covalent Cr–O bond and the more ionic Sc–O bond, which also affect the corresponding Fe–O bond. Another feature distinguishing 1 from 2 is the intensity of the XAS pre-edge feature. Complex 1 exhibits a pre-edge area of 11 units, typical of a six-coordinate iron(III) center,19,20 while 2 (L = NCCH3) has a much larger pre-edge area of 32 units,12 reflecting the square pyramidal geometry of its iron(III) center. Lastly, the four methyl groups of the TMC ligand are shown in Fig. 3 right as being oriented anti with respect to the oxo bridge, opposite to the orientation found crystallographically for the methyl groups in 2.12 Although we do not have direct proof, our main argument to favor the anti orientation over the syn one is the observed immediate formation of 1 upon Cr(OTf)2 addition to a solution of [FeIV(O)(TMC)(NCCH3)]2+. As the TMC methyl groups are oriented anti to the oxo moiety in the precursor,13 it seems unlikely that a change in their relative orientations could occur at −40 °C within this very short time scale.
The likelihood of a sixth ligand for the iron(III) center in 1 is supported by the change in the spectral features of 1 upon addition of NCS− or NCO−. As shown in Fig. 4, there are small shifts of the three bands, as well as increases in intensity. Titration experiments showed that only 1 eq. of NCS− or NCO− was needed to transform 1 fully into 1-NCS or 1-NCO (Fig. S5 and S6, ESI†). ESI-MS analysis of 1-NCS and 1-NCO revealed respective positive mode peaks at m/z 370 and 354, corresponding to [Fe(TMC)(NCS)]+ and [Fe(TMC)(NCO)]+ fragment ions (Fig. S7 and S8, ESI†), suggesting the occupation of the axial position trans to the oxo bridge by these anions. Furthermore, 1-NCS exhibits an Fe K-edge energy of 7124.3 eV, comparable to the 7124.0 eV value found for 1. 1-NCS also exhibits a pre-edge feature with an area of 9 units (Fig. S9, ESI†), which is close to the 11 units found for 1 but much smaller than the 32 units associated with 2, showing that a six-coordinate iron(III) center in 1-NCS is maintained. EXAFS analysis of 1-NCS shows the presence of a linear Fe–O–Cr core like that in 1, but with a 1.85 Å Fe–O bond and an Fe⋯Cr distance of 3.67 Å (Table S2 and Fig. S10, ESI†). The observed lengthening of the Fe–μ-O bond can be rationalized by the axial NCS− binding to the iron(III) center. Based on all the information above, 1 is proposed to be a heterobimetallic μ-oxo species with an Fe–O–Cr core, and the Fe atom has a 6-coordinate environment with the axial position available for ligand substitution (Fig. 3, right).
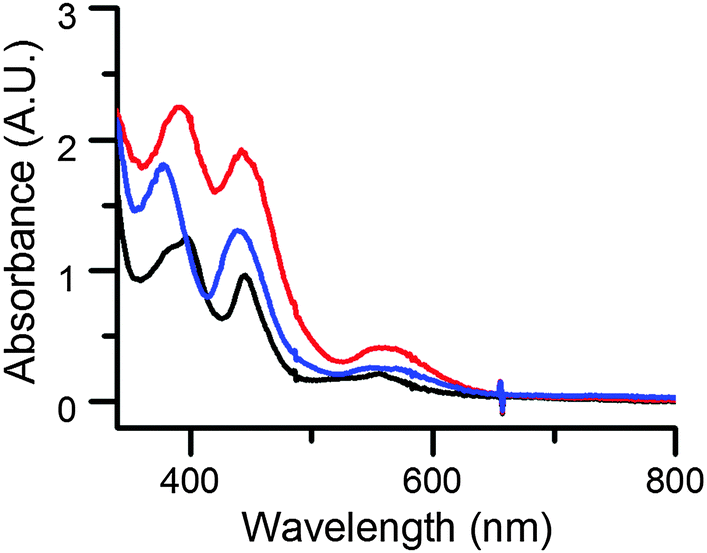 | ||
| Fig. 4 UV-vis spectra of 0.3 mM 1 (black), 1-NCO (blue), 1-NCS (red) in CH3CN at −40 °C. λmax (εM) for 1: 398 (3800), 447 (3000), and 558 (700). λmax (εM) for 1-NCO: 380 (6000), 438 (4200), and 560 (850). λmax (εM) for 1-NCS: 390 (7500), 442 (6300), and 560 (1400). | ||
Complex 1 was further studied by EPR and resonance Raman spectroscopy. It is EPR-silent, which is as expected due to antiferromagnetic coupling mediated by the oxo bridge between the Fe(III) and the Cr(III) centers, as seen for two other Fe(III)–O–Cr(III) complexes.11,18 Excitation of 1 with a 568.2 nm laser elicits a resonance-enhanced vibration at 773 cm−1 (Fig. 5), which falls within the 700–900 cm−1 range found for the νas(Fe–O–Fe) modes of oxo-bridged diiron(III) complexes.21 This assignment is corroborated by the observed downshift of this vibration to 730 cm−1 upon 18O-substitution into the oxo bridge. Although a 35 cm−1 downshift for a diatomic Fe–O mode is predicted by Hooke's Law, the experimentally obtained 18O shift is 43 cm−1. This larger than predicted shift has also been reported for corresponding vibrations of several oxo-bridged diiron(III) complexes.21 There is also a weaker feature found at 746 cm−1 that exhibits an upshift of 7 cm−1 upon 18O-substitution; this is an unusual observation that we cannot explain. The 773 cm−1 vibration is also weakly enhanced upon 514.5 nm excitation but not observed with 457.9 or 647.1 nm irradiation, suggesting that the 558 nm absorption band can be associated with a transition of the Fe–O–Cr moiety.
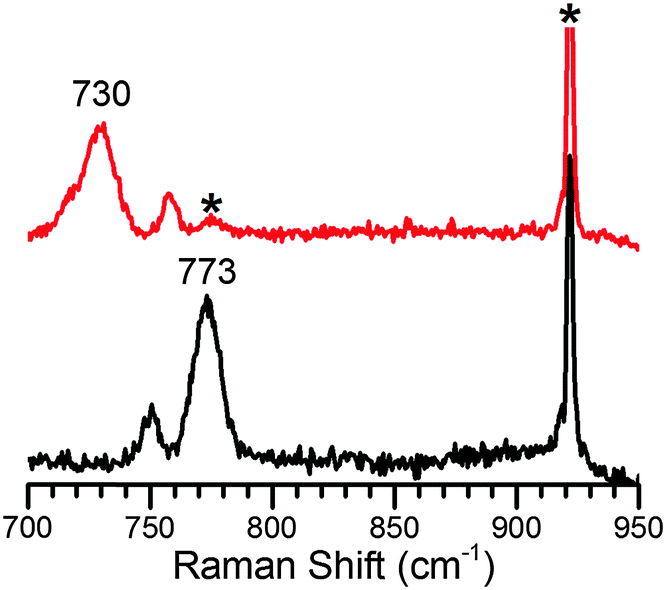 | ||
| Fig. 5 Resonance Raman spectra of 1 in CH3CN (λex = 568.2 nm, 20 mW, 77 K). Black, 16O; red, 18O. Asterisks denote solvent peaks. | ||
With the nature of 1 reasonably well characterized, we return to an analysis of the O2 activation reaction results. Based on the molar extinction coefficients of 1 determined from the stoichiometric conversion of [FeIV(O)(TMC)(NCCH3)]2+ to 1 by Cr(OTf)2, we conclude that 1 is produced in about 30% yield from the reaction of equimolar amounts of Fe(TMC)(OTf)2 and Cr(OTf)2 to O2. The yield of 1 was unchanged by increasing the Fe(TMC)(OTf)2/Cr(OTf)2 ratio from 1 to 10 ([Cr(OTf)2] = 1 mM) (Fig. S11, ESI†), suggesting that Cr(OTf)2 is the limiting reagent. In contrast, the yield of 1 increased to 95% when the concentration of Fe(TMC)(OTf)2 was fixed at 1 mM and the Cr(OTf)2 concentration was raised from 1 mM to 10 mM (Fig. S12, ESI†). Therefore, the % yield of 1 is dependent on the amount of Cr(OTf)2, but not on the amount of Fe(TMC)(OTf)2. These results can be rationalized by the O2 activation pathway proposed in Scheme 1, in which the four electrons needed to reduce O2 to the oxidation level of water are provided by 1 eq. Fe(TMC)(OTf)2 and 3 eq. Cr(OTf)2, not unlike the four redox-active centers required for O2 activation by cytochrome oxidase.4 In the present case, we postulate that O2 initially binds to the O2-sensitive Cr(OTf)2 to form a transient adduct (analogous to that characterized by Nam in the reaction of [CrII(TMC)Cl]+ with O222) that is then trapped by Fe(TMC)(OTf)2 to generate a yet unobserved FeIII–O–O–CrIII peroxo-bridged intermediate. This intermediate is then reduced by another 2 eq. Cr(OTf)2 to form 1. Thus the ca. 30% yield of 1 observed under limiting Cr conditions reflects the 1:3 stoichiometry of Fe(TMC)(OTf)2/Cr(OTf)2 needed to make 1. On the other hand, under limiting Fe conditions, enough Cr–O2 adduct is formed to react with all the available Fe(TMC)(OTf)2 to convert the latter almost quantitatively to 1.
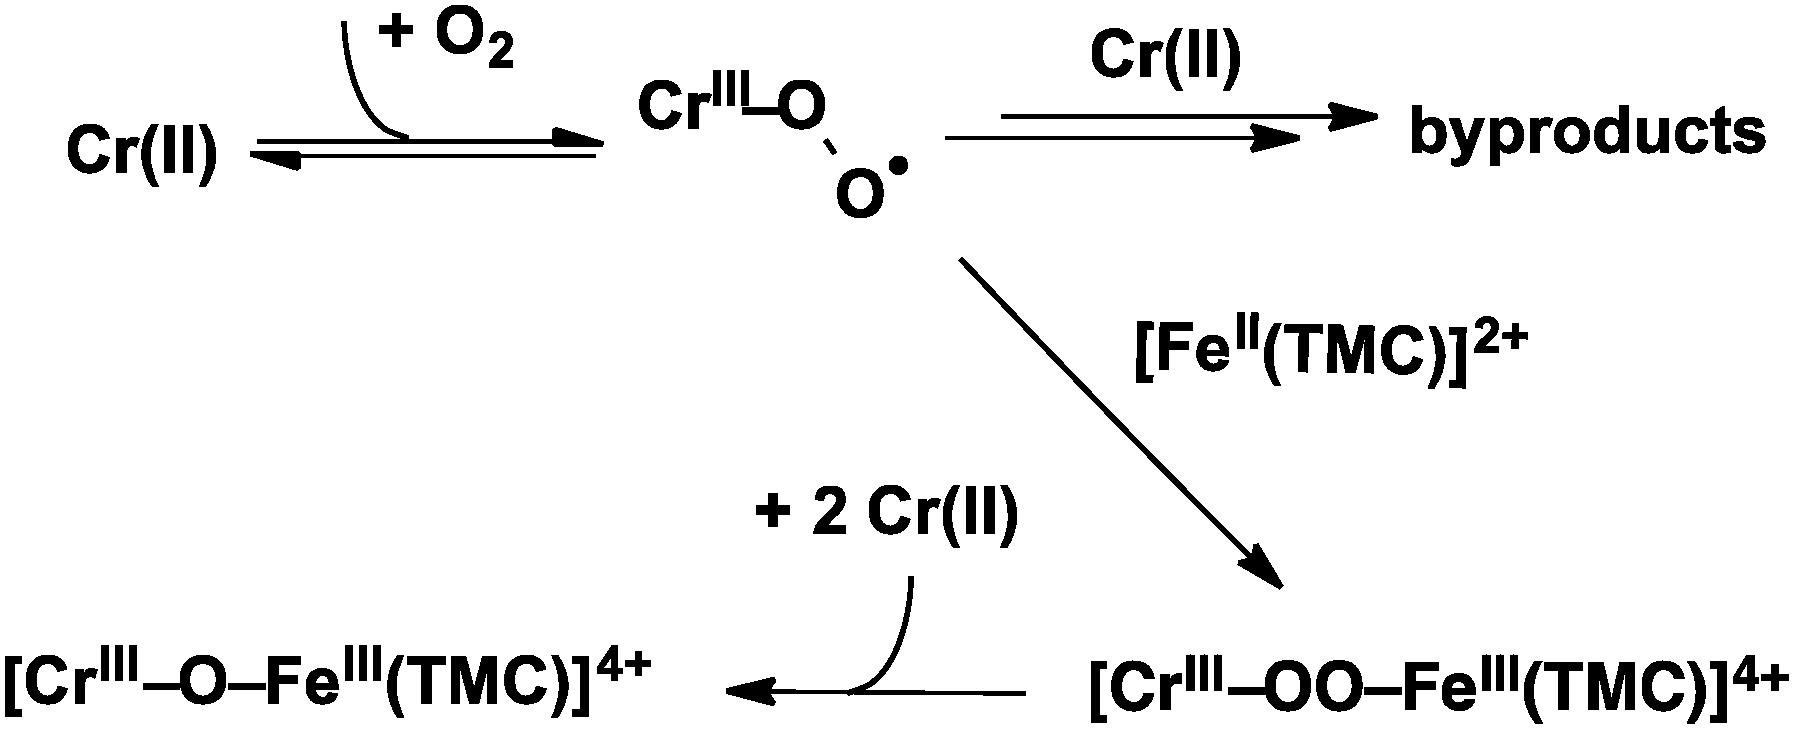 | ||
| Scheme 1 Proposed mechanism for formation of 1 by O2 activation. | ||
In conclusion, a heterobimetallic nonheme species 1 with an Fe–O–Cr core has been generated from both O2 activation and inner-sphere electron transfer. The structure of 1 was deduced by a combination of UV-vis, resonance Raman, and X-ray absorption spectroscopic methods and ESI-MS. The O2 activation mechanism for the formation of 1 is proposed to be analogous to that of cytochrome oxidase, where the initially formed O2 adduct is reduced by the other three redox-active metal centers in the enzyme, demonstrating a general strategy for O2 activation. Furthermore, 1 represents only the second example of a heterobimetallic M–O–Fe(TMC) complex, which can shed light on the effects of Lewis acidic metal centers on the redox properties of high-valent M = O species.23 Such interactions are considered important for facilitating the oxidation of water by the CaMn4O5 cluster of the oxygen evolving complex in photosynthesis.24–26 Along these lines, Lloret-Fillol and coworkers have demonstrated the formation of a related FeIV–O–CeIV intermediate in the oxidation of water by a nonheme iron catalyst with Ce(NH4)3(NO3)6 as oxidant.27
This work was supported by a grant from the US National Institutes of Health (GM-38767 to L.Q.) and a postdoctoral fellowship (GM-093479 to K.M.V.H.). XAS data were collected on Beamline X3B at the National Synchrotron Light Source, which is supported by the U.S. Department of Energy under Contract No. DE-AC02-98CH10886. Use of beamline X3B is made possible by the Center for Synchrotron Biosciences grant, P30-EB-00998, from the National Institute of Biomedical Imaging and Bioengineering. XAS data were also collected on Beamline 7-3 at the Stanford Synchrotron Radiation Lightsource, which is supported by the U.S. Department of Energy under Contract No. DE-AC02-76SF00515. Use of beamline 7-3 is supported by the DOE Office of Biological and Environmental Research, and by the National Institutes of Health, National Institute of General Medical Sciences (including P41GM103393).
References
- I. Bertini, H. Gray, E. I. Stiefel and J. S. Valentine, Biological Inorganic Chemistry: Structure and Reactivity, University Science Books, 2007, pp. 319–442 Search PubMed.
- L. Que Jr. and W. B. Tolman, Nature, 2008, 455, 333–340 CrossRef PubMed.
- E. I. Solomon, D. E. Heppner, E. M. Johnston, J. W. Ginsbach, J. Cirera, M. Qayyum, M. T. Kieber-Emmons, C. H. Kjaergaard, R. G. Hadt and L. Tian, Chem. Rev., 2014, 114, 3659–3853 CrossRef CAS PubMed.
- S. Ferguson-Miller and G. T. Babcock, Chem. Rev., 1996, 96, 2889–2908 CrossRef CAS PubMed.
- T. Tsukihara, H. Aoyama, E. Yamashita, T. Tomizaki, H. Yamaguchi, K. Shinzawa-Itoh, R. Nakashima, R. Yaono and S. Yoshikawa, Science, 1996, 272, 1136–1144 CAS.
- W. Jiang, D. Yun, L. Saleh, E. W. Barr, G. Xing, L. M. Hoffart, M.-A. Maslak, C. Krebs and J. M. Bollinger, Science, 2007, 316, 1188–1191 CrossRef CAS PubMed.
- W. Jiang, D. Yun, L. Saleh, J. M. Bollinger Jr. and C. Krebs, Biochemistry, 2008, 47, 13736–13744 CrossRef CAS PubMed.
- T. Chishiro, Y. Shimazaki, F. Tani, Y. Tachi, Y. Naruta, S. Karasawa, S. Hayami and Y. Maeda, Angew. Chem., Int. Ed., 2003, 42, 2788–2791 CrossRef CAS PubMed.
- E. Kim, E. E. Chufán, K. Kamaraj and K. D. Karlin, Chem. Rev., 2004, 104, 1077–1134 CrossRef CAS PubMed.
- E. E. Chufán, S. C. Puiu and K. D. Karlin, Acc. Chem. Res., 2007, 40, 563–572 CrossRef PubMed.
- R. Hotzelmann, K. Wieghardt, U. Floerke, H. J. Haupt, D. C. Weatherburn, J. Bonvoisin, G. Blondin and J. J. Girerd, J. Am. Chem. Soc., 1992, 114, 1681–1696 CrossRef CAS.
- (a) S. Fukuzumi, Y. Morimoto, H. Kotani, P. Naumov, Y.-M. Lee and W. Nam, Nat. Chem., 2010, 2, 756–759 CrossRef CAS PubMed; (b) M. Swart, Chem. Commun., 2013, 49, 6650–6652 RSC; (c) J. Prakash, G. T. Rohde, K. K. Meier, A. J. Jasniewski, K. M. Van Heuvelen, E. Münck and L. Que Jr., J. Am. Chem. Soc., 2015, 137, 3478–3481 CrossRef CAS PubMed.
- J.-U. Rohde, J.-H. In, M. H. Lim, W. W. Brennessel, M. R. Bukowski, A. Stubna, E. Münck, W. Nam and L. Que, Jr., Science, 2003, 299, 1037–1039 CrossRef CAS PubMed.
- (a) F. Li, PhD thesis, University of Minnesota, 2011 Search PubMed; (b) K. D. Koehntop, J.-U. Rohde, M. Costas and L. Que Jr., Dalton Trans., 2004, 3191–3198 RSC; (c) X. Shan, J.-U. Rohde, K. D. Koehntop, Y. Zhou, M. R. Bukowski, M. Costas, K. Fujisawa and L. Que, Jr., Inorg. Chem., 2007, 46, 8410–8417 CrossRef CAS PubMed.
- D. M. Kurtz Jr., Chem. Rev., 1990, 90, 585–606 CrossRef.
- S. C. Lee and R. Holm, J. Am. Chem. Soc., 1993, 115, 11789–11798 CrossRef CAS.
- J. F. Berry, E. Bill, R. García-Serres, F. Neese, T. Weyhermüller and K. Wieghardt, Inorg. Chem., 2006, 45, 2027–2037 CrossRef CAS PubMed.
- D. J. Liston, B. J. Kennedy, K. S. Murray and B. O. West, Inorg. Chem., 1985, 24, 1561–1567 CrossRef CAS.
- T. E. Westre, P. Kennepohl, J. G. DeWitt, B. Hedman, K. O. Hodgson and E. I. Solomon, J. Am. Chem. Soc., 1997, 119, 6297–6314 CrossRef CAS.
- A. Roe, D. Schneider, R. Mayer, J. Pyrz, J. Widom and L. Que Jr., J. Am. Chem. Soc., 1984, 106, 1676–1681 CrossRef CAS.
- (a) J. Sanders-Loehr, W. D. Wheeler, A. K. Shiemke, B. A. Averill and T. M. Loehr, J. Am. Chem. Soc., 1989, 111, 8084–8093 CrossRef CAS; (b) H. Zheng, Y. Zang, Y. Dong, V. G. Young, Jr. and L. Que, Jr., J. Am. Chem. Soc., 1999, 121, 2226–2235 CrossRef CAS.
- J. Cho, J. Woo and W. Nam, J. Am. Chem. Soc., 2010, 132, 5958–5959 CrossRef CAS PubMed.
- (a) S. Fukuzumi, Coord. Chem. Rev., 2013, 257, 1564–1575 CrossRef CAS PubMed; (b) W. Nam, Y.-M. Lee and S. Fukuzumi, Acc. Chem. Res., 2014, 47, 1146–1154 CrossRef CAS PubMed.
- J. Yano and V. Yachandra, Chem. Rev., 2014, 114, 4175–4205 CrossRef CAS PubMed.
- P. E. Siegbahn, Acc. Chem. Res., 2009, 42, 1871–1880 CrossRef CAS PubMed.
- E. Y. Tsui, J. S. Kanady and T. Agapie, Inorg. Chem., 2013, 52, 13833–13848 CrossRef CAS PubMed.
- Z. Codolà, L. Gómez, S. T. Kleespies, L. Que Jr., M. Costas and J. Lloret-Fillol, Nat. Commun., 2015, 6, 5865, DOI:10.1038/comms6865.
Footnotes |
| † Electronic supplementary information (ESI) available: Instrumental methods, synthetic procedures, and structural characterization. See DOI: 10.1039/c5cc05931c |
| ‡ Current address: Department of Chemistry, Harvey Mudd College, Claremont, CA 91711, USA. |
| This journal is © The Royal Society of Chemistry 2015 |