
 Open Access Article
 This Open Access Article is licensed under a
 Creative Commons Attribution 3.0 Unported Licence
Liquid interface evolution of polyhedral-like graphene
Xianjue
Chen
* and
Colin L.
Raston
*
Centre for NanoScale Science and Technology, School of Chemical and Physical Sciences, Flinders University, Bedford Park, SA 5042, Australia. E-mail: colin.raston@finders.edu.au; Tel: +61 88201 7958
First published on 11th August 2015
Abstract
Centrifugation of the graphene oxide mediated Pickering emulsion results in transforming spheroidal toluene droplets into irregular polyhedral shapes, which can be preserved into a solid three-dimensional polyhedral-like graphene oxide network featuring facets and sharp edges, using a freeze-drying strategy.
There have been a number of studies on constructing three-dimensional (3D) graphene-based materials, featuring in some review articles.1–3 They mainly involve disparate ‘bottom-up’ methods, which includes template-directed chemical vapour deposition (CVD),4 assembling exfoliated graphene using gelation or hydrothermal reduction methods,5–8 and chemical/physical assemblies with cross-linking agents.9–12 Recently a 3D carbon architecture consisting of tightly connected graphitic microstructures has been developed, involving heating glucose with ammonium salts at an elevated temperature, which offers an intimately interconnecting structure for improved electronic and mechanical properties.13 There is merit in further exploring novel and robust methods for preparing 3D graphene, especially while preserving the desired properties of graphene, as well as controlling the microstructures. In the present work we report a simple and straightforward method for the template-free construction of unique 3D graphene oxide (G-O) architectures, which involves formation of concentrated Pickering emulsions upon probe sonicating a mixture of aqueous G-O and toluene, followed by a freeze-drying process to maintain polyhedral-like G-O structures in a solid form.
G-O was prepared using the modified Hummer's method,†14,15 with the resulting sheets averagely ∼1 μm in cross section and single-layered, as established using transmission electron microscopy (TEM) and atomic force microscopy (AFM), Fig. 1a and b. The Raman spectrum of the material, Fig. 1c, shows a typical feature involving D, G, and 2D peaks for G-O, with a higher relative intensity of the D band compared to that of the G band, which indicates a high degree of disorder and symmetry breaking in the sp2 network associated with the introduction of a substantial amount of covalent functional groups.16 As investigated in previous studies,17,18 the hydrophilicity of G-O is mainly attributed to the presence of carboxyl groups at the edges. The basal plane, although interspersed with phenol hydroxyl and epoxide groups, consists of hydrophobic polyaromatic domains of unoxidized benzene rings, which renders the two-dimensional (2D) G-O amphiphilic. Consequently, G-O can be used as a colloidal surfactant in generating highly stable Pickering emulsions at water/toluene interfaces upon shaking by hand.18 The sonication process is critical for creating a large number of smaller toluene droplets in the emulsion, as highlighted in Fig. 1d, based on the simplified Young–Laplace equation: R = 2T/ΔP, where R is the radius of a droplet, T is the interfacial tension, and ΔP is the transmural pressure, which indicates that extra energy is necessary to overcome the large pressure induced from the small, highly curved droplets in an emulsion with constant interfacial tension.19
 | ||
Fig. 1 (a) TEM image of the as-prepared G-O sheets on a holey carbon coated Cu grid, and a corresponding normal-incidence selected area electron diffraction pattern (inset), showing a higher intensity of the innermost {1100} diffraction spots relative to the {2110} spots, which confirms the monolayer nature of the G-O sheets. (b) AFM image of the G-O sheets on a freshly cleaved mica, with a height profile across the indicated line showing the G-O sheets ∼1 nm in thickness. (c) Raman spectrum of the G-O sheets, with the typical D, G, and 2D peaks observed at approximately 1342 cm−1, 1595 cm−1, and 2661 cm−1, respectively. (d) A uniform Pickering emulsion phase formed by probe sonicating G-O aqueous solution (∼2 mg mL−1) and toluene (1![[thin space (1/6-em)]](https://www.rsc.org/images/entities/char_2009.gif) :1 volume ratio) for 5 minutes. Optical images obtained for (e) spheroidal and (f) polyhedral like toluene droplets surrounded by G-O taken from different regions in the Pickering emulsion establish the effect of the water fraction to the shape of the toluene droplets. (g–i) TEM images of the G-O with different morphologies formed upon drying the emulsion phase in air. (k) SEM image of the air-dried emulsion, showing the collapsed structures of G-O. :1 volume ratio) for 5 minutes. Optical images obtained for (e) spheroidal and (f) polyhedral like toluene droplets surrounded by G-O taken from different regions in the Pickering emulsion establish the effect of the water fraction to the shape of the toluene droplets. (g–i) TEM images of the G-O with different morphologies formed upon drying the emulsion phase in air. (k) SEM image of the air-dried emulsion, showing the collapsed structures of G-O. | ||
The toluene droplets stabilised by G-O in the emulsion phase are present in essentially spheroidal or polyhedral like shapes, as evident from optical observations, Fig. 1e and f, and supported by TEM, showing individual spheroidal G-O, Fig. 1g, adjacent, Fig. 1h, and highly connected polyhedral structures, Fig. 1i. However, these structures are most likely collapsed after drying in air, Fig. 1k, given that rapid evaporation of toluene can dramatically destroy the structures in the emulsion. The difference in the morphology is expected to be primarily associated with the water fraction (Vw/Ve, with Vw the volume of water and Ve the volume of the emulsion) in different regions of the emulsion, which is further discussed below. The apparent agglomeration of the bubbles, such as that given in Fig. 1h, might be attributed to the bubbles sharing the same G-O sheets in forming layers, especially in an environment with a high fraction of water, where individual droplets are more energetic favourable due to the repulsive Coulomb forces between negatively charged G-O shells.17 For a lower water fraction, where the G-O shells are in contact with each other, the van der Waals interactions and hydrophobic effect (from the unoxidized polyaromatic domains) are likely to play a pivotal role in further attracting the G-O shells together to form single boundaries. Boundaries with different polygonal shapes are evident, such as the pentagon and hexagon highlighted in Fig. 1i, which may be derived from the droplets in the shape of pentagonal and hexagonal prisms in the emulsion. Also noteworthy is that the toluene droplets still maintain their integrity even in a highly concentrated emulsion where they are significantly distorted, as shown in Fig. 1f. As the spheroidal droplets transform into polyhedral shapes, their surface area per unit volume increases, which, over a certain limit, induces the coalescence of the droplets for the particle-stabilising emulsions.20 This is a consequence of insufficient coverage of the particles to stabilise a larger interfacial area among the droplets.20 Presumably in the present case the sliding of G-O layers might spontaneously adjust the surface area to avoid coalescence, in maintaining the stability of the emulsion.21
We recently reported a method for assembling 3D hollow spheroidal G-O networks by freeze-drying Pickering emulsions in the presence of polyvinyl alcohol (PVA) which acts as an interconnecting agent.22 The present work focuses on the ability to directly preserve 3D G-O derived from the emulsion, in the absence of any additional stabilising agent, and this is possible for polyhedral-like G-O structures, as shown in Fig. 1f and i. One way of increasing the ratio of the polyhedral structures is by decreasing the fraction of water in the emulsion so that the compactness of the toluene droplets is increased. Accordingly, the emulsion in Fig. 1d was centrifuged at 1741 × g for 10 minutes, which resulted in three separated layers, Fig. 2a, with toluene on the top, an emulsion in the middle, and G-O solution at the bottom. The removal of the water from the latter G-O stabilised emulsion resulted in a gel-like material, as highlighted in Fig. 2b. This might be due to the formation of a polyhedral G-O network that allows the storage of excess interfacial shear energy, leading to an increase in the overall stability of the emulsion.23,24 Thus the emulsion phase can be isolated via removing the toluene and G-O solution from the top and bottom of the tube, respectively, which maximally preserves the structure of the emulsion formed through centrifugation, Fig. 2c. Increasing the speed and duration of centrifugation further compacts the emulsion phase, Fig. 2d, as well as spinning down the G-O sheets, with larger volumes of toluene on top being squeezed out from the emulsion at a higher centrifugation speed, 18730 × g, for 1 hour, Fig. 2e.
 | ||
| Fig. 2 (a) Photograph of three separated layers produced by centrifugation of the emulsion phase in Fig. 1d at 1741 × g for 10 minutes. (b) Inverted tube to show the gel-like emulsion phase formed upon centrifugation. (c) Photograph of the isolated emulsion phase from (a), made by cutting off the upper and lower parts of the tube, and removing the toluene and G-O solution from the top and bottom layers, respectively. (d) Photographs of the emulsions (1 mL each) subjected to different centrifugation rates, 3440 × g, 6140 × g, and 9580 × g (from left to right) for 30 minutes. (e) A phase separation obtained by a centrifugation at 18730 × g for 1 hour. FESEM images acquired from the (f) upper and (h) lower regions of the freeze-dried 3D G-O from the emulsion in (c), and the corresponding zoomed-in images (g) and (i) in the indicated square areas in (f) and (h), respectively. | ||
The isolated emulsion in Fig. 2c was immediately freeze-dried to remove the remaining toluene and water, and as revealed by the field-emission scanning electron microscopy (FESEM), a 3D G-O bulk material is maintained. The material is extremely lightweight and rather fragile due to its high porosity. The FESEM images from the selected regions, Fig. 2c, show significant differences in morphology. The upper region of the 3D G-O consists of many relatively larger bubbles up to ∼300 μm in size, Fig. 2f, with sponge-like structure between the layers of the bubbles, Fig. 2g. The lower part of the 3D G-O material is mainly comprised of relatively uniform smaller bubbles ∼5 to 20 μm in size, Fig. 2h and i. Difference in size of the bubbles in the upper and lower regions possibly relates to the differences in density of the G-O, with smaller toluene droplets leading to higher density of G-O in a given volume, which appear to move to the bottom of the emulsion phase upon centrifugation. The difference may also be related to the amphiphilicity of the G-O sheets as they become more hydrophilic when their size decreases, although in this case, the smaller stabilised droplets are not necessarily more hydrophilic, as there could be smaller G-O sheets on the larger droplets.
Understanding the structure of the 3D G-O material comes from the formation of foam on top of soapy water, Fig. 3a–c. The foam consists of air bubbles that are stabilised by continuous layers of soap acting as a surfactant.25 There is an apparent difference in morphology of bubbles in the upper and lower areas of the foam, Fig. 3a, which is associated with the water fraction. The foam closer to the water surface consists of higher fractions of water, which arises from a combination of gravity and capillary attraction.25 The ‘wet’ bubbles (with higher water fraction in the bottom region) are stabilised in essentially spheroidal-like shapes, as the air inside of the bubble is under roughly evenly distributed pressure from the outside water environment. As the foam travels further up the flask, the ‘dry’ bubbles distort to form polyhedral shapes in a space-filling packing array, as revealed in a zoomed-in image in Fig. 3b. A facet is formed when two bubbles are in contact with each other, as the air pressure on either side of the soap layer (lamella) is equal. The shape and configuration of the polyhedral structure can be interpreted using Plateau's laws.26,27 For an equilibrium foam structure, each lamella (thin film forming at the interface of two polyhedra) has constant mean curvature, and three lamellae always meet at an angle of 120° at the edges (called Plateau borders) and four edges meet at the tetrahedral angle of 109.47° to form a vertex (node), as highlighted in Fig. 3c.
 | ||
| Fig. 3 (a) Photographs of soap foam formed on top of water in a 50 mL beaker, and (b and c) zoomed-in images of the foam at the upper region, showing a polyhedral structure. (d and e) G-O with sponge-like structures present at upper regions of the freeze-dried 3D G-O. (f) G-O with facets and sharp edges that are evident in the 3D G-O. | ||
The emulsion phase shown in Fig. 2a is expected to possess a similar spatial distribution as the soap foam, Fig. 3a–c. Instead of air bubbles being contained by the soap, toluene droplets are surrounded by G-O, with a similar trend of water fraction along the vertical direction of the emulsion. Thus, Plateau's laws can be applied to assist the understanding of the polyhedral structures forming at the upper region of the 3D G-O. As shown in Fig. 3d and e, as well as the optical image in Fig. 1f and the TEM image in Fig. 1i, three G-O walls tend to join together approximately 120° relative to each other, which is indeed consistent with the lamellae meeting at the Plateau borders in the soap foam, Fig. 3b. Another important feature is the presence of a large number of facets and sharp edges in the 3D G-O, Fig. 3f. The facets might be preserved directly from the G-O lamellae, and the sharp edges are probably associated with the Plateau borders and nodes in the polyhedral-like structures.
At the lower region of the 3D G-O, the bubbles tend to be stabilised individually rather than forming closely stacked polyhedral-like structures, Fig. 4a, presumably due to the presence of a higher fraction of water outside the toluene droplets in the emulsion, circumventing adjacent G-O shells from forming stable lamellae. That said, a number of unique G-O hollow particles with random polyhedral-like structures are generated (occupying roughly one third of the volume of the 3D G-O based on FESEM), Fig. 4b–f, which feature facets and sharp edges (possibly as kinks on the G-O), and are likely to possess unique chemical and physical properties.28,29 The reason for their formation could be that only the very bottom droplets can be stabilised as nearly spheroidal structures, whereas the droplets in a higher region tend to deform to certain degrees, resulting in the formation of facets, sharp edges, and smoothly curved surfaces. This is consistent with the transition in morphology of the soap bubbles in Fig. 3a, and the FESEM images of the 3D G-O in Fig. 4. It is also possible that small polyhedral-like graphene particles created in an upper region are then drawn downwards to a lower level upon centrifugation, inducing the transformation from polyhedral to spheroidal like structures due to change in the external pressure, which could result in the appearance of wrinkles on the G-O as the specific surface area decreases, Fig. 4d. Any movement of the polyhedral-like G-O, especially along with the interactions between G-O layers, is closely associated with the rheological properties of the emulsion and is of great importance for a quantitative understanding of the system.30
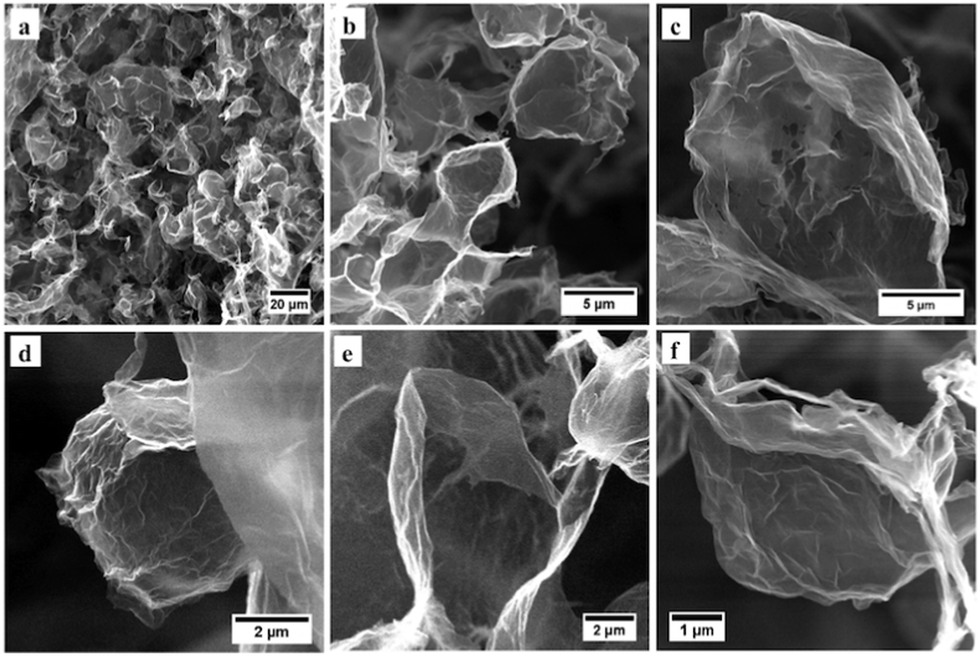 | ||
| Fig. 4 (a) FESEM image of the G-O from the lower region of the 3D G-O, and (b–f) zoomed-in images on the polyhedral-like graphene hollow particles. | ||
In conclusion, we have established a robust process to prepare self-assembled 3D G-O with unique polyhedral-like structures at toluene/water interfaces. The method is readily reproducible and potentially scalable, initially to multi-gram levels. The process opens the possibilities of constructing low dimensional (1D or 2D) amphiphilic materials into 3D polyhedral structures, beyond that of G-O. In addition, access to individual polyhedral G-O offers scope for fabricating graphene with designable spatial geometries such as different Archimedean solids, which is of significance in both fundamental research and practical applications of the material. We have also established that by analogy with foams, films and interfaces, there is potential for manipulating the assembly, morphology, and separation of laminar materials in a controlled manner.31
The authors gratefully acknowledge the Australian Research Council and the Government of South Australia for the support of this work. The inspiring discussion with Professor Rodney S. Ruoff and the assistance from Dr Christopher T. Gibson on performing the Raman spectrum analysis are gratefully acknowledged. The Centre for Microscopy, Characterisation and Analysis at the University of Western Australia, Adelaide Microscopy at the University of Adelaide, and Flinders Microscopy at Flinders University are supported by the Australian Microscopy & Microanalysis Research Facility.
Notes and references
- C. Li and G. Shi, Nanoscale, 2012, 4, 5549 RSC.
- X. Cao, Z. Yin and H. Zhang, Energy Environ. Sci., 2014, 7, 1850 CAS.
- Q. Fang, Y. Shen and B. Chen, Chem. Eng. J., 2015, 264, 753 CrossRef CAS.
- Z. Chen, W. Ren, L. Gao, B. Liu, S. Pei and H. M. Cheng, Nat. Mater., 2011, 10, 424 CrossRef CAS PubMed.
- H. Bai, C. Li, X. Wang and G. Shi, Chem. Commun., 2010, 46, 2376 RSC.
- O. C. Compton, Z. An, K. W. Putz, B. J. Hong, B. G. Hauser, L. C. Brinson and S. T. Nguyen, Carbon, 2012, 50, 3399 CrossRef CAS PubMed.
- Y. Xu, K. Sheng, C. Li and G. Shi, ACS Nano, 2010, 4, 4324 CrossRef CAS.
- Z. Tang, S. Shen, J. Zhuang and X. Wang, Angew. Chem., Int. Ed., 2010, 49, 4603 CrossRef CAS PubMed.
- Y. Zhu, L. Li, C. Zhang, G. Casillas, Z. Sun, Z. Yan, G. Ruan, Z. Peng, A.-R. O. Raji, C. Kittrell, R. H. Hauge and J. M. Tour, Nat. Commun., 2012, 3, 1225 CrossRef PubMed.
- V. C. Tung, L.-M. Chen, M. J. Allen, J. K. Wassei, K. Nelson, R. B. Kaner and Y. Yang, Nano Lett., 2009, 9, 1949 CrossRef CAS PubMed.
- S.-Z. Zu and B.-H. Han, J. Phys. Chem. C, 2009, 113, 13651 CAS.
- S. Sun and P. Wu, J. Mater. Chem., 2011, 21, 4095 RSC.
- X. Wang, Y. Zhang, C. Zhi, X. Wang, D. Tang, Y. Xu, Q. Weng, X. Jiang, M. Mitome, D. Golberg and Y. Bando, Nat. Commun., 2013, 4, 2905 Search PubMed.
- W. S. Hummers and R. E. Offeman, J. Am. Chem. Soc., 1958, 80, 1339 CrossRef CAS.
- N. I. Kovtyukhova, P. J. Ollivier, B. R. Martin, T. E. Mallouk, S. A. Chizhik, E. V. Buzaneva and A. D. Gorchinskiy, Chem. Mater., 1999, 11, 771 CrossRef CAS.
- K. N. Kudin, B. Ozbas, H. C. Schniepp, R. K. Prud'homme, I. A. Aksay and R. Car, Nano Lett., 2008, 8, 36 CrossRef CAS PubMed.
- D. R. Dreyer, S. Park, C. W. Bielawski and R. S. Ruoff, Chem. Soc. Rev., 2010, 39, 228 RSC.
- J. Kim, L. J. Cote, F. Kim, W. Yuan, K. R. Shull and J. Huang, J. Am. Chem. Soc., 2010, 132, 8180 CrossRef CAS PubMed.
- Y.-F. Maa and C. C. Hsu, Pharm. Dev. Technol., 1999, 4, 233 CrossRef CAS PubMed.
- C. P. Whitby, L. Lotte and C. Lang, Soft Matter, 2012, 8, 7784 RSC.
- L.-F. Wang, T.-B. Ma, Y.-Z. Hu and H. Wang, Phys. Rev. B: Condens. Matter Mater. Phys., 2012, 86, 125436 CrossRef.
- X. Chen, P. K. Eggers, A. D. Slattery, S. G. Ogden and C. L. Raston, J. Colloid Interface Sci., 2014, 430, 174 CrossRef CAS PubMed.
- T. G. Mason, J. Bibette and D. A. Weitz, Phys. Rev. Lett., 1995, 75, 2051 CrossRef CAS.
- H. M. Princen, J. Colloid Interface Sci., 1990, 134, 188 CrossRef CAS.
- A. Saint-Ialmes, Soft Matter, 2006, 2, 836 RSC.
- J. A. F. Plateau, Statique Experimentale et Theorique des Liquides Soumis aux Seules Forces Moleculaires, Gauthier-Villard, Paris, 1873 Search PubMed.
- J. E. Taylor, Ann. Math., 1976, 103, 489 CrossRef.
- J. T. Rasmussen, T. Gunst, P. Bøggild, A.-P. Jauho and M. Brandbyge, Beilstein J. Nanotechnol., 2013, 4, 103 CrossRef PubMed.
- H. C. Schniepp, K. N. Kudin, J.-L. Li, R. K. Prud'homme, R. Car, D. A. Saville and I. A. Aksay, ACS Nano, 2008, 2, 2577 CrossRef CAS PubMed.
- H. M. Princen, J. Colloid Interface Sci., 1983, 91, 160 CrossRef CAS.
- R. I. Saye and J. A. Sethian, Science, 2013, 340, 720 CrossRef CAS PubMed.
Footnote |
| † Methods summary: aqueous solutions of G-O at ∼2 mg mL−1 were prepared from graphite powder (SP-1, Bay Carbon) following the modified Hummer's method.14,15 Toluene from LiChrosolv, Merck Chemicals, was used directly without any pre-treatment. Direct mixing of the G-O aqueous solution and toluene in a 1:1 volume ratio affords two immiscible liquid phases with toluene as the upper layer. Probe sonication of the mixture of G-O aqueous solution and toluene produces micron sized emulsion droplets, and generates a uniform Pickering emulsion. The sonication was carried out using a Vibra-Cell™ VCX130 sonicator at 60% amplitude. The emulsion was transferred into a 15 mL centrifuge tube, and centrifuged at a speed of 1741 × g for 10 minutes in a Consul 21 centrifuger from Orto Alresa. Centrifugation at higher speeds were carried out using the Dynamica Velocity 14R. The centrifuge tube was then cut to remove the toluene and G-O solution from the top and bottom, respectively. The tube with the remaining emulsion phase was immediately dipped into liquid nitrogen for approximately 1 minute, followed by 24 hours of freeze-drying (delivery: 20 L min−1, ultimate vacuum: 8 mbar). A 3D structure with minor volume change was maintained after the drying. The optical images were acquired using the Olympus BX51 upright optical microscope featuring with 40× lens at Adelaide Microscopy. TEM specimens were prepared by depositing a drop of the samples onto a holey carbon coated copper grid (#2450-AB, SPI Supplies) and dried under ambient conditions. TEM characterizations were carried out using the JEOL 2100F instrument operating at 120 kV at the University of Western Australia, and Philips CM200 instrument operating at 200 kV at Adelaide Microscopy. Image J software was used for processing all the TEM images. AFM analysis in tapping mode was performed with a multimode AFM head and a NanoScope V controller (Digital Instruments, Veeco, Santa Barbra, USA) in ambient conditions, with free Gwyddion software for processing the image. Samples were deposited on freshly cleaved mica substrates and dried in air prior to analysis. Raman spectra were acquired using a Witec alpha300R Raman microscope with excitation laser wavelength of 532 nm (≤5 mW) at room temperature. The spectra were recorded with an ×40 objective (numerical aperture 0.60) with typical integrations times between 10 to 20 seconds with 3 accumulations per spectrum. SEM images were acquired with a high voltage of 20 kV and working distance of 10 mm, using the Inspect F50 from FEI at Flinders University. |
| This journal is © The Royal Society of Chemistry 2015 |