 Open Access Article
A cross reactive sensor array to probe divalent metal ions†
A. M.
Mallet
a,
A. B.
Davis
b,
D. R.
Davis
b,
J.
Panella
b,
K. J.
Wallace
*b and
M.
Bonizzoni
*a
aDepartment of Chemistry, The University of Alabama, Tuscaloosa, Alabama 35487, USA. E-mail: marco.bonizzoni@ua.edu; Tel: +1 205-348-2211
bDepartment of Chemistry and Biochemistry, University of Southern Mississippi, Hattiesburg, Mississippi 39406, USA. E-mail: karl.wallace@usm.edu; Tel: +1 601-266-6075
First published on 30th September 2015
Abstract
A simple sensing ensemble was designed to discriminate structurally similar divalent metal chlorides utilizing multivariate data analysis. The system features the binding of four synthesized coumarin-enamine probes to a series of ten metal chlorides. Linear discriminant analysis (LDA) achieves what univariate data analysis alone cannot i.e., full analyte discrimination and differentiation.
Traditional sensing customarily employs “lock-and-key” receptors requiring synthesis of highly-selective, unique sensors for each analyte to be detected.1,2 The synthesis of such stimuli responsive compounds is often quite difficult and time-consuming, therefore producing a specific molecular probe for a target of interest may often be impractical. Moreover, many molecular probes are not selective. A more attractive approach to chemical sensing has begun to emerge; that is the use of cross reactive sensor arrays that exploit a series of non-selective, differential chemosensors,3–6 inspired by the mammalian olfactory and taste systems.
The advantage of cross-reactive arrays lies in the amount of data that is generated quickly and analysed using chemometric techniques that assist in simplifying and interpreting said data.2,7 Additionally, the power of such cross-reactive systems comes from collecting multivariable instrumental responses. Subtle correlations between instrumental variables can often be overlooked in univariate data collection in favour of simpler data interpretation. On the other hand, it is well known in the chemometric community that the correlation information, which is otherwise not captured in univariate data sets, renders multivariate analysis methods invariably more powerful than univariate techniques.8
Here we report our findings on the use of multivariate pattern recognition approaches to the binding between coumarin-enamine probes (Fig. 1) and ten divalent metal ions. Coumarin-based molecular probes are attractive due to their unusual photophysical properties in different media.9,10 As a result of these unique properties, they have been used as colorimetric sensors.10–13 It has recently been shown that coumarin probes (1) and (4) have been able to selectively detect cyanide anions.9 In addition to their reactivity to nucleophilic anions, these probes contain Lewis basic sites which can coordinate metal ions, so we report here on the striking results obtained by expanding their sensing scope to divalent metal ions using pattern recognition methods in DMSO, a highly polar solvent.
The detection of metal cations is of great continuing interest:14,15 metal ions are ubiquitous, and many members of this family pose serious health and environmental risks.16–18 It is becoming more apparent that metal ions, in particular iron, zinc and copper play key roles in neurodegenerative diseases that have been linked to increasing levels of metals in certain areas of the brain (“metal-based neurodegeneration hypothesis”). Therefore, synthesizing molecular probes that can selectively target these metal ions is an area of interest.17 Moreover, cadmium, lead, and mercury are highly toxic metals associated with severe health risks.19 Some array methods for the detection of metal cations have been previously proposed by the Anzenbacher group,20 and by others,21–23 but analyte panels invariably contained cations with different oxidation states. We concentrated our attention on a homogeneous series of cations in order to highlight subtler structural differences that are not dictated by simple charge effects. In particular, we used metal(II) chlorides to highlight differences arising from the nature of the cation itself, rather than from the ion pairing. Chloride is a relatively inert counterion common to all fields of application of metal sensing. Multiple analyte detection is generally achieved by utilizing Boolean logic, and at most four analytes at a time are screened. Here we report the use of a family of structurally similar coumarin-enamine molecular probes that can discriminate between ten divalent metal cations. To the best of our knowledge, there are only a handful of cross-reactive systems capable of screening this high number of closely related divalent metal ions in a single experiment. However, these systems use a mixture of charges in their sensor array.
In this current system a dye–metal complex is adopted, wherein coordination occurs via the Lewis basic sites. The initial binding interaction between probes 1 to 5 with various divalent metal salts was carried out in DMSO solution through optical spectroscopic methods (absorbance and fluorescence emission). The coumarin enamine probes are only sparingly soluble in water, so the highly polar DMSO was selected as a close replacement for an aqueous environment. As aliquots of a solution of the metal ion are added, we observed a decrease in the fluorescence intensity indicative of a binding interaction (see ESI† Fig. S1). We were also able to determine binding constants for selected metal ions and ligands, and the limit of detection associated with this determination method (see ESI†).
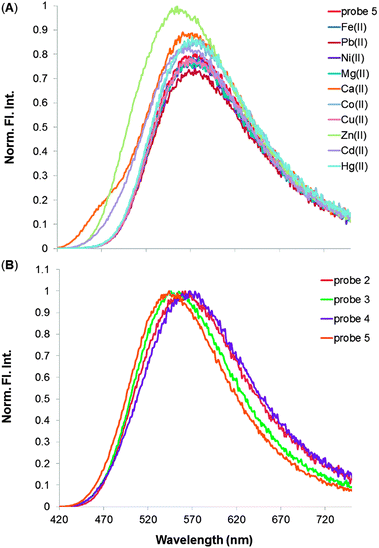
Although these coumarin dyes are good ligands, they were found to be poorly selective in their binding to different metal ions, as shown in Fig. 2A in the case of probe 5: the sensor clearly responds to the metal ion analytes, as indicated by the change in the emission signal, but different analytes cause a similar response. Analyte discrimination purely on the basis of the fluorescence intensity signal recovered from such binding measurements was not possible. The other coumarin-enamine probes were subjected to similar studies, which produced comparable results (see ESI†). In short, the univariate analysis alone did not provide analytical differentiation among the series of metal chlorides under study.
It became apparent that the univalent approach omitted a lot of information. However, more data was present in these systems than could be captured by the simple univariate response to a single probe. In fact, all the coumarin-enamine probes shown in Fig. 1 bind to divalent metal cations, each one more or less effectively, but the signal differences among the individual analytes are small for each probe, as illustrated in the case of Zn(II) metal ion in Fig. 2B.
In order to capture this wealth of information and to be able to carry out the discrimination of metal cations as proposed, a multivariate approach was adopted. Further studies were conducted on a multimode microwell plate reader allowing for rapid and automated acquisition of multivariate data. The sensor array was comprised of compounds 2 to 5. Compound 1 does not possess a chelating binding site on the aromatic ring system, so it was used as a reference for experimental consistency (see ESI† for experimental details). We monitored the absorbance response of this array of four sensors at 330, 380, 400, 430 nm, and fluorescence intensity at 330/450 nm, 330/528 nm, 330/580 nm, 380/450 nm, 380/528 nm, and 380/450 nm (λexc/λem), for a total of ten instrumental variables, which were all used concurrently in the procedures described below. The sensing array was exposed to a panel of analytes comprising the following metal ions, as chloride salts: Ca(II), Cd(II), Co(II), Cu(II), Fe(II), Hg(II), Mg(II), Ni(II), Pb(II), Zn(II); all measurements were conducted in the same solvent as the univariate analysis for consistency (DMSO). The sensor array was exposed to each metal multiple times, generating a cluster of 18 replicates for each analyte. This approach generated a very large multivariate data set (4 × sensors by 10 × analytes by 18 × replicates = 720 data points, each described by nine instrumental variables). Linear discriminant analysis (LDA) was used to organize the high-dimensionality data and to extract the most relevant information, ultimately providing the information necessary to classify the ten analytes considered.
The well-established LDA algorithm computes a linear combination of the original variables that maximizes the separation between multiple analytes, while minimizing the separation between replicate measurements of the same analyte.24,25 In doing so, the algorithm generates a new set of variables, called factors, which are returned ordered by decreasing relative information content. Data reduction is then accomplished by retaining only the first two or three LDA factors and dropping the higher order ones. This produces a transformed data set, in which each point is associated with a pair or a triplet of numbers, respectively, typically referred to as the factor scores of those points. These factor scores can be used as coordinates in plotting the transformed points in either a two- or three-dimensional plot.
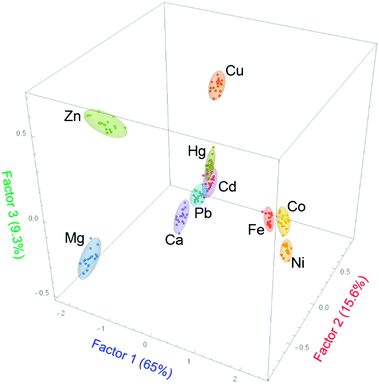
In the present study, the first two factors obtained from the LDA analysis, out of the ten present in the system (see ESI†), accounted for 80.7% of the total information content of the original system. A two-dimensional score plot (Fig. 3) was obtained that shows clear clustering of the data: replicate measurements of samples of each divalent metal ion are classified as similar and grouped together by the LDA analysis. In short, the pattern-based approach is capable of differentiating almost all ten divalent metal cations, using the additional information collected through patterning and multivariate analysis.
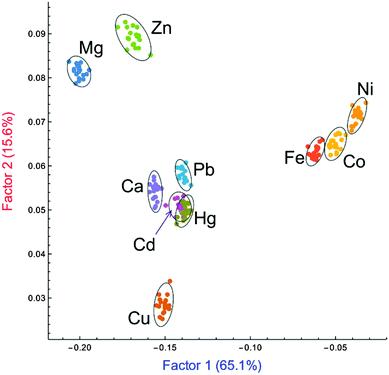 | ||
| Fig. 3 Two-dimensional LDA score plot for the analysis of probes 2–5 binding 10 divalent metal chlorides (confidence ellipsoids at 95% probability). | ||
In addition to the excellent analytical results, further features of the score plot are still under investigation to interpret the clustering position in terms of the chemical properties of the relevant metal ions (e.g. ionic radius, coordination number and geometry).
Although the analytical discriminatory power of the system as described above is already significant, more information is stored in the system than can be represented with a simple two-dimensional plot. In fact, as mentioned above, the plot in Fig. 3 only captures ca. 81% of the total information available in the analytical results. We were able to obtain better analyte discrimination using a larger portion of those results, i.e. by adding a third dimension as shown in the three-dimensional score plot in Fig. 4. The third factor contributes another significant 9.3% of the total information content, bringing the captured information content to 90% overall. This third factor allowed for better differentiation of metal ions, which was especially useful in those difficult cases that were not well differentiated in the two-dimensional plot.
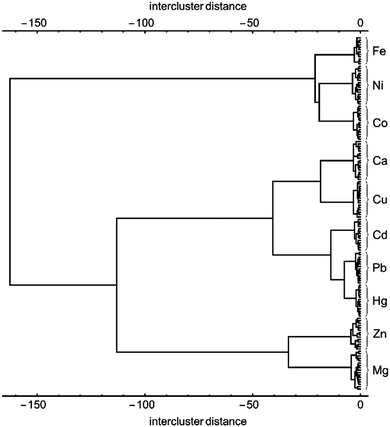
The clustering presented in Fig. 4 obtained from LDA analysis and data reduction takes advantage of a total of 90% of the information content available from the multivariate pattern response. This is the most information that can be easily presented in graphical form, but of course machine learning methods are not constrained to working in three dimensions. Using hierarchical classification one can take advantage of the entire information content gleaned from the multivariate response described above.26 The results of such an analysis based on Manhattan distance and Ward linkages, are shown in Fig. 5 as a dendrogram. The classification is improved when compared to the clustering shown in Fig. 4, but many of the classification features are maintained. For instance, one major group includes Fe(II), Ni(II) and Co(II) on the one hand, and all the remaining metal ions on the other. Similarly, Hg(II), Pb(II) and Cd(II) samples are clustered in very close proximity to each other. Both observations are in agreement with the situation observed in the LDA clustering plots shown in Fig. 3 and 4.
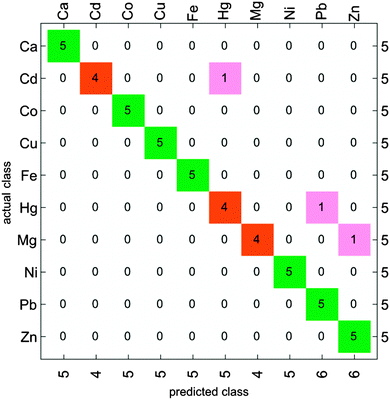
The classification accuracy of the method is the best representation of its chemical selectivity. This parameter can be more easily estimated using clustering analysis. To this end, each data set was divided in two groups of samples: five samples from each set were used as a classification test set, and the remaining ones were grouped together to form the training set for a naïve Bayes classifier. The resulting classification accuracy matrix is shown in Fig. 6. Although some samples from analytes that were reported as poorly separated in previous analyses were still misclassified (e.g. Cd(II) → Hg(II), Hg(II) → Pb(II), Mg(II) → Zn(II)), re-classification analysis reported excellent overall accuracy for this classifier (94%, see Fig. 6).
Finally, we considered the relative contributions of each of the cross-reactive sensors to the overall discrimination and of each instrumental variable in the multivariate set (see ESI†). The loading plot provides the relative contribution of the original absorbance or fluorescence variables to each of the two factors we selected providing insight into the origin of the discriminatory power of the system. The loading plot clearly demonstrates that probes 2 and 4 provide the most information to the system.
In summary, we presented here the use of a series of coumarin-enamine chromogenic and fluorescent probes to construct a sensing array capable of discriminating ten divalent metal ions as their chloride salts. To the best of our knowledge this is the first time that structurally similar fluorophores have been shown to discriminate a large number of metal ions of the same oxidation state. Multivariate analysis paired with pattern-based recognition achieved what the univariate approach could not, i.e. the effective differentiation of most divalent metal cations in our extensive analyte panel. The sensing system was simple to set up; optical spectroscopy coupled with a multi-well plate reader gave us ready access to a multivariate data set through automation-friendly methods. We obtained excellent cluster dispersion for most analytes, giving remarkable discrimination capacity over an uncommonly vast and highly diverse panel of ten analytes comprising metal ions from the main group as well as the d-transition series. We are currently expanding the analytical scope of our sensing system to include trivalent metal ions as well as other counter-ions in order to be able to differentiate ion pairs.
We gratefully acknowledge the support of The University of Alabama faculty start-up funds and the KJW group is grateful for the financial support from NSF Grant OCE-0963064.
Notes and references
- K. J. Albert, N. S. Lewis, C. L. Schauer, G. A. Sotzing, S. E. Stitzel, T. P. Vaid and D. R. Walt, Chem. Rev., 2000, 100, 2595–2626 CrossRef CAS PubMed.
- B. E. Collins, A. T. Wright and E. V. Anslyn, Top. Curr. Chem., 2007, 277, 181–218 CrossRef CAS.
- M. A. Palacios, R. Nishiyabu, M. Marquez and P. Anzenbacher, J. Am. Chem. Soc., 2007, 129, 7538–7544 CrossRef CAS PubMed.
- P. Anzenbacher Jr., P. Lubal, P. Bucek, M. A. Palacios and M. E. Kozelkova, Chem. Soc. Rev., 2010, 39, 3954–3979 RSC.
- A. T. Wright, E. V. Anslyn and J. T. McDevitt, J. Am. Chem. Soc., 2005, 127, 17405–17411 CrossRef CAS PubMed.
- H. S. Hewage and E. V. Anslyn, J. Am. Chem. Soc., 2009, 131, 13099–13106 CrossRef CAS PubMed.
- S. H. Shabbir, L. A. Joyce, G. M. da Cruz, V. M. Lynch, S. Sorey and E. V. Anslyn, J. Am. Chem. Soc., 2009, 131, 13125–13131 CrossRef CAS PubMed.
- R. Bro, Anal. Chim. Acta, 2003, 500, 185–194 CrossRef CAS.
- A. B. Davis, R. E. Lambert, F. R. Fronczek, P. J. Cragg and K. J. Wallace, New J. Chem., 2014, 38, 4678–4683 RSC.
- S. Nad, M. Kumbhakar and H. Pal, J. Phys. Chem. A, 2003, 107, 4808–4816 CrossRef CAS.
- H. J. Kim, K. C. Ko, J. H. Lee, J. Y. Lee and J. S. Kim, Chem. Commun., 2011, 47, 2886–2888 RSC.
- G. Kim and H. Kim, Tetrahedron Lett., 2010, 51, 2914–2916 CrossRef CAS PubMed.
- M. Cigáň, J. Donovalová, V. Szöcs, J. Gašpar, K. Jakusová and A. Gáplovský, J. Phys. Chem. A, 2013, 117, 4870–4883 CrossRef PubMed.
- M. C. Yeung and V. W. Yam, Chem. Soc. Rev., 2015, 44, 4192–4202 RSC.
- M. H. Lee, J. S. Kim and J. L. Sessler, Chem. Soc. Rev., 2015, 44, 4185–4191 RSC.
- T. Balaji, S. El-Safty, H. Matsunaga, T. Hanaoka and F. Mizukami, Angew. Chem., Int. Ed., 2006, 45, 7202–7208 CrossRef CAS PubMed.
- D. T. Quang and J. S. Kim, Chem. Rev., 2010, 110, 6280–6301 CrossRef CAS PubMed.
- S. M. Z. Hossain and J. D. Brennan, Anal. Chem., 2011, 83, 8772–8778 CrossRef CAS PubMed.
- C. Vieira, S. Morais, S. Ramos, C. Delerue-Matos and M. B. P. P. Oliveira, Food Chem. Toxicol., 2011, 49, 923–932 CrossRef CAS PubMed.
- M. A. Palacios, Z. Wang, V. A. Montes, G. V. Zyryanov and P. Anzenbacher, J. Am. Chem. Soc., 2008, 130(31), 10307–10314 CrossRef CAS PubMed.
- L. Y. Niua, H. Li, L. Feng, Y. S. Guan, Y. Z. Chen, C. F. Duan, L. Z. Wu, Y. F. Guan, C. H. Tung and Q. Z. Yang, Anal. Chim. Acta, 2013, 775, 93–99 CrossRef PubMed.
- L. Feng, Y. Zhang, L. Wen, L. Chen, Z. Shen and Y. Guan, Chem. – Eur. J., 2011, 17, 1101–1104 CrossRef CAS PubMed.
- For a review of similar efforts, see: M. Chhatwal, A. Kumar, V. Singh, R. D. Gupta and S. K. Awasthi, Coord. Chem. Rev., 2015, 292, 30–55 CrossRef CAS PubMed.
- Y. Roggo, L. Duponchel and J. Huvenne, Anal. Chim. Acta, 2003, 477, 187–200 CrossRef CAS.
- R. G. Brereton, Chemometrics: Data Analysis for the Laboratory and Chemical Plant, Wiley, Chichester, West Sussex, England, 2003 Search PubMed.
- C. Skuta, P. Bartunek and D. Svozil, J. Cheminf., 2014, 6, 44/1–44/9 Search PubMed.
Footnote |
| † Electronic supplementary information (ESI) available. See DOI: 10.1039/c5cc05489c |
| This journal is © The Royal Society of Chemistry 2015 |


